info@biomedres.us
+1 (502) 904-2126
One Westbrook Corporate Center, Suite 300, Westchester, IL 60154, USA
Site Map

Received: December 18, 2019; Published: January 09, 2019
*Corresponding author: Dale Feldman, Department of Biomedical Engineering, UAB, USA
DOI: 10.26717/BJSTR.2019.12.002329


Too often research papers that claim to be designing a better clinical treatment, in tissue engineering/ regenerative medicine, use the scientific method to prove that the new design gives a statistically significant difference in an important bioprocess; without discussing how this improvement helps meet the desired clinical performance requirements. An important clinical performance bioprocess, in tissue engineering/ regenerative medicine, is the rate of the healing/regeneration bioprocess. In designing treatments, in this case, the critical relationship is between design parameters and the healing/regeneration rate. Typically, before the relationship between design parameters and clinical performance can be tested, the design needs to be proven with preclinical tests in an animal model; preceded by in vitro evaluation. Part of the design process is to develop models that predict clinical performance based on preclinical performance. The whole process is iterative, since it is unlikely that achieving the selected preclinical bioprocess performance goals will initially lead to meeting the clinical performance goals.
The more quantitatively the relationships are modelled in the bioprocess cascade the easier it is to make tweaks in the performance goals for a bioprocess to help meet the clinical performance goals. The goal of this paper is to help justify the importance of quantifying the relationship between design parameters and bioprocess rates (with clinical performance bioprocess rates the most important) in general and by the use of three examples: wound healing, drug delivery, and fracture fixation. For wound healing, it is important to measure the bioprocesses that make up the actual healing rate (an important clinical outcome) as well as the relationships between design changes and clinical outcome. For drug delivery, the critical part usually left out is the bioprocess of breakdown of the drug being delivered. For fracture fixation, a degradable regenerative bone plate was used as an example. In this case, in vivo bioprocesses of material degradation and tissue healing/regeneration should be characterized both separately and how they influence each other.
Keywords: Tissue Engineering Design; Healing Rate Determination; Predictive Clinical Models
The underlying premise for this paper is that research articles, especially in tissue engineering/ regenerative medicine have to show how the proposed design helps meet the clinical performance requirements (in engineering terminology: clinical performance design constraints). Too often research papers that are trying to design a better clinical treatment use the scientific method vs. the engineering design process. It is not good enough to prove that the new design gives a statistically significant difference in an important bioprocess without discussing how this difference would lead to meeting the clinical performance requirement. So, without knowing the relationship between improvements in the measured bioprocess(es) and clinical performance little can be said about the clinical relevance of the study. The effectiveness of a clinical treatment is judged by quantification of results. This can be effectiveness for an individual or for a group of patients in a study to prove effectiveness of a treatment compared to current treatments.
This can be in terms of patient health, time (treatment, recovery, return to work, etc.), cost (to patient, to healthcare providers, or insurance companies), or human factors (success rate, ease of use, or training required). This paper will concentrate on bioprocesses that affect patient health, but also relate to the other measures of effectiveness. The theme is that quantification of the rate of these bioprocesses is critical to designing successful clinical treatments. Patient health can be assessed in a number of ways from levels of specific biochemicals to functional tests. Although it is important to quantify all these bioprocesses, to be useful they need to be related to the clinical performance bioprocesses (typically performance design constraints measured as rates).
In Tissue Engineering the rate of restoration of structure and function are the key clinical parameters. Further the theoretical limits of rate of restoration can help determine, if a treatment strategy is even feasible. I. e. the rate of tissue regeneration is good in some tissues (epithelium) and poor in others (nervous tissue and cardiac muscle) [1]. The regeneration rate of a tissue is controlled by bioprocesses that determine healing rate. This may or may not be similar to the turnover rate (in vivo replacement time) which can be days for endothelial cells to years for bone [2]. The fact that there is tissue turnover shows the ability of tissue to regenerate. In addition, fetal wound healing is mostly regenerative although its ability is lost (healing occurs more and more by scarring) as we age [1,3-5]. Most of the difference is due to the number of available stem cells, the type of ECM (extracellular matrix), and the availability of specific biochemical [1,3,5,6]. These are the three critical parts of a tissue engineered product: cells (e.g. stem cells), biomaterial (e.g. scaffold), and biological response modifiers (e.g. growth factors).
Much of the research in tissue engineering/regenerative medicine is to move closer to the fetal wound healing environment. Each of the three parts can be individually modified, but a modification of one has an effect on the other two. In addition, the speed of regenerative healing plays a big part in the health care cost in terms of time (return of function) and resources needed for treatment and rehabilitation. The strategy used affects the development time including obtaining regulatory approval (which increases significantly as the device adds cells and/or growth factors). Although faster healing appears to be a laudable goal; a key part of the design process is often left out: establishing a problem. This is in two parts:
a) Show how far short of the desired clinical parameters are current treatments and
b) How significant a problem is this? In essence is the potential benefit of a tissue engineering solution worth the cost and time to develop.
Part of this is determining how big a difference in clinical performance would actually make a difference. It may be worthwhile to determine the biggest improvement in clinical performance possible; but eventually balance the benefit of increased performance with longer development time (particularly regulatory approval) and additional cost of the device. The goal should therefore be the simplest design that meets the desired clinical performance.
Cells: For cells, the key bioprocesses are rate of mitosis, differentiation (if a stem cell), migration, and protein production. The rate of these functions for native cells determines whether additional help is needed by adding any or all of the three tissue engineering parts: stem cells, growth factors, or a biomaterial scaffold. Cells can influence the other two parts by producing ECM and releasing growth factors [6]. The cells can also be genetically modified to overproduce specific ECM or growth factors [7].
Biomaterial: For a biomaterial, the key bioprocesses are degradation rate and tissue ingrowth/ regeneration rate. There are many design features and other bioprocesses that control the rate of these two bioprocesses including: pore size, porosity, surface energy, surface charge, and surface roughness (for design), which affect cell attachment rate and blood vessel ingrowth rate (for bioprocesses) and therefore affect the healing environment (cell density, oxygen level, etc.) [1,6,8,9]. Current technology has not really produced tissue engineered products that serve as a regenerated functional organ, so they need to serve as degradable regenerative scaffolds. The inability to “tissue engineer” functional organs actually follows the in vivo model for adult wound healing. Healing typically goes through a provisional matrix (fibrin) and one or more types of tissue that are remodelled to become as close as possible to the original structure. The less regenerative a tissue is the more scar tissue is present and the more it becomes a repair vs. regeneration [3]. Similarly, most tissue/organ grafts require replacement and/or remodelling over time to be functional.
Even when tissue or organ grafts can be synthesized in vitro the biggest issue is how to incorporate them into the surrounding tissue (e.g. cartilage grafts) and then they still serve more as a degradable regenerative scaffold (like other grafts). The need to be degradable therefore mimics the most common natural scaffold: fibrin. In most cases, if the scaffold does not degrade there is no place for the regenerated tissue to go. It also works best, if its surface erodes at the rate of tissue ingrowth. It should serve as a scaffold for the proliferating cells to attach to and then produce their own ECM. Also, key is a structure that allows blood vessel ingrowth to provide the oxygen for the cells to produce the ECM. It is a slower process for the cells to only grow into the ECM they have produced [1,6]. The biomaterial may also serve more a mechanical or protective function. Although the stiffness of the biomaterial has been shown to alter migration over its surface, its stiffness in orthopedic applications determines the load distribution between biomaterial and host tissue. Most biological tissue heals faster at a higher load (just below its failure level) [1,6].
As the tissue heals it can handle more loading, which is a benefit of a degradable material: transferring more load as it degrades. The biomaterial can influence the other two parts mostly by cell-matrix interactions [6], which affect the cell’s bioprocesses as well as the type and amount of growth factors and ECM they produce. The biomaterial can also have cells and growth factors incorporated into them [1,10,11].
Biological Response Modifier: The biological response modifiers can be growth factors, but also other changes in the cell environment that elicit an adaptive response (e.g. oxygen and electrical stimulation). For growth factors the key bioprocesses are release rate (both amount and amount per unit time [kinetics]). The growth factor in a dose dependent manner affects the cells bioprocesses as well as the type and amount of growth factors and ECM they produce [1,6]. Also, as previously stated, both the biomaterial and the cells can serve as drug delivery systems [1,7,10].
Clinical Performance Requirements: Therefore, the key clinical assessment, in this case, is time to complete functional recovery (or some clinically acceptable percent of function). Normally these are measured as rates (healing rate and functional recovery rate). Even though the rates can change over time, determining the rate at different time intervals during treatment can be used to compare treatments as well as see in which time intervals improvements could be made. These two rates are controlled by the rates of the bioprocesses for each of the three components in tissue engineering [1,6]. The design challenge is to determine the optimal mix of the bioprocesses to achieve the best clinical outcome for a particular case. In some cases, a bioprocess may be a rate limiting step (i.e. its rate controls another bioprocess rate). An example is the one previously mentioned; blood vessel ingrowth. Fibroblasts need to be close enough to the blood supply to get enough oxygen to proliferate and produce ECM [1,6]. Therefore, blood vessel ingrowth limits the rate of fibroblast ingrowth. This can be important in design to decide, if some exogenous item (e.g. cells or growth factor) needs to be added to increase the rate of a rate limiting step in order for it to be useful clinically.
Preclinical to Clinical Models: Another key is to quantify the relationship between design parameters and clinical outcome (healing rate and recovery rate). An important step in the engineering design process is determining the desired performance constrains (what the design needs to do). This can be at the clinical level, the bioprocess level, or the material level. There are also design constrain to that are related to the design. These can be size, weight, composition, or strength. In most cases, these design parameters (design constraints) are selected to meet a performance constraint(s). This tends to be an iterative process, since we typically do not know the relationship between design parameters and clinical outcome, until a design is tested clinically. This is a critical part of the regulatory process; however, most implant manufacturers show that if the device is made within certain design parameter ranges it meets or exceeds the clinical performance constraints. In order to get the actual relationships between design parameters and clinical outcome the bioprocess rates need to be quantified; in most cases, it is not feasible to get the relationship between design parameters and clinical outcome directly.
The development process, therefore, normally requires modelling the relationships (based on the quantification of these relationships) between design parameters and bioprocesses in vitro. This is followed with modelling the relationships between design parameters and bioprocesses in vivo in a non-functional test. Then in vivo, healing rate and recovery rate can be based on selected bioprocess rates. This can be improved upon by selecting better animal models and/or different bioprocesses and rates. Eventually there should be at least three models that can be combined to create a fourth:
a) Design parameters to in vitro bioprocesses,
b) In vitro bioprocesses to in vivo bioprocesses,
c) In vivo bioprocesses to in vivo healing rate and recovery rate and,
d) Design parameters to in vivo healing rate and recovery rate (models ‘a’ thorugh ‘c’).
Along the way a goal is to reduce the number of critical design parameter inputs and critical bioprocess rates. Plus, it is not practical to have models for all design inputs and all bioprocesses. Checking the accuracy of each model will also show what additional relationships need to be determined to make the model more accurate. The fourth model is the one used to select designs for clinical use and as more clinical data is available it should become clinical vs animal model predictions.
For design development eventually, testing only needs to be done with model 1 and use models 2 and 3 to predict model 4. Model 3 will help determine, if the appropriate bioprocess rates were selected to get the desired clinical performance. Even if this is done, typically none of the models are complete by the time a device goes to market; e.g. the fourth model is usually improved upon post marketing. Part of the design process is to select a few critical bioprocesses in each model, which are believed to be predictive of the next model and ultimately clinical performance. If the models are not predictive enough more bioprocessing rates should be incorporated. From a design, quality assurance, and regulatory perspective the goal is to have a few tests, based on the models that predict model 4. The rest of the paper will give examples of bioprocess rates used by the author to develop tissue engineering/ regenerative medicine implants in three areas: wound healing, drug delivery, and degradable metals. The emphasis is on what are some important relationships, how they can be assessed, and how they can be used to develop models vs. constructing a complete model. Again, the overall emphasis is to show the importance of quantifying or predicting bioprocess(es) rates (with emphasis on clinical performance) in order to design implants for regenerative medicine.
To compare treatments, again the key bioprocesses are healing rate and functional recovery rate. For healing rate, there is still controversy over what it is and how to measure it [1,12-17]. For functional recovery, it is helpful to look at the tissue state compared to normal tissue. For skin wounds, such as skin ulcers or burns, functional assessments should be done in two groups: tissue health and tissue function. Although there are many quantitative measures for skin wounds, this paper will cover just healing rate and a tissue health measure: angiogenesis. Healing rate should be a clinical outcome measure and the rate of angiogenesis is the rate limiting step in most cases [1]. Healing rate is the speed in which the wound is closed and should be determined independent of wound size, in order to accurately compare treatments [1]. It also should be done at different time intervals to see if the treatment is more effective in some time frames rather than others. Further, healing should be broken down into regenerative healing vs. repair (for shallow wounds this is contraction rate vs. epithelialization rate).
Tissue health would be an assessment of the wound microenvironment in an effort to determine the ability of the wound to heal. An assessment of blood flow or vascularity, which in fact helps determine tissue oxygen level, is a measure of tissue health [1]. Tissue function would be an assessment of the skin’s ability to perform its normal functions. Assessments of mechanical properties and epidermal barrier functions can be used to determine tissue function [1].
Skin wound healing rate in a shallow wound and outward growth rate in cell culture are similar. It has been shown that the epidermal migration rate is relatively constant at approximately 1-2 mm/week [14]. So, the radial change in a shallow wound or outgrowth from a bolus of keratinocytes on a cell culture dish per unit time can be relatively constant and should be close to the epidermal migration rate [13]. The amount of new tissue (epidermis in this case) that can be laid down is proportional to the perimeter, so the change in area is not a constant, per unit time, for either a shrinking wound or a growing group of cells [13]. It gets even more complicated for deeper wounds where there should not only be epithelialization and contraction rates, but a tissue fill rate (which can also be a radial change per unit time). Others have used different measures of wound healing, but not actual healing rates. Some have used ones related to change in area like percent of the wound healed or comparing the percent healed over time curves, others have used relationships that give average radius, while others have used the radial change divided by the average radius [1,13-17].
Any measure tied to change in area will not be independent of wound size and not be the actual healing rate and at best will be “an indicator of healing” [13]. Figure 1 shows how, assuming a constant healing rate, the other measures give values that change over time [13]. Although deep wounds do have the tissue fill component, clinically the time of complete epithelialization is an important clinical endpoint (although all the function has not returned yet); so, epithelialization and contraction rates are the most critical [13]. It is still important to give a true healing rate. Measures related to average size would have to be validated to prove they relate to time to heal--a healing rate does not because it already is an outcome measure. Again Figure 2 shows how, assuming a constant TF (Figure 2c), the other measures give values that change over time [13]. Because of this confusion, currently the FDA uses time to heal as an outcome measure [13]. Wounds of different sizes, even if they heal at the same rate heal at different times making time to heal a noisy parameter. What we should shoot for is a healing rate to complete healing. This is an important factor in the delay in seeking FDA approval for treatments for wounds that heal, like pressure ulcers, in which the goal is to speed healing. This has forced companies to pursue approval for wounds that typically don’t heal unless we use the proposed intervention--such as diabetic foot ulcers [13].
Figure 1: Model Justification (2D). Mathematical model of wound healing shows that traditional measurements of healing change over time. Models assume a square shaped wound (side of L) with constant linear inward healing of 1mm / week. Traditional measurements symbolized are as follows: A) change in surface area of wound ( SA) divided by original wound area (SAo), B) change in wound surface area over time, and C) percent epithelialization (or closure) over time.

Figure 2: Model Justification (3D). Mathematical model of wound healing shows that traditional measurements of threedimensional healing change over time. Model assume a hemispherical wound (radius R) with constant linear inward healing of 1 mm / week. Traditional measurements symbolized are as follows: A) change in volume of wound ( V) divided by original volume (Vo), B) change in volume over time, and C) tissue fill over time.

Traditional models often combine all types of healing into a single measurement and don’t normally determine an actual rate. Healing of full-thickness or deeper wounds is, however, a combination of three types: epithelialization, contraction, and tissue fill [17-20]. The amount of healing via each type depends on the type of wound, depth of wound, and many other variables [20]. A better measurement would isolate these three types and determine the individual rates [13]. In particular, contraction rate, associated with scarring and thus undesirable, should be determined separately. Clinical trials that use endpoints such as total closure can often take months or years to show efficacy, especially if dealing with chronic wounds like diabetic ulcers [13]. The proper model should be able to give clinically relevant results at all points during the course of healing. Finally, the model should be able to accurately compare the healing of different wounds by being independent of size and shape [13].
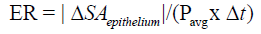
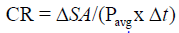
A quantitative model for calculating healing rate proposed by Gilman [21] and later by Gorin et al. [22] fits the necessary requirement of being independent of wound size and shape. The method allows for the calculation of a linear healing rate[23-24] perpendicular to the wound edge as a function of wound area and perimeter: Healing rate = ΔSA / (Pavg x Δt) , where Δ SA is the change in surface area over the time period and Pavg is the average wound perimeter between initial and final time points ( Δ t). This model provides an accurate, quantitative way to assess healing rates or closure rates at various times during the course of healing. When possible, however, it is better to separate out epithelialization rate from contraction; although this is easier in an animal model. Researchers have used this model of a linear healing rate to assess the healing of various skin wounds such as diabetic ulcers [25-26],pressure ulcers [27], and skin grafts [28]. For shallow wounds like skin grafts or partial thickness wounds, this model is adequate for calculating healing rates.
For deeper wounds such as a Stage 3 or 4 pressure ulcer, the 3-dimensional healing rate of the wound should be determined along with the 2-D measures of epithelialization and contraction rates. This 3-D healing rate, or tissue fill rate, can also be determined independent of wound volume [13,27]: Tissue Fill avg TF = ΔV /(SA x Δt) , where V is the change in volume over the time period, and SAavg is the average surface area of the wound (in 3-D) between the two time points. The equation parallels the 2-D closure rate with a change in dimension of the variables. These two calculations work together to quantitatively assess the healing of a wound independent of size, depth, or shape [13]. Using these calculations, healing rate (HR) can be separated into its three basic components: HR = ER + CR in 2 -D and HR = CR + TF in 3-D, where ER is the Epithelialization Rate, CR is the Contraction Rate, and TF is Tissue Fill [13]. Epithelialization rate is defined as the growth of new epithelium either solely from the wound periphery, as in deep wounds like third degree burns, or radially from epithelial islands present around hair follicles and sweat glands, as in partial -thickness wounds:
Contraction rate represents the change in wound size due to centripetal contraction:
Tissue fill represents the change in wound volume centripetally ‘inward’ from the 3-D volumetric surface area of the wound. The equation has been described earlier:
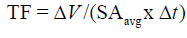
Figure 3: A meshed skin graft. To heal in the underlying blood vessels, have to grow into the graft. Each rectangle acts like a separate wound.

Combining these equations allows for comparisons of wounds of all dimensions [13]. An even more accurate measure can be obtained by adjusting ER and TF. Because significant contraction can give artificially high ER and TF values, a better value is obtained by adjusting ER and TF to the values that would have occurred with no contraction [13]. Clinically, even in deep wounds, the wound closure rate can be just ER + CR, since it is the easiest to measure [13]. If TF is not measured it is OK, if similar wounds are compared. Both the ER and CR, however, are influenced by the TF (in fact each one affects the other two). Epidermis needs a healthy well vascularized dermis to migrate over, since it does not have its own blood supply [12-13]. Although CR is different in different species, it seems to increase at lower TF [13]. For example, in meshed skin autografts (Figure 3) the faster the mesh fills in the less scarring and contraction seen [13]. In addition to the independence of size and volume considerations, meshed types of wounds (Figure 4) heal differently and one component of healing may be more important in a particular application than others [13].
Figure 4: A individual rectangle of a meshed graft works just like a single wound. For the calculation, the following formula is still used: ER = (SA0 - SA1) / [(P0 + P1) / 2] x (t1-t0).

By using these equations, the contribution of each healing mechanism can be investigated. The ability to isolate healing rate into components allows for unique analysis of different types of wounds. For example, while it may be perceived that skin grafted regions in humans heal primarily by epithelialization, in reality there is a combination of epithelialization and contraction involved in graft healing [13]. Pressure ulcers, on the other hand, heal mainly through contraction and tissue fill [13]. In each case, the individual mechanisms may be either isolated or combined for specific types of analyses. With this analytical model of healing rate, wounds of different shapes and sizes can be accurately and consistently compared to assess the effectiveness of different treatments on wound healing. In addition, the effectiveness of the treatment from week to week can also be compared.
The importance of developing measures independent of wound size are illustrated for shallow wounds in Figure 1 and full-thickness wounds in Figure 2. In both analytical models, a constant healing rate was selected (1 mm/wk). For shallow wounds Figure 1 this corresponds to a constant inward linear growth (or closure) rate. Only the measure of HR (HR = Δ SA / (Pavg x Δ t)) as described above demonstrates a measure of healing rate independent of wound size. In a clinical situation wounds of many different sizes and many different healing rates are encountered. This independence of wound size and shape is critical for accurate quantitative comparison of healing [13].
In Figure 1a & 1b, change in wound surface area (i.e., a traditional measure of healing rate) of shallow wounds of different sizes is plotted against time, assuming the constant change in radius of 1 mm/wk. In both cases three different wound sizes were selected (2-6 cm). Although they are square wounds, it works the same as if they were circles. In 1(a) the original surface area normalizes the change in surface area and in 1(b) the healing rate is the change in surface area per unit time. In 1(c) the percent epithelialization is shown. Using the actual healing rate SA / (Pavg x t), a straight line would result (1 mm/wk) and be the same line for each wound size. Figures 2a & 2b show the same phenomenon, but for deep wounds. Again, the V / V0 and V / t are not independent of wound size unlike V / (SAavg x t).
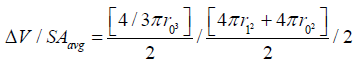
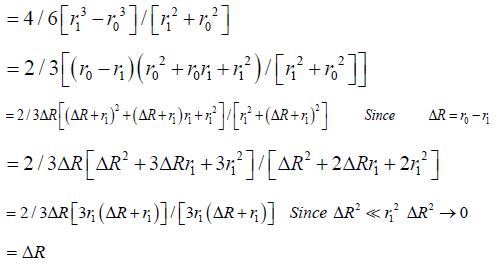
The general derivation for V / (SAavg x t) is similar to the one for 2-D [13,21] and is used in stereology equations to obtain 3-D measures from 2-D images such as microscope slides, and thus can be found in any stereology textbook. Based on stereological principles Vf = Af = Pf (volume fraction equals area fraction equals point count fraction). For a hemispherical wound, the change in radius in a 2-D histology slide would be the same as the 2-D measure A / (Pavg x t), which is equivalent to V / (SAavg x t).
Specifically, for a hemispheric wound that changes radius from r0 to r1 ( Δ R) in a given time [13]:
In deep open wounds, any epithelialization will occur at the wound edge. In shallow wounds, epithelial growth may also occur from epithelial islands within the wound [11]. In these wounds, epithelialization rate is a sum of epithelial growth from the wound edge and from the islsssands, or . edge islands ER = ER + ER Growth from the wound edge is inward, while epithelial growth from islands is outward. Meshed skin grafts would work similarly (Figure 4) [13].
In numerous studies, the ER and CR were determined in an animal model [10-11,29-31]. In many of these studies, the ratio of ER/CR was used as an indication of the amount of healing that was regenerative vs. scarring. This was very useful for comparing treatments. From a statistical perspective a paired t-test could be used in comparing the treatments to the controls at each time point. Also, week to week comparison was useful for some treatments that had a time lag like systemic injection of stem cells, which took time to get to the wound site [11,31]. Clinically, the ability to measure a true healing rate and do it week to week was critical in determining the effect of the treatment and the time frame it was most useful (Figure 5) [13]. In a clinical study, using electrical stimulation on pressure ulcers; statistically significant results were shown with just four patients [32]. In addition, the figure shows that the treatment worked best for three weeks at a time, so the clinical protocol was changed to a week of no treatment between each three-week period. Although it is not known for sure, it has been suggested that the cells exhibited a phenomenon similar to electroporation [13]. Even though it is a much lower voltage it is over a three-week period and the voltage X time is approximately equivalent.
Figure 5: The overall healing rates of the patients. Shows the healing rates in the untreated period (Pre) for each of the first three week time periods, for the 2-month treatment period, for the 2-month follow-up period (Post), and for all the untreated (Untreated) time periods.

Since oxygenation, and thus angiogenesis, are critical for wound healing, methods to assess these bioprocesses would provide insight into the wound healing process and overall tissue health. For open wounds, techniques which provide a 2-D map of the wound provide many advantages, such as determining quick spatial comparisons between areas within the wound or adjacent to it as well as ease in making correlations to histological results. Both thermography and scanning laser Doppler have been used to assess vascular perfusion and flow, giving a measure of tissue oxygenation [33-36]. Precision and ease of use should be considered in determination of the best tools to be used for clinical wound assessment. Since these techniques measure tissue oxygenation indirectly, they should be helpful in assessing tissue health, which will indicate the stage of healing.
Laser Doppler Imaging: Laser Doppler Imaging (LDI) was introduced in the late eighties in an effort to overcome the limitations of laser Doppler flowmetry (LDF) [37-50]. LDI is based on similar principles to LDF, yet, is able to measure the doppler shift, and thus blood flow, over a large area, within a short time, and without any tissue contact. This measurement is done with the use of a laser head positioned 7 to 30 cm from the tissue. The laser head emits a laser beam that is rostered over the area of interest as well as a detection device, which is able to pick up the doppler shifted light emitted from the tissue (Figure 6). A data acquisition board is used to input this data to an analysis program, which then produces a map of the wound perfusion. These characteristics allow the LDI to provide a portable, non-contact blood perfusion assessment of the spatial variability within the entire wound [41-42]. LDI has been used in numerous applications both in the clinic and for research to measure blood perfusion in tissues such as skin, brain, muscle, and liver [42-50]. The device is capable of penetrating various depths into the tissue, depending on the wavelength of the laser and tissue density [51]. For example, a He-Ne laser is capable of penetrating up to 200-300 μm into skin, which is typically down to the dermis but above the underlying muscle and away from the major vessels.
Figure 6: Pressure ulcer and corresponding LDI (Laser Doppler Image) at one month intervals.

This allows assessment of the tissue health of skin from a vascular standpoint. These devices have been used in various studies to help determine tissue health in a number of different wounds [35-36]. For accurate quantification of tissue health using LDI, it is important; however, to know the limitations of the technique as well as quantify the physical variables that affect the perfusion values [13]. The effect on perfusion level of physical variables, such as ambient light, distance from the tissue and presence of wound dressings should be known and quantified in order to develop standardized clinical assessment protocols. In addition, it has been shown that the amount of skin pigmentation has a direct effect on the perfusion values obtained [13]. Several researchers are attempting to solve this limitation by the use of lasers with differing wavelengths [52]. Another concern has been the ability to match perfusion scans with wound landmarks. This is critical in evaluating temporal changes of many types of wounds. It also appears that the most reliable measure is a change in perfusion versus the absolute value [13]. This can be the shift due to a provocation (e.g. heating up the tissue) or the level above a patient control [13].
Figure 7: LDI results for a burn patient. Mean perfusion of alternate treatment types minus the mean perfusion of the standard treatment type. LDI appears to distinguish the temporal changes of each treatment type.

Burn Patients: LDF has been used in the past for the early assessment of wound state, and potential to heal [53-54]. Perfusion of healed wounds was found to be significantly greater than those of non-healed wounds at all time points. This and other studies have shown the usefulness of laser Doppler flowmetry and imaging in the determination of wound state [55-56]. Again, the limited area evaluated and the need for tissue contact has limited the utility of this assessment. LDI was used in a clinical study [57], to evaluate the tissue health for grafted wounds over a three-month period (Figure 7). Laser doppler images were taken, with the scanning head position parallel to and 23 cm away from the wound surface. At this distance, each pixel is approximately 1 mm2. Scans of treatment sites and control sites were taken three times during the first week, post grafting, beginning with day 1. Images were then taken weekly for a period of three months. To account for patient to patient variability and measurement errors, the perfusion values used in the statistical analysis were the differences between the treatment sites and their respective internal controls.
In this study [57], fibrin glue (with and without an angiogenic agent [FGF-1]) was compared to a sutured control on the same patient. Although there was some loss in signal early on (probably due to fibrin interference), the results indicated that the perfusion remained higher in the treatments for at least the first three weeks, which is the time frame for the meshed autografts to heal. This corresponded to a faster epithelialization rate and less scarring (which was also quantified). Normally a burn patient spends a year or more in rehabilitation post burn to soften the scar tissue as close to normal as possible [13]. Increasing the blood flow, led to faster healing, reduction in scarring and contraction, and a reduction in the rehabilitation time [58].
Pressure Ulcer Patients: In another clinical study [59], the tissue health of Stage II-IV pressure ulcers was evaluated over a two-month period for outpatient Spinal Cord Injured (SCI) patients (Figure 6). Scans were taken at the time of treatment and at each monthly visit thereafter. From the scans, the averaging blood flow values, above the control, of both the healed and unhealed portions of the pressure ulcer could be determined. Three metallic markers were placed at fixed distances around the wound to give landmarks that showed up in the scan and in photographs taken. This allowed better determination of the wound regions in the scan and distances within the scan. As seen in Figure 7 this technique not only showed how good the perfusion was, but also, if there were differences in levels within the wound that should be looked at further.
Histomorphometry: The angiogenic response can be determined using stereology principles similar to those used for ER. Again, equations have been developed to obtain 3-D measures from 2-D images such as microscope slides [13]. An important assumption in stereology, however, is that the structure is relatively homogeneous [13]. Therefore, for a skin wound it is best to divide the wound into two or four parts and assess multiple regions in each region [13]. There should at least be the inside and the outside of the wound (i.e. covered by new epithelium). If the wound is deep it should be also broken down into a top and bottom layer. Stereology allows a number of different 3-D measures; but what is important for angiogenesis assessment is the ability to provide oxygen and nutrient exchange via blood vessels. As stated before, the key is providing enough oxygen for the fibroblasts to proliferate and lay down collagen [60,61]. For blood vessels, the oxygen diffuses out from the red blood cells; so, two useful measures are the volume fraction of blood vessels and the average distance between vessels [13].
It may be helpful to use special stains to pick up endothelial cells, but missing capillaries is not going to have a significant effect, since it is the comparison that is important [13]. It also can be helpful to model the oxygen concentration over the tissue based on blood vessel distribution, although diffusion through different thickness layers of blood vessels and cell membranes makes this complicated. The critical level is what actually reaches the mitochondria of the fibroblast with 0.5 mmHg a minimum [60- 61]. Normal tissue is around 50 mmHg with healing wounds above about 30 mmHg [61]. Higher levels of oxygen can enhance healing up to a point with about 150 mmHg (close to room air--20% of 760 mmHg) a near optimal level [13, 61]. In healthy tissue, cells need to be within 100 μm of a blood vessel to survive (150 μm in bone) [13,61]. Histomorphometry (stereology in tissue) is based on using a grid placed over the tissue. As stated before Vf = Af = Pf (volume fraction equals area fraction equals point count fraction); therefore, the percentage of grid points landing on a blood vessel (just the lumen) is equivalent to the area fraction, which is equivalent to the volume fraction.
Surface area is the number of intersections with grid lines divided by the total length of the grid lines (or fraction of the grid lines that pass through the endothelial lining of a blood vessel) divided by 2, since a line will intersect two sides of circle. To be more accurate (but it isn’t much more accurate), the endothelial layer of each blood vessel is circled [13]. Then the grid is whatever the pixel density is (e.g. 1080 x 480). The mean free path is 4 times the area fraction between the blood vessels divided by the surface area (fraction of grid lines crossing the endothelium) [13]. Note a number of investigators count the number of blood vessels; based on stereology, this approximates the length of blood vessels in vivo. This has been used in a number of studies to determine the angiogenic response to different materials and treatments [10,31,62-66]. In one case [11], this was measured with wounds with fibrin glue (with and without an angiogenic agent [FGF-1]) as well as with oxygen treatment.
Histomorphometry measurement of the blood supply for the various treatments showed the differences in the angiogenic response particularly how deep into the tissue (edge vs. center of the wound) it was seen. Although the clinically important parameter is healing rate, angiogenesis is an important bioprocess to help explain the differences in healing seen. In this study [11], overall the oxygen treatment elicited the best angiogenic response both at the edge and the center of the wound. With the FGF-1, the angiogenic response was also high on the outside and only with the fibrin was it high in the wound center [11]. As expected, the oxygen treatment with FGF-1 in the fibrin had the highest epithelialization rates, but also the highest contraction rates [11].
These measures of tissue health are important for developing relationships between bioprocesses and clinical outcomes. Although it is known that increased angiogenesis helps the healing process, the amount necessary to have a clinical impact is not. The model that has to be developed is the relationship of oxygen level and oxygen gradient to ER, CR, and TF. Although these measures can help quantify the relationship between angiogenesis and healing, it would also be helpful to know how these angiogenic measures relate to tissue oxygen level and oxygen gradients [13]. Ultimately you would want to select treatments th
a) Stimulate the desired angiogenic response to produce the desired oxygen gradients to speed the overall healing (to meet the clinical performance design constraint),
b) Limit the scarring and contraction relative to regenerative healing (also meeting the clinical performance design constraint).
The advantages of an implant drug delivery system over systemic medication (usually given orally) have been known for a while [67]. Things such as local delivery at a lower concentration with less side effects, more even concentration, elimination of compliance issues, reduced need for targeting, shorter exposure time, reduced deactivation, etc. There are still, however, some of the same issues for local delivery as there are for systemic delivery: e.g. what is the desired tissue concentration and how does halflife alter the amount needed per unit time. There also some new concerns, including: what is the desired release kinetics (rate and for how long) and how can this be obtained? When dealing with growth factors there is also the issue of how well it is protected from deactivation prior to release.
There are a number of bioprocess rates that have to be determined to select the best tissue concentration needed to help meet the clinical design constraints. There are also then a number of bioprocess rates that should be quantified to determine the type and amount of release of the growth factor. Again, the goal of this paper is to show some of the bioprocesses that could be quantified and why it is important to do so for design of drug delivery systems for regenerative medicine to meet clinical performance requirements.
Release Rate Determination: Release rate needed is dependent on the application, growth factor, and method of delivery. This is normally an iterative process, since the in vivo bioprocesses that alter growth factor activity are tested only after the system is optimized in vitro. Although many times the release kinetics is controlled by the drug delivery matrix properties, there are occasions when a bioprocess controls it: e.g.
a) A degradable material is used, particular a natural material that is broken down enzymatically
b) Cells are used to release the growth factor (either naturally or modified to overproduce a specific compound).
Tissue Concentration: The desired tissue concentration is also dependent on the application. Typically, the growth factor is used to alter the rate of a bioprocess (e.g. mitosis, migration, differentiation, or protein production). First both the normal rate of the bioprocess needs to be determined as well as the desired rate for the bioprocess (to meet the clinical performance requirements). In some cases, the desired rate is as fast as possible. In that case, the theoretical maximum rate should be approximated or at least a dose response curve (Figure 8) with the selected growth factor should be determined [8,65,66]. Eventually when the relationship between tissue concentration and clinical performance is known, the release rate can be selected relative to clinical performance design constraints. The goal is to determine the minimum tissue concentration needed to meet the clinical performance requirements as well as if the growth factor needs to be continually available. In some cases, a single dose is all that is required (then a drug delivery system may not be necessary) e.g. an autocatalytic process. Sometimes too high a dose will saturate the receptors and start a negative feedback loop. Sometimes a chemical gradient is needed, which delivery from an implant can do; but may be hard to simulate in vitro. Assays such as used in Figure 8 can help determine this. Part of this is determining the in vitro half-life or percent activity over time [68]. Figure 8 can be done after in vitro incubation for various times.
Figure 8: A mitotic dose response curve for FGF-1.

Activity Level: Activity level at a given point in time is needed both to determine the half-life in vitro as done above, but also to determine how well the drug delivery system protects the growth factor. This is dependent on the delivery mechanism (diffusion, degradation controlled, or delivered by cells). Many investigators just show that what is released is active. It is, however, necessary to determine if there is deactivation while in the drug delivery matrix. One way to do this is to use the dose response curve in Figure 8. A release profile can be set up, so the amount of protein released in specific intervals is known [10,68]. The first time interval should be close to the bolus amount. Then each subsequent time interval is tested separately to determine how the % activity is related to the bolus amount. This can be complicated by a system that may incorporate the growth factor by different mechanisms (e.g. diffusion or binding) with different levels of protection. The ability to prevent deactivation in storage is also important to determine, so the initial tests should be done soon after they are made. A more accurate analysis of functional activity can be done by showing the growth factor is not broken down in any way. For example, the molecular weight can be checked. Also, to check that there was no denaturation, antibody binding tests can be done [68].
The studies above help determine the tissue concentration needed at various time points, which of course is delivery method specific. Again, this will be an iterative process, since to test activity, you need to use the drug delivery method of choice. Further, it is probable that when a delivery method is tested clinically it will not produce the exact same tissue concentrations as seen in animal models and the required tissue concentration to meet the clinical performance design constraints will not be exactly the same as required to meet these constraints in the animal models. The type of release is determined by the desired tissue concentration over time and the half-life in vitro as well as within the matrix. It is possible to somewhat simulate this by adding the bolus amounts released within specific time intervals (taking into account any deactivation within the matrix). This can be to examine different amounts of incorporated growth factor as well as explore other types of release kinetics [10].
The tissue concentration over time desired can help determine which types of delivery are most promising. Sometimes diffusion controlled is fine with typically a diminishing rate over time. If a zero order release (constant release rate) is desired, it can be achieved by a thin membrane encapsulating the drug or having the release degradation controlled. Even if the matrix is surface erodible and the growth factor is bound evenly in the matrix, there is probably a decrease in surface area over time, slowing the rate. In many cases the release may work best, if it is biofeedback controlled. This can be done using cells, since their release is based on environmental cues [67]. If the matrix degrades enzymatically it can also be biofeedback control, especially if it is porous [68]. In this case, the rate that cells grow into the matrix controls the release kinetics, since cells are required to break the matrix down. Therefore, the healing rate of the individual will control the release kinetics, which is usually the best release for a regenerative system [67].
Clinical Relevance: Though there are clear advantages to a drug delivery system it requires quantification of a number of bioprocesses; some similar to oral dosing and some specific to local drug delivery. Design of a clinical system again is an iterative process, since quantification of the bioprocess relationships to design parameters typically requires selection of a specific drug delivery design. Results from the model developed will lead to modifications in the drug delivery design and then the new relationships need to be determined. A critical step, which is not always done, is to determine the in vivo deactivation rate of the growth factor not only after released, but inside the drug delivery system. Although not technically a bioprocess the deactivation rate in storage is also important [63,65]. Also, the drug delivery system is just a part of meeting the clinical performance constraints. Since adding a growth factor delivery system has a big impact on the regulatory process, it is important to justify the need for it.
This requires figuring out how far away from the clinical performance constraints the system is without the drug delivery system. Then, is the benefit of increased performance worth the longer development time (particularly regulatory approval) and increased cost of the device. It may be worthwhile to determine the biggest improvement in clinical performance possible; but eventually balance the benefit of increased performance with development time (particularly regulatory approval) and cost of the device. In addition, is there a benefit to release over time or would a single dose work as well. Further can the growth factor concentration be increased some other way (e.g. cells or external stimulus).
For fracture fixation devices, the key clinical assessment is also time to complete functional recovery (or some clinically acceptable percent of function). Optimization of clinical treatment normally means to shorten as much as possible the healing time to regain mechanical integrity (fracture healing or strength of attachment) as well as to shorten the rehabilitation time to return to pain free movement with the needed strength and flexibility [1,69]. Current clinical treatment is typically metal devices (plates, pins, screws, anchors, wire, etc.). The main problems with these devices are
a) The high complication rates (15% for internal fixation devices)
b) That the designs interfere with healing; lengthening the rehabilitation time [70-75].
Many of the complications (e.g. refracture of the bone) can be reduced by speeding healing. In clinical practice, implants are removed (80% of the time in many cases) not only if there is a complication but to speed healing and/or reduce longterm complications [71-72]. This typically requires a second rehabilitation cycle and, in many cases, leaves holes in the bone, which increases the susceptibility to refracture. For a degradable regenerative system, in this case, the design should provide the needed internal fixation (stability of attachment) while promoting healing for a specified amount of time (depending on the type of injury and the patient healing rate) and then degrade away. This would eliminate the need to remove the device; leaving a functional repair that is as close to the original structure as possible. This would require not only healing while the device is in place, but also healing to replace any voids created as it degrades. Also, if the system (bone plus device) early on (and throughout healing) can handle physiological loading then rehabilitation can be started early in the process and be completed sooner [69,76].
The key bioprocess rates are implant degradation and fracture healing. Both of these affect the clinical performance requirement of handling physiological loads early and throughout the healing period. The load handling ability is determined by the properties of the bone/device composite, which change as the implant degrades and the bone fracture heals. The healing rate is affected by the amount of load placed on the fracture, which also changes as the implant degrades and the bone fracture heals. Since there are differences in these relationships and the values for different applications, a bone plate on a long-bone fracture will be used here as a specific example [69,76].
Fracture Healing: Again, the regeneration rate of a tissue is controlled by bioprocesses that determine healing rate. These can be influenced by each part of a tissue engineered product: cells (e.g. stem cells), biomaterial (e.g. scaffold), and biological response modifiers (e.g. growth factors). For a fracture in a long bone, without any additional cells or growth factors, the higher the loading the faster it heals unless the load is too high for the fracture to withstand. Failure is actually controlled more by deformation, however. So, the higher the load on the fracture the better as long as the fracture site does not separate too much to rebreak [76]. The fracture healing rate has to be determined to design the system. This is also an iterative process, since the system design alters the healing rate. Also, the healing rate can be application specific as well as can vary depending on the patient’s health and age. From a design perspective, the stiffer a component is, the higher the percent of the load it is capable of handling.
Choosing a material that has a modulus (stiffness is directly proportional to modulus) closer to bone (clinically used metal implants have 10-20 times higher modulus than bone) [76-78] as well as degrading away both serve to increase the loading on the bone (stiffness is also directly proportional to cross-sectional area). Although healing rate is the bioprocess, the important parameter is recovery of mechanical properties. Depending on the application it will be some combination of recovery of stiffness or prevention of deformation and loading that lead to failure [75]. Figure 9 is a simple model of a bone plate on a fracture using four springs. The springs help show how deformation and loading are distributed between the plate, bone, and fracture site during axial loading. In this model of springs in parallel, the deformation is equivalent for the bone plate and the bone (which includes the fracture).
Figure 9: Spring model for a bone plate fixation of a fracture.

Since stiffness is the ratio of deformation to load, the stiffer material takes up more of the load. With springs in series (the bone and fracture) the load is constant, and the deformation is inversely related to the stiffness. Therefore, as the fracture heals it becomes stiffer; transferring more load from the plate to the bone (including the fracture). As the plate degrades it becomes less stiff (because it is thinner), which also transfers more load to the bone [76-77]. Again, the goal is to put as much load on the fracture site without exceeding the deformation for failure (which reduces as the fracture heals and becomes stiffer). So the model for a bone plate needs to include the rate of increase in stiffness and decrease in deformation as the fracture heals.
Implant Degradation: The bioprocess of implant degradation can be used in Figure 9 to determine the change in mechanical properties of the bone plate over time. Both the stiffness and the load to failure are proportional to the cross-sectional area. Although it works slightly different for different types of loading (axial, bending, and torsion) the model in Figure 9, for axial loading, can be for tension or compression. The model also assumes a rectangular cross-section and that the bone plate degrades from the surface inward (erodible). It obviously is more complex with a typical bone plate that is curved and has holes filled with screws but is still a good approximation. The degradation rate of the bone plate will then give the mechanical properties over time. Based on previous studies, materials used degraded too quickly for most orthopedic applications [76]. Even if the properties were close to the desired values initially, they degraded too quickly for most applications. Further, polymers and polymer composites tend to degrade from inside out; reducing properties faster than due to decreased crosssectional area [76].
Even degradable metals being used for orthopedic applications (Mg alloys) tend to degrade too fast; loosing stiffness too quickly and thus transferring more load to the fracture site than it can handle [78-80]. Although there are different ways to slow the degradation of a Mg alloy, the one explored here will be creating a thin surface layer that can not only decrease the degradation rate but also increase fatigue strength. In this case, the surface is thin enough that its degradation does not significantly alter the crosssectional area and therefore the mechanical properties. In addition, the degradation rate is controllable over a few orders of magnitude (Figure 10) [76-77].
Figure 10: Corrosion rate for different surface treatments.

Mechanical Properties: Although the mechanical properties of the components in the system determine whether the clinical performance design constraints are met, they are controlled by the bioprocess rates. Although the critical mechanical properties are stiffness, deformation to failure, and load to failure these are based on the material properties of modulus, strain to failure, and ultimate tensile strength. In a simple model with axial loading, the critical mechanical properties are related to the material properties by the cross-sectional area. The material properties are independent of size or shape of the device. So as the cross-sectional area increases the stiffness and load to failure increase while the deformation for a given load decreases. The critical material properties are therefore modulus and ultimate tensile strength. In this case, the Mg alloy was selected since it has a modulus closer to bone than other metallic materials used in orthopaedics with a slightly lower ultimate tensile strength [76-77]. The benefit of the surface treatment is that it increases the fatigue strength (load it can handle under repeated on and off loading) and it creates a thin surface layer that can prevent a change in mechanical properties within the time frame of bone healing 3 weeks to 6 months [76-77].
The simple model in Figure 9 will determine the load and deformation on each of the three components over time, if the properties of the fracture site is determined over time, for a given load. To use the model, the physiological load to be expected needs to be inputted. The critical outputs are the load on the bone plate and fracture site over time as well as the deformation at the fracture site over time. The design goal is to maximize the loading on the fracture site while not exceeding the deformation that would cause failure [69]. It is also important that the ultimate tensile strength of the bone plate is not exceeded at any point during healing. Design parameters can be modified to either see how close the system is to meeting the clinical performance constraints or what changes would need to be done to meet the constraints. Again, the healing rate and therefore change in mechanical properties over time is affected by the loading so this also becomes an iterative process. In this case, the material properties are fixed, but the sur face treatment and the resultant degradation rate alter the inputs into the model in Figure 9. The surface erosion rate would be dependent on the treatment (examples in Figure 10) and would be at the slower rate until the surface layer (about 100 μm) is removed. It would then degrade at the faster rate in Figure 10 (the control) [76].
Clinical Relevance: Models such as Figure 9 are developed for a specific application and the critical inputs are determined. There are many designs that could be used to meet the clinical performance requirements based on the model. It is also possible that the originally selected base alloy and available surface treatments do not meet the clinical performance requirements. The model will help determine, what changes in the system would be needed. For example, if the implant loses mechanical properties too fast either slowing the degradation or speeding up the healing might be needed. This could be selecting a different base alloy (with a slower degradation rate or use strategies previously mentioned to speed up the healing) [76,79-80]. The model will help determine the fastest degradation rate that would still allow meeting the clinical performance constraints. Although the highest loading possible, without leading to re-breaking is best for healing, it is anticipated that the initial marketable designs will be more conservative. As more experience is gained clinically, clinicians may move toward the more optimal degradation rate. It is expected that there will be a range of potential results for a given system for a particular application. This is both between patients as well as even the same patient at different times.
This is because healing rate and loading levels are different in different individuals and can even change over time for a given individual. Most likely the conservative approach for the first devices will be to design them to have the surface layer last almost to complete healing (for a slow healer) meaning mechanical properties will not change much during the healing process; then decline at a faster rate (of the base metal). In the case of a bone plate, the screw holes will still have to be filled with bone even after the fracture site heals for the bone to regain full function. It is also anticipated that initially there will only be one design per application (a conservative one), to simplify the regulatory process. Ultimately there will be a few per application and maybe even a custom design at a premium price. It might even be useful for the clinician to approximate the healing rate and loading for a given patient, which can be inputted into the model to give likely scenarios for a given implant system. As more clinical experience is gained the range of possible outcomes will narrow as well as a probability of success. For example, if the conservative approach is selected there will be a high probability of meeting the clinical performance criteria but a slower than optimal healing. As the degradation rate of the implant increases there will be a faster healing rate, but a lower probability of meeting the clinical performance criteria.
The effectiveness of a clinical treatment in tissue engineering/ regenerative medicine is judged by improvement in benefits as well as increases in costs compared to current treatment. The comparison is different for each stakeholder (e.g. patient, healthcare provider, medical device company, or insurance company) as well as the relative importance of benefits to costs. An important clinical assessment that affects most of the costs and benefits is the time to recovery (including percent of return of original function). There are a number of bioprocesses that control the time to recovery. The premise of this paper is that quantification of key bioprocess rates is critical to designing treatments, particularly in tissue engineering/ regenerative medicine. This is both how changes in treatment alters the key bioprocesses as well as the relationship between change in bioprocess rate and change in clinical outcome. Proposing a design or treatment over the current standard should require showing that these changes in bioprocess(es) rate(s) by the switch should help meet the clinical performance design requirements.
In most cases, the faster the bioprocess the better. Although the maximum rate of healing/regeneration is unknown for a given clinical application, there are at least theoretical limits on the rate of bioprocesses that can control the rate of this clinical outcome. Therefore, by modelling the relationship between bioprocess rates and healing/regeneration rates for tested conditions allows predictions of healing/regeneration rates for untested bioprocess rates (including theoretical maximums). The use of these quantitative models permits treatment design based on optimizing bioprocess rates versus just trial and error. I.e. if the clinical outcome is not as desired, the models will provide suggestions on which bioprocess rates could be changed and by how much. Since changing one bioprocess rate will change other bioprocess rates the predictive ability of the models will improve with more data points as well as including more bioprocess rates (models can, however, get too complex) and factoring in that bioprocess rates will change over time. Initially the models provide more suggestions on what might work; becoming more accurate as they are tweaked with each new data point.
Even in the early stages the models cannot only suggest what changes in bioprocess rates would be promising, but also if a desired clinical outcome is even feasible based on the theoretical maximums of key bioprocesses. Further it can show which relationships need to be modelled better to be more predictive (i.e. which addition tests or data points should help make the model more predictive). Each successive time the model is used to design a clinical treatment, the more streamlined the process should become; knowing which bioprocesses are more predictive of clinical outcome as well as how predictive the model appears to be. This will also help in the manufacturing development and the regulatory approval processes. For manufacturing, it helps in determining tolerance on the design specifications in order to meet the clinical performance requirements as well as to minimize what tests need to be done on finished product batches for quality assurance. Similarly, for FDA approval it is helpful to show that the manufacturing process can consistently meet the design tolerances and therefore assure the product will meet the claimed clinical performance.
Three examples of the importance of quantifying key bioprocesses and relating them to clinical performance design constraints were then presented. Although effort was made to select key bioprocesses and create and justify models to relate them to the clinical performance requirements, the goal was to show the process versus claim the models were all-inclusive or perfected. The important clinical performance design constraints were selected and some important pre -clinical bioprocesses that have been evaluated were selected. To get accurate relationship models, however, would require clinical testing. Again, the point is that a research paper claiming an improved design or treatment has to relate the improvement in bioprocesses to meeting the clinical performance design constraints or what would need to be done to do this and here are three examples where that was attempted. For wound healing, it is important to measure the bioprocesses that make up the actual healing rate (an important clinical outcome) as well as the relationships between design changes and clinical outcome.
Too often investigators don’t actually measure the healing rate and therefore cannot get the relationship between design parameters and clinical outcome. For drug delivery, the relationship between delivery rate and bioprocess rates (both clinical outcomes as well as those that occur at the cellular level), to determine the optimal delivery kinetics. The critical part usually left out is the bioprocess of breakdown of the drug being delivered. This is not only after it is released, but during storage (both within the drug delivery system and when stored prior to incorporation). For degradable regenerative systems the in vivo bioprocesses of material degradation and tissue healing/regeneration need to be characterized. In many cases, such as for bone plates, the two are tied together; since higher loads on the bone occur as the bone plate degrades. So design in this case is an iterative process, since changes in design will alter heal ing rate and the design essentially changes over time. It is also important to determine the change in mechanical properties of both the bone plate and fracture site, along with the expected loading pattern, to make sure neither the fracture site or bone plate fail before the bone is healed.
A research paper claiming to be designing a better clinical treatment, in tissue engineering/ regenerative medicine, needs to discuss how this proposed improvement helps meet the desired clinical performance requirements. The paper also has to show how far away we are with current clinical treatment. It is not sufficient to use the scientific method to prove that the new design gives a statistically significant difference in an important bioprocess. There are many steps to get from proving a design parameter can improve an important bioprocess to proving that the design change will help meet the desired clinical treatment performance requirement. It is likely that the research paper is looking at one of these steps; but needs to be clear about where it fits into the process of designing a better clinical treatment. It may be a feasibility study to determine, if the design change has the potential to change a key bioprocess enough that it would make a clinical difference. Proving a statistical difference is more an assessment on how sensitive the test was. A design study needs to be design driven not hypothesis driven. I.e. does the proposed design meet a preclinical performance design constraint that will likely allow the design to meet the desired clinical performance design constraint? The examples provided here put these preclinical design driven studies in the appropriate context. In so doing it shows the importance of quantifying and modelling the difference in preclinical and eventually clinical performance based on changes in bioprocess rates.
The concepts and research examples came from research and book chapters written with graduate students and collaborators (who were cited with the applicable references). Funding for this research has come from the CDC, NIH, and NSF.


