 Review Article
Abstract
An attempt has been made to understand deep brain stimulation in humans via marketable devices that are approved by the US Food and Drug Administration. The electrode characteristics were presented to influence the volume of tissue stimulated. Experimental data were digitized and VTS data were presented a function of electrode diameter, aspect ratio, applied current, pulse duration, voltage and frequency. Amongst other trends voltage and VTS were found to exhibit a three-stage relation, where Stage II characteristics were represented by a linear equation. It is in this stage, the VTS was found to be stable and where the most effective stimulation is experienced. In this study, three multi-variant mathematical models are presented which were developed to predict the VTS in terms of the above independent parameters. Because limited data was available in the literature, validation of the models with wide range of data was not possible. However, the equations provide both theoretical and experimental basis for predicting the volume of tissue stimulated in deep brain stimulation and will be very useful in future studies.
Abbreviations: GPI: Globus Pallidus; STN: Subthalamic Nucleus; DBS: Deep Brain Stimulation
Introduction
In recent years, electrical stimulation of the Thalamus, Globus
Pallidus (GPI) and Subthalamic Nucleus (STN) has shown to significantly
reduce symptoms of a variety of conditions [1]. Experimental
results suggest that tremors and uncontrolled movement disorders
are the result of abnormal firing in circuits of the brain which inhibit
the release of Dopamine [2]. The current provided by deep brain
stimulation (DBS) electrodes is capable of re-ordering the impulses
so the signals may be systematically delivered allowing for the
constant release of Dopamine and the suppression of symptoms.
Despite various clinical successes, experimental results still vary in
determining the spatial extent of neuronal stimulation as a function
of the electrode geometry.
Selecting electrodes which deliver precise yet safe electrical
stimulation to a specific target location have become the forefront
of studies due to the histological repercussions of incorrect
stimulation. The objective of this study is to review brain stimulation
devices and identify the effect of geometric parameters of the
electrodes in volume of tissue stimulated for specific electrode
designs used for the treatment of movement disorders. Since no
prediction model has been developed to predict this “stimulated
tissue” this paper compiles the published data and develops several
such mathematical, prediction models.
Devices for Stimulation
Currently, the only FDA approved DBS devices are the quadripolar Medtronic 3387/3389 electrode and IPG systems. The power source for bilateral Activa Parkinson’s Control Therapy are one dual program Kinetra Model 7428 Neurostimulator or two single program Soletra Model 7426 Neurostimulators [3]. These hardware were used in majority of the research papers compiled in this paper. The power source(s) generate electrical signals that are transmitted to the brain via two Model 7482, Model 7495 Extensions (Soletra only) and two Model 3387, 3389 DBS Leads [3]. The selection of stimulation devices is based upon the location being stimulated as well as the specific symptoms of the patient. Each 3387 lead is equipped with four cylindrical contacts each 1.5 mm long, 1.27 mm in diameter, and the 3389 leads have inter- electrode spacing of 1.5 mm [3]. Variation of electrode diameter may range by 0.1 mm due to manufacturing tolerances [4]. The Model 3389 electrode features a diameter of 1.27 mm and a spacing of only 0.5 mm between each of the four electrodes at the distal end, resulting in a 3 mm decrease in the effective stimulating area.
Electrode Parameters and Aspect Ratio
Table 1 compiles several studies of various test subject and electrode types and compares them for their relative significance in determining the maximum tissue that may be efficiently stimulated. Medtronic Model 3389 electrodes use biphasic pulses applied at -3V with the current being typical of 0.5mA at a frequency of 130 Hz (5). The typical diameter for Medtronic Model 3389 is 1.27 mm with a stimulating height of 1.5mm. The pulse duration is 50 μs for human electrical stimulation [5]. For stimulation of the subthalamic nucleus, an inhomogenity of the surrounding tissue results in inefficient stimulation, however, this complication is abrogated by the larger electrode diameters [5]. Under the same stimulation parameters, a variance of frequency between 100 and 185 Hz, produces VTS variable by capacitance and an error increased by 20% or 30 mm3 (6). Inclusion of electrode capacitance reduces the VTS in a manner dependent on the capacitance magnitude and the stimulation parameters (6). A monophasic pulse width of 90 μs with Medtronic electrodes produces a stimulation signal and a VTS which varies directly with impedance. The impedance varies from 500-1500 ohms due to variability of the surrounding tissue for an electrode diameter of 1.27mm and a contact diameter between 0.585 and 0.685mm [7]. The change in impedance between 1500 and 500 ohms results in a 52% decrease in VTS of 121 mm3 [7].
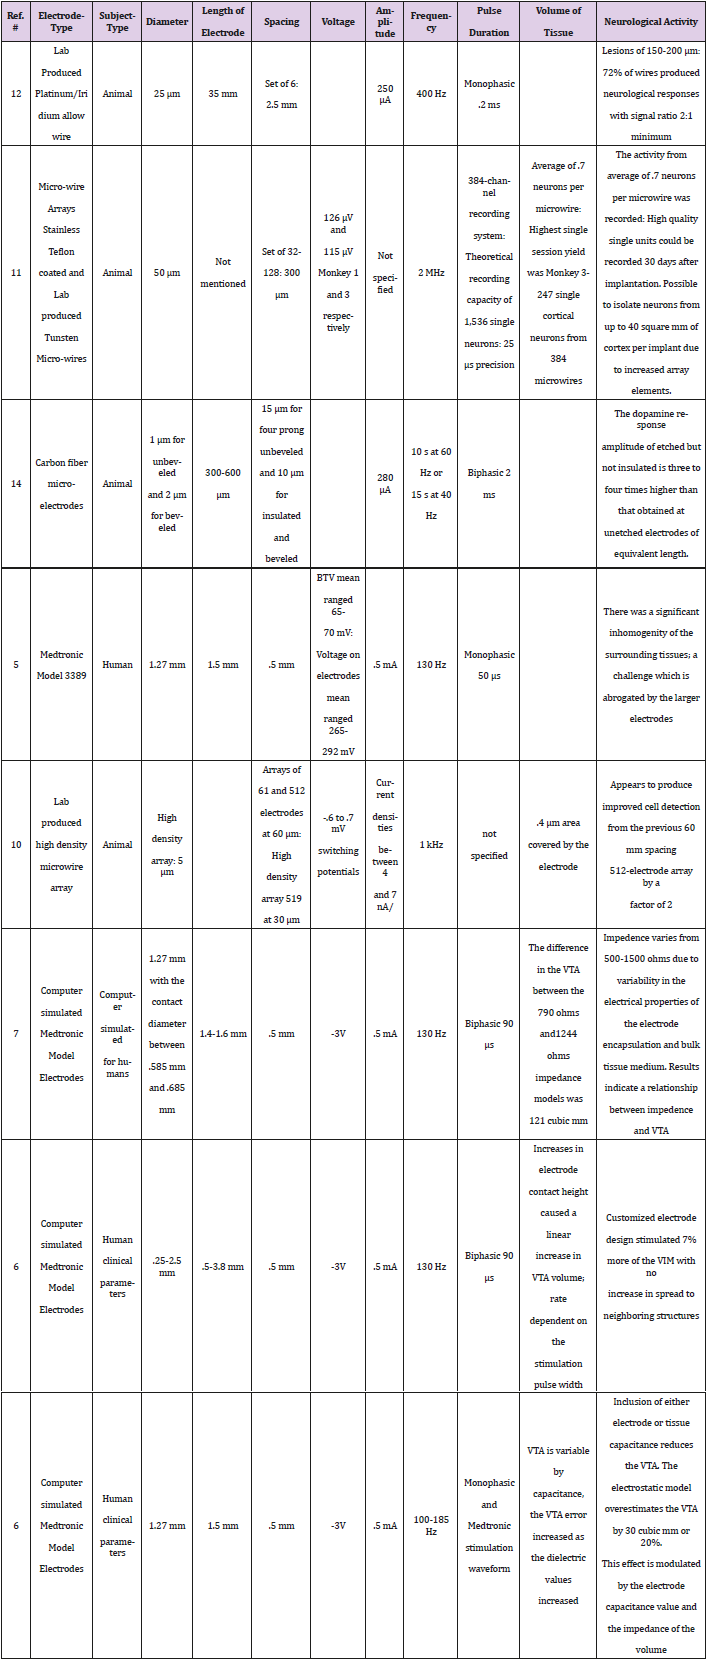
Table 1.
For Medtronic electrodes with a diameter between 0.25 and 2.5 mm, increasing the electrode height (0.5-3.8 mm tall) under previously discussed stimulation parameters results in a 7% increase in the VTS of the human ventral intermediate nucleus [8]. Additionally, a dependence on pulse width is established to increase the stimulation without allowing a spread of stimulation to neighboring cellular structures [8].
Beveled carbon fiber microelectrodes for stimulation of humans, have a diameter of 1μm while unbeveled electrodes have a diameter of 2 μm [9]. Both electrode types have heights between 300 and 600 μm where the smaller diameters have larger heights. Carbon fiber microelectrodes use biphasic pulses applied every 2 ms with current of 280μA with the frequency applied for 10s at 60 Hz and 40 Hz applied for 15 s [9]. The etched un-insulated electrode evokes Dopamine response amplitude three to four times higher than that obtained at unetched electrodes of equivalent length [9].
Lab produced, high density microwire arrays improve cell detection by a factor of 2 when the interelectrode spacing is reduced from 60 μm to 30 μm [10]. Individual electrodes cover an average area of 0.4μm2 of tissue and current densities range from 4-7 nA per μm2 [10]. The electrode arrays had between 61 and 512 electrode units, each 5 μm in diameter [10]. These particular microelectrodes used pulses applied with a switching potential between -0.6 and -0.7 mV with the frequency being 1 kHz to achieve the desired results [10].
For micro electrodes used for stimulation of rhesus monkeys, voltage of 126 μV and 115 μV was delivered with a frequency of 2 MHz [11]. This is clearly and reasonably a smaller applied voltage, however, it is proportionally equivalent to the voltage applied for full scale electrodes. The microwire arrays were stainless Teflon coated and Tungsten, with 32-128 elements spaced 300 μm apart [11]. Each electrode had a diameter of 50 μm with a theoretical recording capacity of 1,536 single neurons within 25 μs precision [11]. An average of 0.7 neurons was recorded per microwire where more efficient readings were recorded 30 days post-implantation [11].
Similarly, lab produced Platinum/Iridium alloy wires with a diameter of 25 μm, produced neurological responses with a signal ratio 2:1 minimum [12]. Microelectrode arrays of 6 elements spaced 2.5 μm apart use monophasic pulses applied at 250 μA and a frequency of 400 Hz and pulse duration of 0.2 ms [12]. Unfortunately, these electrodes produced lesions between 150 and 200 μm in diameter [12].
To apply a voltage to neurological tissue, the threshold potential of the cells being stimulated must be overcome. The graph of voltage amplitude versus the radius of activation does not clearly illustrate the effect of the threshold barrier, but the radius appears to increase constantly once threshold is reached. The applied voltage (V) affects the radius of activation (R) as given by the equation, R = -0.2042V2 + 1.5593V + 0.4783. As would be expected, the larger the applied voltage, the greater the effect of stimulation on the surrounding tissue (Figure 1).
Figures 1: Radius of Activation increases as the amplitude increases for the Medtronic Model 3387 in a constant quadratic relationship.
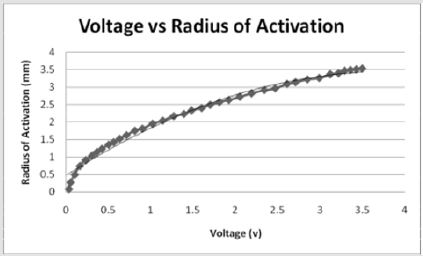
Similarly, Figure 2 illustrates the effect of threshold on the application of current and the percent of tissue activated where the percent of tissue activated is the independent variable. As a whole, the equation

effectively models the relationship between applied current and percent activation where X is the percent activation and Y is the applied voltage. If viewed as three stages, stage one represents activation values less than approximately 24 percent while stage 3 represents values above 94 percent. Both stages are statistically indeterminate for predictive purposes due to the nearly vertical slope. Stage 2 lays between stages 1 and 3 and shows a linear relationship between the percent activation and the applied voltage. As the percent activation increases, the applied voltage must also increase to account for the greater area of stimulation. It is in stage 2 where the most effective stimulation is experienced.
Figures 2: As the percent activation increases, a threshold is reached at approximately 65 volts which initiates stimulation of the tissue and requires a larger stimulus amplitude. Stage 2 shows where the most effective stimulation may be achieved as the graph shows a constant linear increase in percent activation.
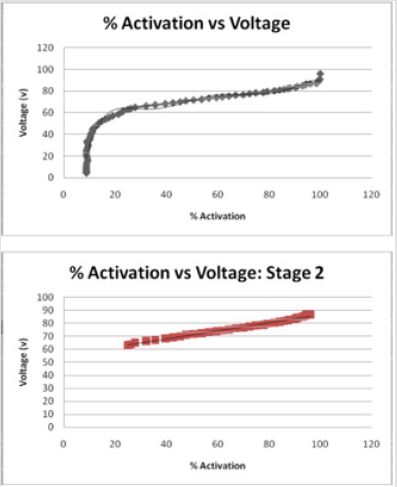
The relationship between tissue activation and electrode diameter can be visually seen using an integrated model that combined FEM electric field solutions with multi-compartment cable models of myelinated axons. Drs. Butson and McIntyre of the Cleveland Clinic found an interpolated relationship between the dimensions of the electrode contact and the resulting distribution of electric voltage around the electrode contact (Figure 3) [7]. Based upon the results in McIntyre and Butson’s study, the spread of voltage around the electrode contact is directly related to the volume of tissue stimulated and subsequently, the percentage of neurons stimulated. When a voltage is applied by an electrode, the neurons in close proximity are activated and their signals redirected. Consequently, as the voltage waves spread away from the electrode contact in an elliptical pattern, their strength and stimulating affect appear to diminish (Figure 3). The activation provides a general measure of neural activation directly from the electric field data and consequently has several computational advantages over the field-neuron modeling approach [7]. FEM allows an additional measure of visual spread of the volume of tissue stimulated during electrical stimulation and illustrates the trend more effectively than did computational analysis.
Figures 3: FEM model of a Medtronic electrode (grey) and the surrounding tissue (colored areas). This shows the spread of voltage throughout the tissue as the warmer reds indicate a strong field while the blues and greens indicate little to no stimulation. The grey dots represent specific axons which are stimulation with the application of a voltage. The spread of voltage around the electrode contact is directly related to the volume of tissue stimulated and subsequently, the percentage of neurons stimulated (7).
To account for technique errors, a quantitative comparison of the VTSs generated by a range of clinically relevant DBS electrode geometries and stimulation parameter settings [7]. Because studies have shown that DBS results in an axon excitatory effect, Butson and McIntyre investigated the characterization of the axonal activation associated with DBS. The voltage wave forms were subsequently interpolated onto cable model axons distributed around the electrode, and threshold values of the stimulation voltage necessary for action potential generation were calculated [5]. Axisymmetric FEM models of DBS electrodes with approximately 13,000 nodes were constructed in FEMLAB v3.1 and analyzed for the spread of voltage across neurological tissue (Figure 3) [5]. They studied the relationships between many electrode dimensions and found the ratio of the diameter/height to be directly related to the volume of tissue stimulated [5].
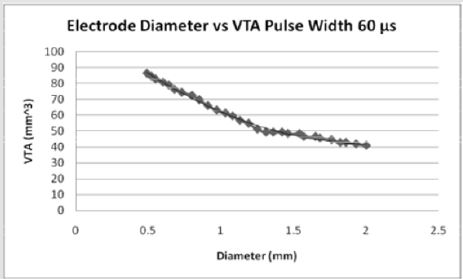
Figures 4: For pulse width of 60 microseconds, the volume of tissue stimulated by stimulation increases exponentially when stimulated with decreasing diameters of electrode contacts. As the diameter of the electrode contact increases, the volume of tissue stimulated (7).
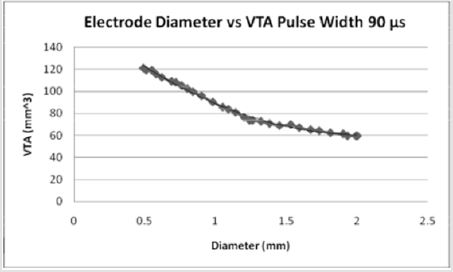
Figures 5: For a pulse width of 90 microseconds, the volume of tissue possible to stimulate increases from a PW of 60 microseconds. As the diameter of the electrode contact increases, the volume of tissue stimulated (7).
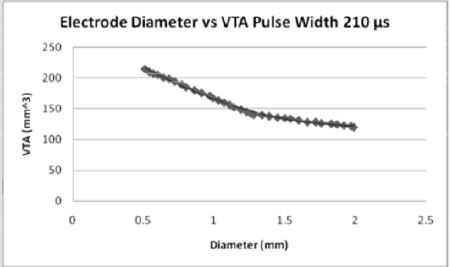
Figures 6: For the pulse width of 210 microseconds, the volume of tissue which can be stimulated increases from both the 60 and 90 pulse widths. As the diameter of the electrode contact increases, the volume of tissue stimulated (7).
The effect of pulse width on the volume of tissue affected may be seen in Figures 4-6 wherein a larger pulse width produces a higher VTS. This would be expected as the spread of voltage would be greater when considering similar electrode types and sizes. The relationship between electrode diameter and VTS for varying pulse widths is quadratic with larger Y-intercepts and primary slopes as the applied pulse width increases. For 60 μs, VTS = 18.896D2 - 76.625D + 119.79 and for 90 μs, VTS = 26.03D2 - 106.45D + 169.09 where VTS is VTS and D is the electrode diameter. Similarly, for 210 μs, VTS = 41.463D2 - 167.21D + 290.93 the trend is such that as the pulse duration increases, a larger volume of tissue is stimulated [5].
Development of Microwires
Microwires have been marveled at and investigated since 1972 when the first prototype for multiple electrode chronic single unit recording was developed and tested on animal subjects [12]. Unlike typical electrodes, microwires are not held by a guide tube. They are free floating in the target region and they shift with the brain tissue allowing for reliable recordings to be taken unobtrusively for long periods of time. Rather than inserting each microwire individually, Westby and Wang (1997) developed arrays which could be implanted into the brain of a freely moving rat and successfully record the electrical output of the superior colliculus [12]. The Platinum/Iridium alloy wire had a diameter of 25 μm and a height of 35 μm [12].
Though clinical results for the rats were successful, Nicolelis (2003) developed an electrode prototype for the purpose of stimulating the frontal and parietal areas of the brain simultaneously rather than individually [13]. Each microwire array was comprised of 16-32 50 μm S-isonel-coated tungsten micro wires [13]. The sets were then stacked around each other to form the larger arrays comprising of several hundred wires. The electrodes were arranged in the frontal and parietal areas of two female and one male rhesus macaque monkeys in arrays of 96, 320 and 704 electrodes respectively [13]. The parameters under which maximal results were achieved include a frequency of 2 Mhz, voltage between 126 μV and 115 μV and interelectrode spacing of 300μm where current was not specified [13]. No adverse effects were reported however the mean impedance of the microwire arrays was 1.5 μ ohms [13].
Early studies on single element micro electrodes indicate that stimulated Dopamine release is spatially heterogeneous over distances of about 100 μm [9]. The results of a recent study, however, suggest that spatial heterogeneity may exist over distances of about 5 μm, which is the median distance that Dopamine molecules diffuse during their transporter-limited lifetime in the extracellular space [9]. Higher spatial resolution recording of Dopamine molecules is crucial for the development of micro wires as the micro wire may stimulate specifically the molecules. This is based upon the geometric relationship of each electrode relative to surrounding electrodes. The multiple electrode elements create both stability and efficiency and improve the tensile strength of the unit during periods of stress and increased application of voltage.
The most effective method for recording the micro wire signals involves a multichannel acquisition processor (MAP) cluster which is formed by three 128-channel MAPs synchronized by a common clock signal of 2MHz and an external start pulse [13]. The 384-channel recording system has a theoretical capacity of recording up to 1,536 single neurons simultaneously, at 25-μs precision and was developed by Duke University in 2003 [13].
The first step for recording involved the setting of a voltage threshold for each of the MAP channels processing signals from the implanted micro wires [13]. The threshold must be set by the experimenter through visual inspection of both the original analog signal and the digitized record displayed on the screen of the computer controlling the MAP [13]. As the neuronal response increases, it overcomes voltage threshold for each MAP. It elicits effective stimulation and allows for active recording of a voltage threshold.
A group of similar waveforms was generated from a single neuron, shown as a cluster in 2D/3D PC space that was distinct from clusters for other units and/or multiunit activity [13]. In addition, single units had to exhibit a clearly recognizable refractory period (>1 ms) in their ISI histograms and have a characteristic and distinct waveform shape and peak-to-peak amplitude when compared with other neuronal waveforms and multi-unit activity in the same channel [13].
In more recent studies, a single cylindrical carbon fiber microelectrode with diameter of only 1 μm was formed from a carbon fiber epoxy sealed into a pulled glass micropipette [14]. A significant consideration for manufacturing such delicate stimulation devices lies in the strengthening of the electrode for insertion and general functionality. The electrode was strengthened by allylphenol insulation after which a potential of 4 volts was applied across a platinum cathode for 15 minutes [14]. The electrode must then cure for a period of 30 minutes at a temperature of 150°C to ensure the crosslink strength of the allyllphenol. Once the conductivity was confirmed and strength was maximized, the tip of the electrode is beveled to expose a tip 1 μm in diameter [14].
Released by the hypothalamus, Dopamine affects the basal ganglia motor loop which in turn affects the way the brain controls motor movement [15]. The Dopamine released by neurons in the substantia nigra excites D1 receptors and inhibits D2 receptors. Hence, both excitatory and inhibitory signals are received by the caudate, innervating different areas of the putamen [15]. The excitatory signal follows the direct pathway, where putamen cells make inhibitory connections on neurons in the internal globus pallidus, which make inhibitory connections with cells of the ventral lateral thalamic nucleus [15]. The final thalamocortical connection with the supplementary motor area (SMA) is excitatory [15]. Hence, the excitatory dopaminergic signal causes more inhibition of the globus pallidus, causing less inhibition of the VL nucleus, allowing more excitation of the SMA [15].
Conversely, the inhibitory dopaminergic signal initiates indirect pathway [15]. The putamen cells make inhibitory connections on neurons in the external globus pallidus, which make inhibitory connections with cells in the subthalamic nucleus [15]. These make excitatory connections with the internal globus pallidus. In the indirect pathway the inhibitory dopaminergic signal causes less inhibition of the external globus pallidus, allowing more inhibition of the subthalamic nucleus. Therefore, less excitiation of the internal globus pallidus and less inhibition of the VL thalamic nucleus, which results in more excitation of the SMA [15].
The carbon fiber electrode was sustained in neuro-chemical investigations as an electrical stimulant in the release of Dopamine and an effective stimulant of neurological tissue. Although studies originally determined the distance between Dopamine molecules to be 100 μm, more recent studies indicate that Dopamine molecules diffuse heterogeneously a distance of 5 μm apart [18]. Due to the relative closeness of each molecule, arrays of multiple microelectrodes provide more effective stimulation and increased resolution for recording. Once mastered, the carbon fiber microelectrode may provide greater stimulation as a larger area of molecules may be stimulated.
To determine the proper stimulation parameters, the electrode, 300-600 μm, was stimulated with a biphasic square wave with a pulse duration of 2ms and a current of 280 mA and slowly lowered until a Dopamine release was observed in the straitum during stimulation at 60 Hz [18]. With the stimulating electrode optimally positioned, the microcylinder electrode was removed and replaced with a multi-element microelectrode in an effort to increase the spatial resolution as well as the precision of the stimulation of Dopamine molecules [18]. Responses were recorded simultaneously at each sensing element during bursts of stimulation delivered for 10 s at 60 Hz for 15 s at 40 Hz with an electrode spacing of about 10 μm for insulated, beveled electrodes [14]. The microelectrodes were lowered through the striatal tissue by 100 μm between stimulation bursts which were separated by an interval of at least 20 min. [18]
When discussing the nervous system, a chronaxie is the minimum time to double the minimum electrical voltage needed to elicit an action potential for stimulation of muscles and neurons. The percent of activation of surrounding axons and cells increases as a function of chronaxies [16]. The greatest increase in chronaxie as the percent population stimulated increased was cells being stimulated with a cathodic pulse. In all other cases, the chronaxie increase was minimal relative to the percent of population stimulated. Deviation from the expected results from a drastic increase in chronaxie was viewed when 80% of the population of cells was stimulated [16]. According to a study done by Grill and Miocinovic, the chronaxies of single axons of passage and single local cells were dependent upon the electrode to neuron distance [16]. Additionally, the chronaxies to activate increasing neuronal areas were proportional to both the polarity as well as the effectiveness of stimulus. A decrease in electrode diameter and subsequently an increase in the effective area stimulated will allow for greater measurement of chronaxies and consequently a broader stimulation area.
Lesions Resulting from Electrodes
Lesions develop below and around the stimulating electrode
often as a result of internal chemical reactions or a net electrical field
at the target site. Many neurological lesions result from ineffective
stimulation which typically is caused by improper geometric fit of
the electrode. Platinum Iridium electrodes are capable of producing
high electrical fields in the pores adjacent to the electrode during
stimulation when stimulated with monophasic pulses. The
application of a second pulse of equal but opposite polarity greatly
reduces the damaging effects of electrical pulses [3]. Long periods of
stimulation result in an accumulation of charge producing cellular
lesions. The least damaging application of stimulation consisted of
monophasic pulses with a pulse width of 1000 s delivered through
Platinum electrodes at a pulse rate of 10 Hz during 205 hours of
total stimulation time (Q/phase: 2.4 C per phase; QD/phase: 30 C/
cm2 per phase) [3].
Lesions appeared to exist only at the cellular level and they
often mimicked foreign body inflammation. Studies at Imperial
College in London showed that, 5 years post implantation, a foreign
body multinucleate giant cell-type reaction was present in all
electron microscopy samples, regardless of the initial diagnosis.
Some of the giant cells were 100 μm in diameter and might have
originated from either fusion of parenchymal microglia, resident
perivascular macrophage precursors and monocytes/macrophages
invading from the blood stream [4]. The presence of mononuclear
macrophages containing lysosomes and sometimes having
conspicuous filopodia was detected by transmission electron
microscopy [14]. Both types of cell contained highly electrondense
inclusions, which probably represent phagocytosed material
[14]. Lesions appear to cause damage of the surrounding neurons
necessitating a solution for minimizing the neurological damage.
Effect of Electrode Dimensions and Stimulation Parameters on VTS
Medtronic electrode contacts are produced with a diameter of 1.27 mm and a height of 1.5 mm [3]. The Medtronic electrodes are referred to as “full scale” and have been tested extensively for the effect of various stimulation parameters on the volume of tissue stimulated. Figures 4-6 show the effect of electrode diameter for varying pulse widths on the volume of tissue stimulated. All three relationships are modeled best by a quadratic equation where a larger pulse width result in a higher VTS. As the pulse width increases, the volume of tissue stimulated increases while the same affects are seen by the decrease of diameter (Figure 7). The pulse width increases the magnitude of stimulation as well as the duration of electrical impedance. As the diameter (D) decreases, the impedance (Z) increases in a rapidly linear relationship as shown by the equation Z = -90.947D + 1558.5 (Figure 8). Consequently, as the impedance increases, so does the volume of tissue stimulated. Therefore, to increase the electrical impedance by decreasing the electrode diameter results in a greater spread of stimulation and a larger percent of activated tissue.
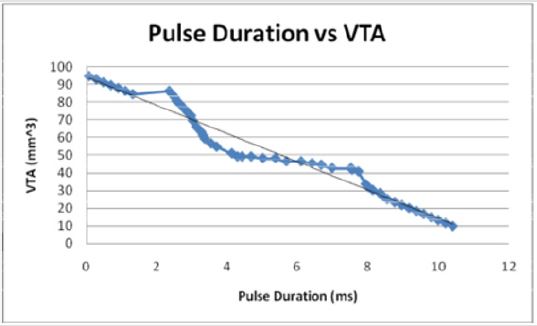
Figures 7: When modeled as the independent variable, the pulse duration decreases linearly with the VTS in an inverse relationship. The pulse duration decreases as the VTS increases.
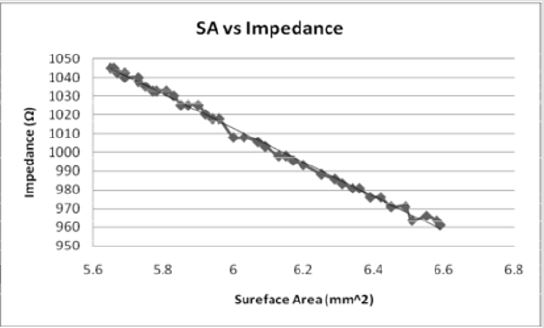
Figures 8: As the surface area of the electrode contact increases, the impedance decreases in an inverse linear relationship. The relationship indicates that as the impedance increases, the volume of tissue would also increase.
Butson and McIntyre found that low aspect ratios (diameter/
height) result in higher volumes of tissue affected providing greater
spread of the electrical impulse parallel to the tissue without
sacrificing the speed at which it does so [7]. Determination of the
special distribution of electrical voltage was achieved by use of
Poisson equation solved for the voltage within the tissue medium
using the Fourier FEM solver (Figure 3) [7]. Figure 3 illustrates the
FEM which shows the electrode (in grey) and its spread of voltage
outward. Using the FEM solver, the time-dependent stimulus
waveform was reconstructed using a complex stiffness matrix
that represent the capacitance of the electrode–tissue interface by
solving the Poisson equation at multiple frequencies [7].
Similarly, the second difference of the extracellular potential
distribution (Δ2 Ve Δx2) threshold relationships was developed. The
second difference of the extracellular potential distribution along a
neural process provides a quantitative estimate of the polarization
of the neuron in response to an applied electric field (Figure 3)
[7]. The spread of stimulation can be predicted by the volume of tissue stimulated at the specific criteria outlined by the threshold
value [7]. This method does not provide an accurate estimate
as it overestimates the volume of activation near the electrode
and underestimates the volume of activation distance from the
electrode [7]. Additionally, Butson and McIntyre found that the
threshold model failed with electrodes of diameters below that of
full-scale electrodes.
To allow for analysis of smaller dimensions and varying electrode
types, Δ2 Ve Δx2threshold values as a function of pulse width
and voltage were evaluated [7]. Specifically,Δ2 Ve Δx2 threshold values
are recorded, and these values are expressed as a function of
cathodic voltage (V) times pulse width (PW, μs) [7]. Butson and
McIntyre developed a basic relationship for determining the volume
by assuming the contours around each electrode to be ellipses.
Stimulation Efficiency of Microelectrodes
The electrochemical performance of microelectrodes varies directly based upon the stage of fabrication. When a carbon fiber element which has been conically etched but not insulated is introduced in the presence of 500 nM Dopamine, the resulting amplitude is three to four times larger than that obtained with unetched microcylinder electrodes of equivalent length [14]. Based on the significant difference in amplitude, the assumption was made that the etched surface was highly absorptive of Dopamine and subsequently more useful for the spread of stimulation. Once insulated, the etched electrode did not absorb any significant amount of Dopamine, indicating the effectiveness of the insulation in protecting the microelectrode and regulating the stimulation. Once the electrode was beveled, a response was recorded at 5 μm Dopamine exposure [14]. The temporal response was rapid and could be consistently maintained, unlike the highly absorptive surfaces found after the etching process [14]. Based upon these results, Dopamine recording as well as the most effective stimulation may be obtained using a beveled carbon fiber electrode applied with pulse duration of 2ms and a frequency of 40 Hz. Additionally, if arranged 10-15 μm apart, each carbon fiber microelectrodes in a duel-electrode array will act independently [9]. This allows for optimal stimulation and recording accuracy as two electrodes may be placed in close proximity to one another and their operations remain independent yet unified. If a single tip fails, the system may be arranged such that the stimulation remains uninterrupted without necessitating the immediate removal of the faulty mechanism.
Prediction of VTS
Many studies have shown that as the electrode tip diameter decreases, the volume of tissue stimulated increases [9,18,39,44]. The aspect ratio varies inversely with the VTS. The activity recording was an average of 0.7 neurons per microwire when stimulated with typical parameters (2mHz, 120μv), demonstrating the neuron specific stimulation capability of smaller electrode diameters [13].
Volume of tissue stimulated with the stimulation of full-scale electrodes increases. As the diameter of the contact decreases where in the relationship is the aspect ratio [7]. Micro-electrodes produce most specific stimulation while minimizing histological effects. The VTS during stimulation with Medtronic electrodes was directly affected by the applied current (Figure 9) as well as the diameter and height of the electrode. As the frequency and impedance of applied current increases, the diameter of surrounding tissue affected increases linearly. Theoretically, as the diameter decreases infinitely, the height will increase, and the aspect ratio will reach zero. As the aspect ratio decreases, the volume of tissue and neurons affected increases indicating that optimal results could be obtained when the aspect ratio nears zero. Physical limitations occur however as an infinitely small electrode would have minimal affect on the surrounding tissue due to its insignificant size relative to the surrounding neurons.
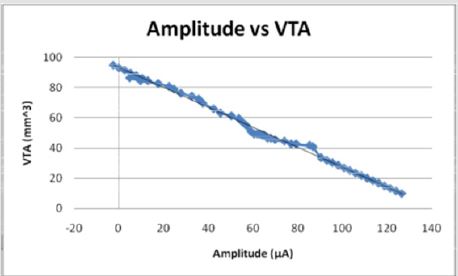
Figures 9: The current amplitude decreases as the VTS decreases in an inverse linear relationship. The current becomes negative as the volume of tissue stimulated reaches 92 mm3.
As would be expected, the volume of tissue activated by
electrical stimulation with the full-scale electrodes decreases as
the distance between the electrode tip and a particular neuron
increases. The effect of distance tends to decrease as the electrode
diameter decreases because neurons may be stimulated at greater
distances from the electrode. The use of arrays also helps to increase
the effective availability of the electrode contacts as a larger array
of micro electrodes increases the physical contact with the tissue.
Additionally, multiple areas may be stimulated simultaneously with
microwire arrays with each component functioning independently
from one another.
The therapeutic efficiency of deep brain stimulation may
be maximized should specific neurons and axons of passage be
selectively activated. Though not studied in humans, computerbased
models indicate a dependence of stimulates waveform in
selective stimulation. As with most stimulation subjects, each
neuron contained by the brain exhibits an activation threshold
value which, once overcome, may be affected by stimulation. As
the stimulation amplitude increases, complete activation maybe
achieved. Neurons are best activated with biphasic stimulation with cathode stimulus preceding anode. Carbon fiber microelectrodes
are structurally sound enough to form into single micron diameter
elements. Each complete element may be joined to form small
arrays used for stimulating single Dopamine molecules. Because
each element within the array may act independently, the special
resolution and stimulation precision is optimized.
VTS Prediction Model
Six geometrical parameters were considered to influence VTS and used to develop VTS prediction models. The data compiled in this research was used to develop several mathematical models [4,6,9,14,16,18,19]. Table 2 provides a concise summery of data used to determine mathematical models. It shows the specific ranges used for determining the mathematical relationships between VTS and each parameter. Multi-variate form of the equation involved volume of tissue stimulated as dependent variable, whereas the electrode diameter, voltage, impedance, pulse duration and current are independent variables. The functional relations among several parameters were also determined and found to be linear (Figures 7,10-13).

Table 2:
When plotted as the primary variable, the volume of tissue increases linearly with the decreasing diameter of the stimulating electrode (Figure 15). Figures 10-13 use data extrapolated from full scale electrode sizes to include smaller electrode sizes. These results may have physical limitations which have not yet been determined by theoretical means. The experimental decrease of diameter from 2 mm to near zero predicts a volume two times that of the larger electrode (40.87 mm3 to 94.77 mm3). Though non-traditional, if viewed from the positively extrapolated data, a diameter of 2.79 mm would predict in a ten times deficit in volume.
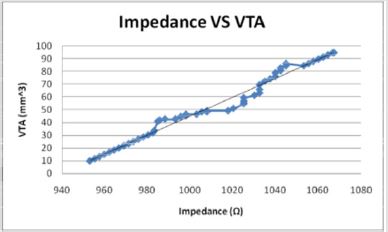
Figures 10: The volume of tissue stimulated increases linearly with the impedance in a direct relationship.
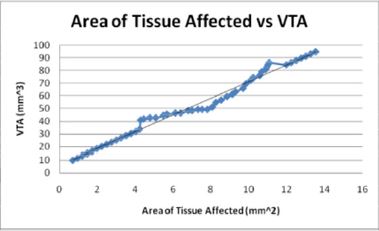
Figures 11: The volume of tissue stimulated increases with the area of tissue affected as would be expected in a direct linear relationship.
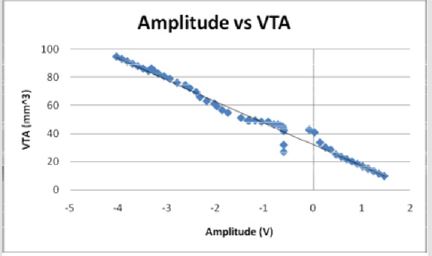
Figures 12: The voltage amplitude decreases as the VTS decreases in an inverse linear relationship. The voltage becomes negative as the electrode diameter reaches 2 mm and as the volume of tissue stimulated reaches 40 mm3.
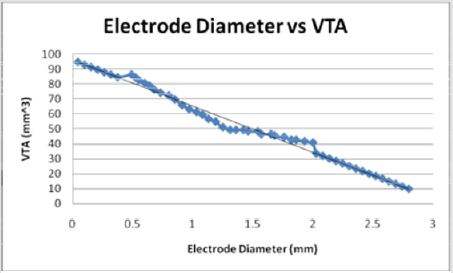
Figures 13: As the electrode diameter decreases, the VTS increases linearly. This indicates an inverse relationship between electrode diameter and the volume of tissue stimulated.
Similarly, as would be expected, the area of tissue affected and the radius of activation both directly relate to the volume of tissue stimulated. Both increase linearly with the VTS and the small electrode diameters affect large areas of tissue and volumes of tissue. The radius of activation is modeled the linear equation, R = 4.3726 -1.4845D where D is the electrode diameter and R is the radius of activation. The negative slope indicates that as the diameter increases, the radius of activation and subsequently the area of activation decrease.
The calculated area of activation (A) as a function of volume of tissue stimulated is modeled linearly by the equation, VTS =6.5825 A + 5.4765 where VTS is the VTS. The graph of this equation Figure 12 shows a direct relationship between the volume of tissue stimulated and the calculated area of tissue affected as the positive slope indicates a positive correlation.
The current and voltage necessary to achieve large volumes of activation is small relative to that used for full scale electrodes due to the increased efficiency with smaller diameters. Current (I) and voltage (V) decrease linearly as a function of volume of tissue stimulated (VTS). Figures 9 & 12 demonstrate the relationship of the three parameters by the equations VTS=93.113 - 0.6581I and VTS = 32.433 - 15.305V respectively. The negative slopes indicate a decrease of amplitudes increases the volume of tissue stimulated. If modeled as a function of electrode diameter, the current and the voltage both increase as the diameter increases due to the necessity for a larger applied current and voltage to incur a stimulation reaction.
Additionally, when modeled as the dependent variable of
electrode diameter (D), the pulse duration (P) increases linearly, P
= 3.7594D - 0.0929. As the electrode diameter increases, the pulse
duration increases introducing a stable and direct relationship.
As would be expected, the general trend VTS = 94.333 - 8.0165P
shows that as the volume of tissue stimulated increases, the pulse
duration decreases.
The volume of tissue (VTS) stimulated was also correlated with
the impedance (Z). Once extrapolated to the smaller values for
electrode diameter, the impedance increases linearly as a function
of VTS by the equation, Z = 1.3209 VTA + 941.02 (Figure 10) while
when modeled as the dependent variable, the impedance has a direct
linear relationship with the VTS, VTS = 0.7373Z - 692.43 (Figure
14). Inversely, as the electrode diameter (D) decreases in the relationship,
Z = 1068.9 -41.421D, the impedance decreases. Small electrode
diameters result in large impedance due to the linear spread
of the current and a change in the amplitude applied [17].
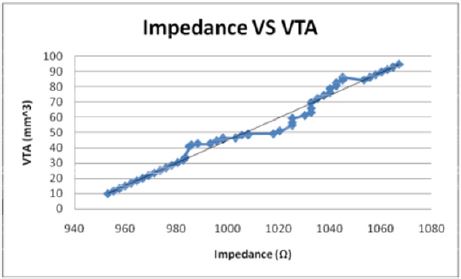
Figures 14: The when modelled as the independent variable, the Impedance shows a direct linear relationship with the VTS. As the impedance increases, the volume of tissue stimulated increases.
A multivariate prediction model was derived using the EXCEL©, MATLAB© 7.0 and JMP© 8.0 software. To find the mathematical dependence of each parameter relative to the others, simple and factorial linear regression was used to model the volume of tissue stimulated as a function of D=electrode diameter, Z=Impedance, I=Current, P=Pulse Duration, V=Voltage and A=Area of Tissue affected, as shown by Equation (1).

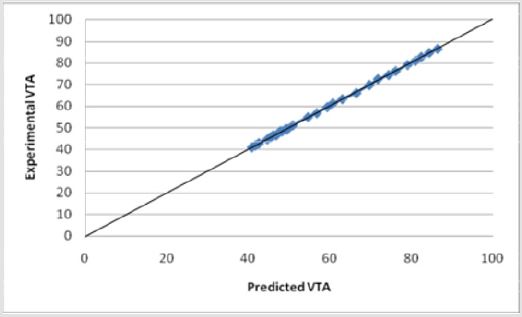
Equation (1) shows a strong relationship between the y-intercept (βo) and the VTS. βo shows strong precedence relative to other parameter coefficients (β). For initial modeling purposes, only single parameters were considered, however, a strong correlation was found between the experimental predicted values and the data (Figure 15). Several relationships were examined based upon the coefficients of the parameter variables (β). As was expected, the electrode diameter has the greatest affect on the VTS as the absolute value of β value associated with diameter is much greater than all the other β values (|β|=46.89). Additionally, it appears as though pulse duration was a secondary factor in the VTS (|β|=6.0546) while the others share smaller β values indicating a lesser importance. Here, a slight dependence on voltage is observed (|β|=0.8339), however it is more strongly modeled in later equations. The dependence of VTS on pulse duration and electrode diameter is direct as both decreases linearly with the VTS. The parameters that varied inversely with the VTS showed the lowest β values possibly due to their indirect relationship.
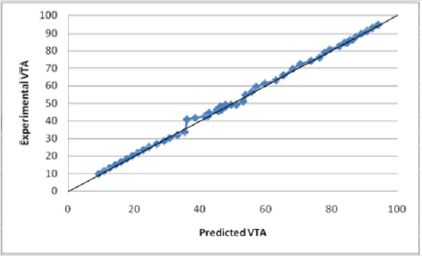
Figures 15: The R squared value is close to 1 for Equation (1). This indicates a strong model for predicting the VTS for diameters less than 2.79 mm. This model predicts the theoretical potential for a decrease in diameter and its resulting affect
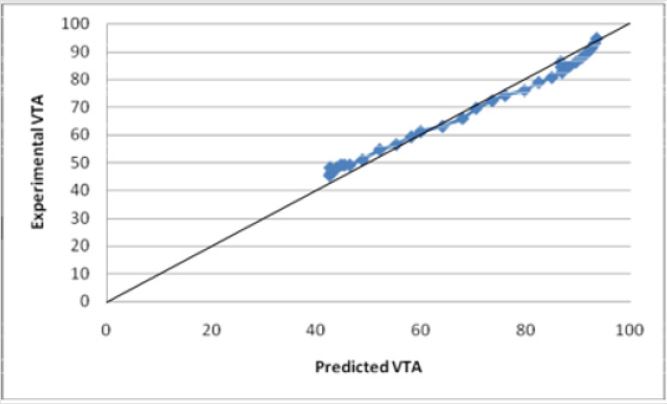
A new experimental VTS prediction equation was developed using only the data which models the influence of various electrode parameters. The model was found using linear regression with a |R2=0.999696| (Figure 16) Equation (2).

Equation (2) shows a similar dependence where previously defined variables remain.
Experimental data was incorporated into Equations (1) and (2) and tested for their validity. Both models accurately predict the VTS as the calculated values were within an acceptable range of the experimental data values. The calculated values obtained from the equation were between 0.9-1.1 times the experimental data values with R2 values close to 1. The graph of Equation (1) vs. the VTS values shows a well fit linear relationship with an R squared value of 0.9979 (Figure 14). Similarly, the graph of Equation (2) vs. the VTS values shows a well fit linear relationship with an R squared value of 0.9997 (Figure 16). Equation (2) is for electrode diameters which do not reach 0, indicating a less useful relationship for predicting the volume of tissue stimulated as lower electrode diameters are the focus of this study.
Figures 16: The R squared value is close to 1 for Equation (2). This indicates a strong model for predicting the VTS for diameters less than 2 and greater than .5mm. This indicates a strong model for predicting the VTS for diameters less than 2 mm. This model predicts the theoretical potential for a decrease in diameter and its resulting affect.
A more aggressive multivariate equation to predict the VTS was developed using the extrapolated data. It provides a good prediction of the VTS for small diameters. It was tested for its validity using built-in statistical analysis (R2=0.999013) and the model was determined to have valid results for electrode diameters below 2.5213 mm. The model begins to fail above this diameter. Equation (3)

Where the variables are as defined previously. The graph of Equation (3) vs. the experimental values of VTS shows an R2 value of 0.9915 (Figure 17). Equation (3) predicts the theoretical VTS for diameters reaching the micrometer level and allows for the predictive nature of the VTS.
Figures 17: The R squared value is close to 1 for Equation (3). This indicates a strong model for predicting the VTS for diameters less than 2 mm. This model predicts the theoretical potential for a decrease in diameter and its resulting affect. Electrode diameters above 2 mm show an inconsistent prediction using Equation (3).
According to the variable coefficients, the electrode diameter, pulse duration, area of tissue affected and voltage were the most significant variables for predicting VTS, however the significance of various multivariate combinations was easily examined using Equations (2) and (3). The multiplied values of the electrode diameter, voltage and pulse duration appear to have the greatest affect on the VTS. Any combination of the three appears to have an equal effect on the VTS.
Conclusion
Several conclusions were derived from this study. Seven parameters, diameter, aspect ratio, current, pulse duration, voltage, area of tissue affected and impedance, were investigated for their relationships to the VTS. When modeled as the independent variable, the impedance and area of tissue affected increase in a direct linear relationship to the VTS while the voltage, current, electrode diameter and pulse duration show an inverse linear relationship with VTS. This study presents three mathematical models which accurately predict the VTS for electrode diameters reaching the micrometer level. The multivariate models presented in this study demonstrate the strong correlation between the VTS with the electrode diameter, pulse duration and applied voltage. The predicted values for the three equations were within the normal average distribution line ranging from 95-110%. The accuracy with which the VTS was predicted using the new mathematical equations will enable the researchers to generate preliminary data without performing actual experiments. Therefore, this study will be useful in gaining insights before performing clinical testing and in the design of the experiments.
Acknowledgement
The authors would like to acknowledge Dr. Cameron McIntyre PhD. Associate Staff, Cleveland Clinic Department of Biomedical Engineering and Dr. Christopher Butson PhD. Assistant Professor of Neurology & Neurosurgery, University of Wisconsin for some of the data that they provided for this study. Additionally, we acknowledge with gratitude the technical assistance of Nicholas Baine.
References
- Bjarkam CR, Jorgensen RL, Jensen KN, Sunde NA, Sørensen JC (2008) Deep brain stimulation electrode anchoring using BioGlue, a protective electrode covering, and a titanium microplate. Journal of Neuroscience Methods 168(1): 151-155.
- Kuyck Kv, Welkenhuysen M, Arckens L, Sciot Raf, Nuttin Bart (2007) Histological alterations induced by electrode implantation and electrical stimulation in the human brain: a review. Neuromodulation 10(3): 244-261.
- Alterman RL, Shils JL, Gudesblatt M, Tagliati M (2004) Immediate and sustained relief of levodopa induced dyskinesias after dorsal relocation of a deep brain stimulation lead: Case report. Neurosurgical Focus 17(1).
- Butson CR, McIntyre CC (2005) Role of electrode design on the volume of tissue activated during deep brain stimulation. Journal of Neural Engineering 3(1): 1-8.
- Back C, Alesch F, Lanmuller H (2003) Postoperative monitoring of the electrical properties of tissue and electrodes in deep brain stimulation. International Neuromodulation Society 6(4): 248-253.
- Butson CR, McIntyre CC (2008) Current steering to control volume of tissue affected during deep brain stimulation. Brain Stimulation 1(1): 7-15.
- Butson CR, McIntyre CC (2005) Tissue and electrode capacitance reduce neural activation volumes during deep brain stimulation. Clinical Neurophysiology 116(10): 2490-2500.
- Kimball J (2009) The human central nervous system. Retrieved July 12, 2008.
- Dujardin K, Krystkowiak P, Defebvre L, Blond S, Destée A (2000) A case of severe dysexecutive syndrome consecutive to chronic bilateral pallidal stimulation. Neuropsychologia 38(9): 1305-1315.
- Hauptmann C, Tass PA (2007) Therapeutic rewiring by means of desynchronizing brain stimulation. BioSystems 89(1-3): 173-181.
- Uc EY, Follett Kenneth A (2007) Deep brain stimulation in movement disorders. Seminars in Neurology 27(2): 170-182.
- Westby GW, Wang H (1997) A floating microwire technique for multichannel chronic neural recording and stimulation in the awake freely moving rat. Journal of Neuroscience Methods 76(2): 123-133.
- Nicolelis MA, Dimitrov D, Carmena JM, Crist R, Lehew G, et al. (2003) Chronic, multi-site, multi-electrode recordings in masque monkeys. Proceedings of the National Academy of Sciences of the United States 100(19): 11041-11046.
- Dressman SF, Peters JL, Michael AC (2002) Carbon fiber micro electrodes with multiple sensing elements for in vivo voltammetry. Journal of Neuroscience Methods 119(1): 75-81.
- Bear MF, Connors BW, Paradiso MA (2001) Neuroscience: Exploring the brain (2): 473-482.
- Miocinovic S, Grill WM (2004) Sensitivity of temporal excitation properties to the neuronal element activated by extracellular stimulation. Journal of Neuroscience Methods 132(1): 91-99.
- Butson CR, Maks CB, McIntyre CC (2006) Sources and effects of electrode impedance during deep brain stimulation. Clinical Neurophysiology 117(2): 447-454.
- Grill WM, McIntyre CC (2001) Extracellular excitation of central neurons: Implications for the mechanisms of deep brain stimulation. Thalamus & Related Systems 1(3): 269-277.
- Gunning DE, Chichilnisky EJ, Litke AM, O'Shea V, Smith KM, et al. (2007) Performance of ultra high density microelectrode arrays. Nuclear Instruments & Methods in Physics Research 576(1): 215-219.
