 Research Article
Abstract
The report presented here was prepared using the data of 900 adults investigated from both urban and rural areas of Bangladesh. The adults were classified into two groups according to their BMI. Those who had BMI ≥ 25 were identified as overweight and obese group. The objective of the study was to detect the responsible factors for this character prevailed among adults who did not do any labor-intensive work . Except gender no other factor was responsible for overweight and obesity among the adults not doing any physical labor.
Keywords: Overweight and Obesity; Non-Communicable Diseases; Physical Inactivity; Discriminant Analysis
Introduction
Overweight and obesity are defined as abnormal or excessive
fat accumulation that may impair health. The common health
consequences of overweight and obesity are
a. Cardiovascular diseases, which were the leading cause of
death in 2012 [1],
b. Diabetes,
c. Musculoskeletal disorders and
d. Some cancers,
e. Sleep problems,
f. Liver disease,
g. Early puberty,
h. Eating disorders,
i. Skin infection,
j. Asthma, and
k. Other respiratory problems [2].
The risk for these non-communicable diseases (NCDs)
increases with the increase in body mass index (BMI). In 2012
68% of all deaths were due to NCDs [1] and it was increased by
8 % compared to the deaths of 2000 [3]. About half of the deaths
occur under age 70 years [1] and over 85% of these deaths occur in
low-and middle-income countries [3,4]. One of the causes of NCDs
is obesity. The prevalence of overweight and obesity has increased
rapidly over the last decades especially in developed countries [1,5-
7]. Worldwide obesity has nearly tripled since 1975 and it is a major
contributor leading to an increase in the prevalence of chronic
diseases and cancers [8-13]. In 2016 [1] WHO estimated that more
than 1.9 billion adults, 18 years and older, were overweight, where
overweight was considered for a person if his/her BMI ≥ 25. Among
these 1.9 billion, over 650 million were obese, where obesity was
considered for a person if his/her BMI ≥ 30. In percentage 39
percent were overweight and 13 percent were obese. Most of the
world’s population live in countries where overweight or obesity
compared to underweight kills more people. Overweight and
obesity are the major cause of non-communicable diseases and
these diseases are the major health burden in the industrialized
countries owing to demographic transitions and changing lifestyles
among the people.
The most common medical morbidities associated with obesity
include impaired glucose tolerance and metabolic syndrome [13,14]. Behavioral factors have significant effects on metabolic
risk. The developing countries are facing high risk of obesity and its
adverse consequences due to unhygienic food habit [ processed food
from restaurant, energy-dense food, high-calorie food], sedentary
activities [killing time by watching television or concentrating mind
to handle smart mobile phone] and lifestyles [no physical labor, no
physical exercise, non-involvement in out-door games, lack of health
services or avoid the available health services due to negligence]
[15]. The effect of diabetes mellitus includes long term damage,
dysfunction and failure of various organs. It is also associated with
health hazard such as gangrene, blindness, kidney failure [9,12,16]
and with some others NCDs. According to different studies during
1995 – 2013 [17-22], it was noted that Asia and Eastern Pacific
regions are particularly affected due to these diseases. Bangladesh
belongs to these regions. In India more than 135 million individuals
were affected by obesity. The prevalence of obesity varies due to
age, gender, geographical environment, socioeconomic status, etc.
According to ICMR- INDIAB study 2015, prevalence rate of
obesity varies from 11.8 % to 31.3% [15]. In Pakistan overweight
and obesity were increased with age. Overweight and obese
women were more likely to work in business or as skilled workers
[23]. Nearly seven in 10 truck drivers were obese and 17% were
morbidly obese. Among all working American adults, one-third are
obese and 7% are morbidly obese [24]. From the above discussion,
it is clear that businessmen, skilled workers and government
employees are at high risk of overweight and obesity as these
groups of people have less chance to be involved in physical
labor and they have less scope to do physical exercise. In addition
to these three groups, housewives have also less chance to do
physical labor. In this paper, attempt was made to study the effect of
business, government service and household works on overweight
and obesity and identify the factors responsible to discriminate
businessmen, government employees and housewives from other
groups of respondents.
Methodology
The study was done using the data collected from both urban
and rural people of Bangladesh. According to the objective of the
study attempt was made to collect the data from both diabetic
and non- diabetic people as there were association between
overweight and obesity and prevalence of diabetes [3,16,17]. The
investigated diabetic patients were 544. To study the variability
of socioeconomic variables for diabetic and non-diabetic subjects,
some respondents were also investigated as a control group. The
number of this latter group of respondents was 346 and they were
the parents / guardians of the 200 randomly selected students of
the university . However, among this latter group of respondents
also there were 91 diabetic patients. Thus, finally, the analysis was
performed using the data of 635 diabetic patients and 265 normal
subjects. The data were collected through a pre-designed and pretested
questionnaire during the months of May and June, 2015
by some undergraduate and post graduate students of American
International University-Bangladesh, most of whom were doctors
and nurses, of the department of Public Health and they were
associated with public health services. The data were collected
from the diabetic patients of the working places of the investigators
according to their convenience.
The collected data were related to socio-demographic
characteristics of each person, viz. age, height weight, marital status,
residence, education, occupation, income, religion, food habit,
smoking habit, involvement in physical activities , physical exercise,
prevalence of diabetes, treatment and prevalence of complications
due to diabetes, type of diabetes, pre-cautions against the disease,
prevalence of hypertension, latest measurement of blood sugar
level by authentic body. The latter information was provided
by the diabetic patients. Some of the variables observed were
qualitative in character and some were quantitative. All variables
were transformed to nominal form by assigning numbers to ease
the required analysis. Discriminant analysis was performed to
discriminate the businessmen, servicepersons and housewives
from other groups of respondents the variables included for
discriminant analysis were residence of the respondents, their age,
gender, marital status, religion, level of education, occupation, and
smoking habit. The analysis was done by using SPSS [ version 20.0].
The level of obesity was measured by BMI [weight in kg /height
in(m)2]. According to the objective of the study, the respondents
were classified as overweight and obese (BMI ≥ 25 [1]) and others
[ BMI < 25]. Besides the discriminant analysis, the association
of different socioeconomic variables with level of obesity were
investigated. Significant association was decided by chi-square test
with p-value< 0.05.
Results
It was observed from the analysis that out of 900 respondent’s 49.3 percent were overweight and obese (Table 1) and 16.4 percent of them were from rural areas. The overall rural people were 18.6 percent. The prevalence of overweight and obesity was less among rural people though this character was not associated with residential origin of the respondents [P (χ2 ≥ 2.59) = 0.11] . The odd ratio [O.R.= 0.76] indicated that the rural people were less exposed to obesity and overweight. The relative risk [R.R. = 0.86] also indicated that the rural people were in less risk of overweight and obesity. The levels of obesity were significantly different among males and females [P (χ2 ≥ 9.26) = 0.001]. There were 58.9 percent males among them 45.1 percent were overweight and obese. The corresponding figure among females were 55.4. The odd ratio [O.R.=0.66] indicated that the females were more exposed to overweight and obesity. The relative risk of prevalence of overweight and obesity [R.R.= 1.23] of female compared to male was higher. The coefficient of contingency was 0.01.
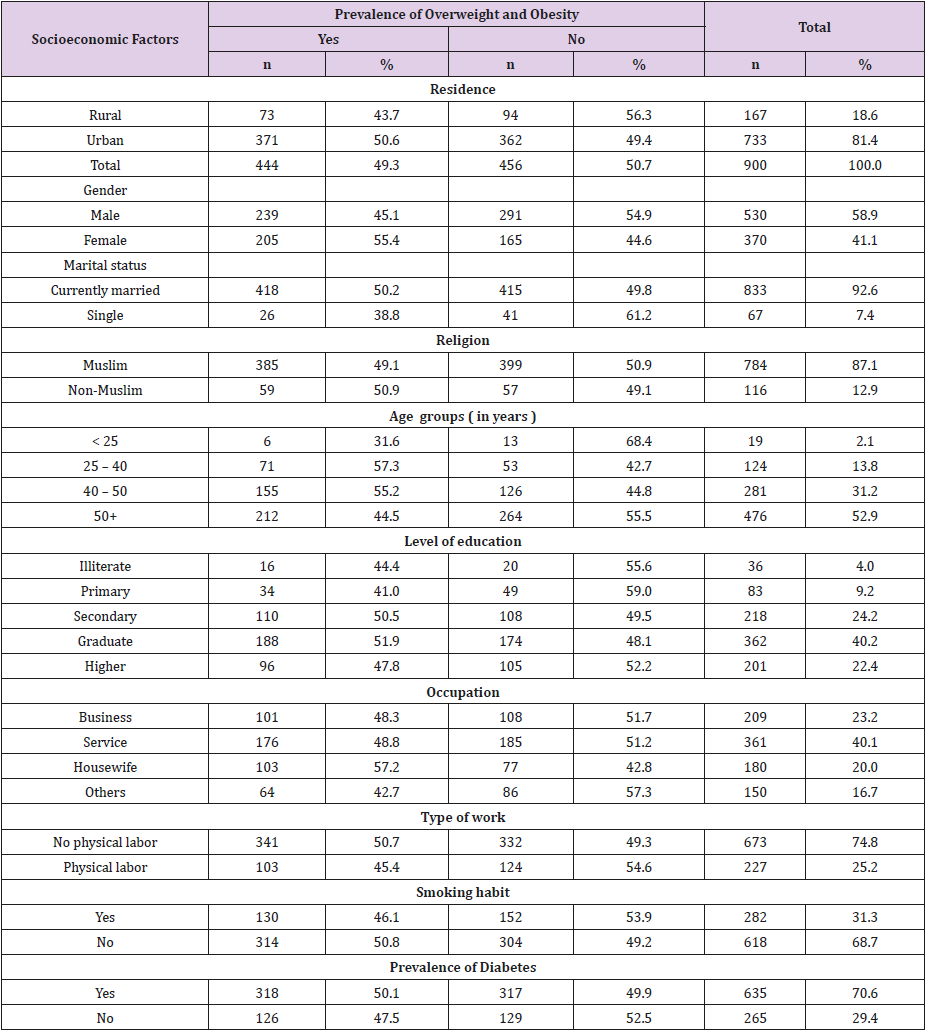
Table 1: Distribution of respondents by prevalence of overweight and obesity and some socioeconomic factors.
Among the respondent’s 92.6 percent were married and 50.2 percent of them were overweight and obese. The corresponding figure among the single respondents during investigation was 38.8. This differentials in prevalence of overweight and obesity among married and single respondents were not significant p(7χ2 ≥ 3.21) = 0.07 . However, the odd ratio [O.R.= 1.59] indicated that the married subjects were around 60 percent more exposed to prevalence of overweight and obesity compared to single subjects. Their relative risk of becoming obese and overweight was 29 percent more than that of single subjects [R.R. = 1.29]. Most of the investigated units (87.1%) were Muslim and 49.1 percent of them were overweight and obese. The corresponding figure for non-Muslims was 50.9. These figures indicated that prevalence of overweight and obesity were similar for both the religious groups [p-value = 0. 936]. The odd ratio [O.R.= 0.93] indicated that both the religious groups were similarly exposed to overweight and obesity and their relative risk [R.R = 0.97] was not different. It was noted that 45.0 percent adults were in the age group 25 – 50 years and 55.8 percent of them were overweight and obese. The corresponding percentage among adults of other age groups was 44.0.
These results indicated that prevalence of overweight and obesity was not associated with the variation in the age groups [. p- value > 0.05]. However, the adults of age groups 25 – 50 years were 60 percent more exposed to overweight and obesity compared to the adults of other ages [O.R. = 1.60] and their relative risk was 68 percent more [R.R = 1.68]. The investigated adults were mostly graduate and higher educated (62.6%) and 50.4 percent of them were overweight and obese. The corresponding figure among respondents up to secondary level education was 47.5. It indicated that prevalence of overweight and obesity was higher among higher educated adults though the differentials in prevalence rate according to different levels of education were not statistically significant χ2 = 3.8,ρ − value > 0.05 . However, graduate and higher educated adults were almost similarly exposed compared to adults educated up to secondary level [O.R. = 1.13]. The relative risk was also not higher for the graduate and higher educated adults [R.R. = 1.06].
According to the objective of the study the investigated adults
were classified into 4 classes, viz.
1. Businessmen,
2. Service holders,
3. Housewives , and
4. Others by their profession.
The percentages of these adults were 23.2, 40.1, 20.0 and 16.7, respectively. The rate of prevalence of overweight and obesity among the first two professional groups was 0.495. This rate among the last group of adults was 0.427. In that sense, higher rate of overweight and obesity was noted among those adults who had less scope to be involved physical activities. But these differences in proportions of overweight and obesity among the different adults were not statistically significant [χ2 = 7.23 , p-value > 0.05 ]. However, businessmen, servicepersons and housewives together were 38 percent more exposed to become overweight and obese compared to other group of adults O.R.= 1.38]. Their relative risk was also more by 19 percent [ R.R.= 1.19].
Among the investigated adult’s 74.8 percent did not do any physical work. The prevalence rate of overweight and obesity among these adults was 0.507. The corresponding figure among the adults who were involved in physical labor was 0.454. But this difference in proportions was not statistically significant as χ2 =1.90 with p-value > 0.10. However, those who did not do any physical labor were more exposed by 23 percent to overweight and obesity [O.R.= 1.23]. Their relative risk was also higher by 12 percent [R.R. = 1.12]. Most of the adults were non-smokers (68.7%). But 50.8 percent of them were overweight and obese. The corresponding figure among smokers was 46.1. This difference in proportions among overweight and obese adults according to smoking habit was not significant as χ2 = 0.03 , p-value > 0.10. The odd ratio [O.R.= 0.83] and relative risk [R.R = 0.91] indicated that the smokers and non-smokers had similar risk of overweight and obesity. A big group ( 70.6%) of investigated adults were diabetic patients. Among them the prevalence rate of overweight and obesity was 50.1 percent. The corresponding figure among non-diabetic subjects was 47.5. This difference in proportions of prevalence of overweight and obesity among diabetic patients and normal subjects was not significant as = 0.03 with p –value > 0.05. The odd ratio [O.R.= 1.11] and relative risk [R.R.=1.05] also indicated that both diabetic patients and normal subjects were almost at similar risk of overweight and obesity.
Discriminant Analysis
According to the objective of the study it was decided to discriminate the investigated adults according to their profession which is free of physical labor. But during analysis, it was noted that except the variable gender no other variable was associated with prevalence of overweight and obesity. Thus, planned discriminant analysis was not done, rather the analysis was performed to discriminate adults according to their type of work. The type of work was two, viz. (i) work with physical labor, and (ii) work without physical labor. The variables included for discriminant analysis were residence, age, gender, marital status, religion, education, smoking habit and prevalence of diabetes. As there were two groups of adults, one discriminant function was derived. This function was significant as Wilk’s = 0.77, and the corresponding χ2 = 265.32 , p-value = 0.000. It indicated that the two groups of adults were significantly different, and the difference was noted in respect of gender of the adults. The coefficients of the discriminant function and the correlation coefficients of the variables with discriminant function score were shown in (Table 2).
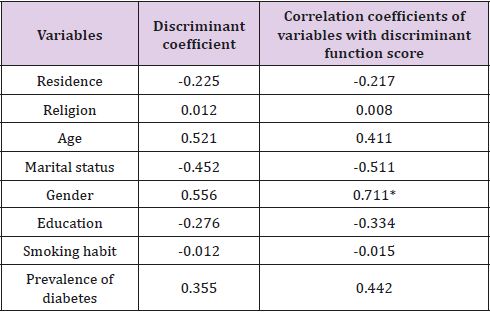
Table 2: Coefficient of discriminant function and pooled within groups correlation.
Note: Significant correlation.
Discussion
The analysis presented here was based on data collected from 900 adults. They were classified by the prevalence of overweight and obesity and others. In the first group there were 444 adults and in the second group there were 456 adults. Among the investigated units 635 were diabetic patients and 265 were normal subjects. The data were collected mostly by the doctors and nurses from their working places according to the convenient sampling plan. The prevalence of overweight and obesity was significantly associated with gender. Females were more exposed to overweight and obesity. Married subjects and adults of age group 25 -50 years were at higher risk of overweight and obesity. Businessmen, servicepersons, and housewives together were at more risk of overweight and obesity. Overweight and obesity were risk factors for adults who did not do any physical labor.
Conclusion
The analytical results contained in the paper were based on data collected from 900 adults investigated by some doctors and nurses according to convenient sampling design. These adults were classified into two groups according to their level of BMI. In one group there were 444 adults who had BMI ≥ 25. This group was termed as overweight and obese [1]. In another group there were 456 adults who had BMI < 25. The objective of the study was to investigate the risk factors among the adults who were not involved in any activities which are physical labor intensive. Usually, the businessmen, servicepersons, skilled workers and housewives were not directly involved in any work which is physical labor intensive [23,24]. Thus, it was assumed that the above-mentioned group of adults were at more risk of overweight and obesity. The analysis showed that the prevalence of overweight and obesity was higher among females. No other social characters were associated with prevalence of overweight and obesity. The study indicated that non-involvement in any activities which were physical labor intensive was not significantly associated with overweight and obesity. But higher risk prevailed for these groups of adults in respect of education and profession. Married persons and persons of age group 25 – 50 years were more exposed towards overweight and obesity.
The prevalence of overweight and obesity cannot be avoided,
but rate of prevalence can be reduced by suggesting the adults to be
alert against the problem. This can be done, if
1. Everybody takes, if possible, healthy and homemade food
and avoid the restaurant/ fast food as per as possible,
2. Everybody be vigilant against increase of body weight,
3. Everybody should be encouraged to do some sorts of
physical labor / physical exercise whenever they find free time,
4. Public health authority can motivate the people so that
they can avoid the danger of overweight and obesity.
References
- WHO (2018) WHO/News –Room/fact-sheets/detail/ obesity and overweight 2016?
- Obesity Complications, Mayo Clinic.
- (2018) The Top 10 Causes of Death WHO Retrieved .
- Silink M, Tuomilehto J (2011) Prevention and control of diabetes with a focus on low-and middle-income countries Paper 6 A Prioritized research agenda for prevention and control of NCDs.
- Dhurandhar N V (2004) Contribution of pathogene in human obesity. Drug News and Perspectives 17(5): 307-313.
- Berg C, Rosengren A, Aires N, Lappas G, Torén K, et al. ( 2005 ) Trends in overweight and obesity from 1985-2002 I Gotenberg West Sweden. Inter Jour Obesity 29(8): 916-924.
- Skliros EA, Merkoures P, Sotiro poulos A, Xipnitos C, Liva H, et al. (2008) The relationship between body mass index and hypertension in elderly Greeks, The Nemea Primary Care Study. Jour Amer Geriatrics Soc 56(5): 954-955.
- Kushal N (2009) Adversities of accumulation? Prevalence of obesity among immigrants. Health Economics 18(3): 291-303.
- Prasad SB, Fahrtash F, Malaiapan Y, Meredith IT, Cameron J, et al. (2010) Obesity and metabolic syndrome in patients with acute myocardial infraction. Int Jour of Card 144(3): 450-451.
- Redon J I, Cifkova R, Laurant S, Nilsson P, Narkiewicz K, et al. (2008) The metabolic syndrome in hypertension: European Society of Hypertension Position Statement. Jour of Hypertension 26(10): 1891-1900.
- Basen Engquist K, Chang M (2011) Obesity and cancer risk: recent review and evidence. Curr Oncol Rep 13(1): 71-76.
- Bertino B, Ardiri A M, Ali F T, Boemi P M, Cilio D, et al. (2006) Obesity and related diseases: an epidemiological study in Eastern Sicily. Minerva Gastroenterol Dietol 52(40): 379-385.
- Pulgaron E R (2013) Child obesity: a review of increased risk for physical and psychological combordities. Clin Ther 35(1): 18-32.
- Sinha R, Fisch G, Teague B, Tamborlane W V, Banyas B, et al. (2002) Prevalence of impaired glucose tolerance among children and adolescents with a marked obesity. N Engl J Med 346(11): 802-810.
- Ahirwar R, Mondal P R (2019) Prevalence of obesity in India : A systematic Review. Diabetes Metab Syndrom 13(1): 318-321.
- Calamusa G, Amodio E, Costantino C, Maria D Pasquate, Viviana Gelsomino, et al. (2012) Body mass index and factors associated with overweight and obesity: a cross-sectional study of adult subjects living in a small city of Western Sicily ( Italy). Italian Jour Pub Health 9(3): e7539.
- Akter S, Rahaman M M, Sarah K A, Sultan P (2014) Prevalence of diabetes and pre-diabetes and their risk factors among Bangladeshi adults: A Nationwide survey. Bulletin of the WHO 92(3): 204-213.
- Rahim M A, Hussain A, Azad Khan A K, Sayed MA, Keramat Ali S M, et al. (2007) Rising prevalence of type-II diabetes in rural Bangladesh: A population-based study. Diabetes Research and Clinical Practice 77(2): 300 -305.
- Shera A S, Rafique G, Khawja I A, Baqai S, King S, et al. (1999) Pakistan National Diabetic Survey: Prevalence of Glucose Intolerance and Associated Factors in Beluchistan Province. Diabetes Research Clinical Practice 44(1): 49-58.
- Yang W, Lu J, Weng J, Jia W, Xiao J, et al. (2010) Prevalence of diabetes among men and women in China. The N Eng J Med 362: 1090-1101.
- Zahng H, Xu J, Dahi A K, Xu Z, Wang H, et al. (2013) Relation of socioeconomic status to impaired fasting glucose and type-II diabetes: Findings based on a large population-based cross-sectional study in Tianjin, china. Diabetic Medicine 30(5): e157-62.
- De Onis M, Blossner M, Borghi E (2010) Global prevalence and trends of overweight and obesity among preschool children. Amer Jour Cli Nutrition 92(5): 1257-1264.
- Syed M S, Debra N, Mohammed H R, Musa R, Gul N, et al. (2004) Assessing obesity and overweight in a high mountain Pakistani population. Trop Med and Int Health 9(4): 526-532.
- Andy K (2019) The majority of truck drivers are obese and smoke, Business Insider CDC Niosh and Federal Motor Carrier Safety Administration.
