info@biomedres.us
+1 (502) 904-2126
One Westbrook Corporate Center, Suite 300, Westchester, IL 60154, USA
Site Map

Received: October 25, 2023; Published: November 14, 2023
*Corresponding author: Bin Zhao, School of Science, Hubei University of Technology, Wuhan, Hubei, China
DOI: 10.26717/BJSTR.2023.53.008448
This paper discusses the research on the allocation plan between experts and works in large-scale innovation competitions, establishes 0-1 planning model, Z-score evaluation model, PCA evaluation model, fuzzy evaluation model, “range” model, and difference perception evaluation model. It mainly uses linear programming algorithm and PCCs correlation coefficient to obtain the optimal plan for the allocation of experts and works. We use the method of linear programming to establish a 0-1 planning model with the goal function of maximizing the coverage rate of review experts to participating teams and the number of cross reviews, and sets the constraint condition that each work can be reviewed by 5 different review experts, each expert can review 120 different works, all variables are non-negative integers. An optimal solution is obtained, and the average distance between the review experts and works is calculated as 1439.29893, at this time, the comparability of the review plan is strong. Through analyzing the relationship between the original scores of experts and awards for works, the three evaluation models are redesigned: Z-score evaluation scheme, PCA evaluation scheme, fuzzy evaluation scheme. The correlation coefficients between the three plans and the original plan are calculated as 0.94, 0.86, and 0.89 respectively. Therefore, it can be seen that the Z-score evaluation scheme is better than the other two schemes.
We have designed a new standard score calculation formula to better reflect the level of an article in the overall work, to calculate the ranking of scores, and analyzed it with the actual ranking of award-winning papers agreed upon by multiple experts. The correlation is 96.32%, indicating that the new standard score formula is reliable. By calculating and analyzing the average score and range of two stages of reviews, it is found that the average score and range of the first stage are significantly higher than those of the second stage. The reason may be that the experts in the second stage require stricter standards, and their evaluations are more uniform, which can more accurately evaluate works and eliminate differences in scores among different experts. Therefore, it is more reasonable to adopt two stages for review. For those works with excessively large range outside the low range, this paper establishes a “range” model so that these works can be processed programmatically. Through this model, it is concluded that works with large range values have a connection with awards. Based on the method of differential decision-making, we established a complete innovation competition evaluation model - difference perception evaluation model. This model innovatively integrates the characteristics of multiple reviews and the differences between expert judges, can quickly output the final results, and calculates MSE as 0.24 and R² as 0.99 by evaluating and testing the model. The results show that the model can effectively improve the quality and efficiency of the review. At the same time, it makes a preliminary comparison and analysis of current review methods and provides suggestions and ideas for future review methods and processes.
Keywords: 0-1 Planning Model; Z-Score Evaluation Model; Fuzzy Evaluation Model; Principal Component Analysis Method; Difference Perception Evaluation Model
Background
Research Significance: Innovation competitions can stimulate students' team spirit, problem-solving skills, and scientific thinking, effectively improving the quality of talent cultivation. However, in the evaluation process, there are many challenges such as a large number of works, varying quality, limited number of judges, and significant differences in grading. These factors greatly affect the effectiveness of the competition. Therefore, exploring reasonable evaluation plans for large-scale innovation competitions is both practical and theoretically valuable. The significance of research on innovative competition evaluation plans [1]: Firstly, it can provide innovative ideas and methods for evaluation experts to more effectively evaluate works and minimize grading errors. Secondly, it can provide new evaluation standards for organizers to provide fair and transparent evaluation results, enhancing the credibility of the competition. Additionally, it can provide new data and models for related research on innovation competitions [2], promote the development of innovation competitions, and provide resources for improving evaluation plans.
Literature Review: With the rapid development of science and technology and intelligent systems, large-scale innovation competitions have joined the ranks of popular topics in innovation and entrepreneurship. As the topic heats up, people are paying increasing attention to the application and development of various evaluation plans and systems. Although these types of competitions attract a large number of participants, due to the lack of standard answers in this type of evaluation and potential high subjectivity among different evaluation experts, there are issues with uncertain evaluation results. To address these challenges, researchers have proposed various evaluation strategies. In the early stages, subjective judgment methods were mainly used. This approach saves time during the evaluation process but may be influenced by individual preferences. On this basis, standardized evaluation rules were introduced to reduce some subjectivity. Currently, competitions are optimizing their own evaluation plans and attempting to use various integration strategies to improve evaluation quality. Xu Zeshui et al. [3] used multi-attribute decision-making methods to consider factors such as expert reviewer numbers and submission quality, weighting each factor to enhance fairness in the evaluation. Zhuang Suofa et al. [4] employed hierarchical analysis (AHP) [5] and fuzzy evaluation methods to prove that increasing the number of reviewers and submissions has a positive impact on evaluation results. Wang Feng et al. [6] proposed a data-driven evaluation method [7] using data analysis to assist decision-making. Although these current evaluation methods have made progress, they still face significant challenges in optimizing the evaluation plan for large-scale innovation competitions [8].
Aims
The problem in the evaluation scheme for large-scale innovation competitions is to determine how, in the absence of standard answers, to fairly and scientifically evaluate the quality and innovation of works by different evaluation experts [9]. The issue of limited number of evaluation experts is to solve how to ensure that the error in the evaluation work does not increase when the number of experts decreases without affecting the winning level; the issue with the two-stage evaluation method is to resolve how to initially select using standard scores and mean values, and then reselect using standard scores and adjustment factors in the second stage; The aims of this paper are to address how to use simulated data to establish an optimal "cross-distribution" scheme, design a new standard score calculation model, establish a "range" model, and provide a complete review model. The following models have been established to achieve these aims:
Programming Model: Randomly distribute 3000 works to 125 experts so that each work is evaluated by 5 experts. How to determine the optimal "cross-distribution" scheme, i.e., how to randomly distribute works to different evaluation experts so that there is a certain intersection between the sets of works evaluated by different experts, to increase the comparability of scores while minimizing differences between evaluation sets as much as possible.
Comprehensive Review Model: Select two or more existing or self-designed evaluation methods and relevant attachment data, analyze the distribution characteristics of the original scores and adjusted scores (e.g., standardized scores) of each expert and each work, rank them according to different methods, and try to compare the advantages and disadvantages of these methods. In addition, focus on the evaluation of large-scale innovation competitions, design a new standard score calculation model. It is generally believed that papers with high consensus among multiple experts have the highest credibility. The data 1 in Attachment 2 includes the ranking of first prize works selected by consensus among experts in the second evaluation stage. Use this data to improve the standard score calculation model.
“Range” Model: The difficulty in evaluating innovation in large-scale innovation competitions is how to evaluate the innovation of works, because there are no standard answers and different experts may have different views. Moreover, the level of graduate students' papers varies, resulting in a large range of scores for the same work. Works with large ranges are usually distributed in high or low sections. Low-quality sections do not require adjustment of ranges. High-quality sections have higher quality and need to enter the second stage of evaluation for review and adjustment of works with large ranges. The review rules [10-12] of the second stage evaluation can serve as a reference for establishing the range model. Based on the simulated data 2.1 and 2.2 provided in the problem statement, analyze the changes in achievement results and range changes under two-stage evaluation schemes and comparisons between two-stage evaluation schemes and non-staged evaluation schemes, considering the relationship between large ranges and strong innovation. To discover innovative papers, establish a "range" model (including analysis, classification, adjustment, etc.), and provide a "large range" method for automatically handling non-high or non-low sections during the first stage evaluation based on the given data.
Difference Perception Review Model: Provide a complete evaluation model for "innovation competitions" (e.g., optimization model), solve it, and provide specific suggestions for improving existing evaluation schemes (including data collection needs for future improvement).
We have employed four methods to address different issues in evaluating large-scale innovative competitions, and method two contains three sub-methods [13]. The following is the model analysis corresponding to each method. 0-1 Programming Model analysis: To address this issue, we can first set an optimization goal for the evaluation plan, such as minimizing the scoring differences among evaluation experts or maximizing the intersection of evaluations by experts [14]. Then, based on the number of evaluation experts and the number of evaluations for each work, we can determine the solution space of the evaluation plan, which includes all possible allocations of works. Next, we can use linear [15-17] programming algorithms to find the optimal or approximate optimal evaluation plan in the feasible solution space. Finally, we can design relevant indicators, such as evaluation coverage, overlap rate, and balance degree of evaluation, to evaluate the quality of the evaluation plan (Figure 1). Comprehensive Review Model will affect the optimization of 0-1 Programming Model's "cross distribution" plan since different evaluation plans will have different scoring standards and formulas, affecting the calculation and analysis of rating differences and ranges among evaluation experts. We can select two or more evaluation plans, such as Z-score evaluation [18], PCA evaluation [19,20], and fuzzy evaluation [21-23] and analyze the distribution characteristics of each expert's original scores, adjusted scores (such as taking standard scores), and the characteristics of work rankings under different plans using the data in the attachment, such as mean, variance, range, skewness, and kurtosis.
Figure 1

Furthermore, we can compare these plans based on the analysis results and design a new standard score calculation model that incorporates correction factors [24], weight coefficients, fuzzy functions, etc. to improve the effectiveness of the evaluation plan. Additionally, we can use the data from attachment 2 as a reference standard to improve the standard score calculation model (Figure 2). “Range” Model analysis: In addressing “Range” Model, it is important to note that while range is an important indicator to measure rating differences and innovation, it cannot solely determine the quality of works based on its magnitude [25]. The level and distribution of ratings are also factors to consider. Moreover, attention should be paid to the rating tendencies and evaluation criteria of evaluation experts. Therefore, it is necessary to establish an evaluation model that takes into account not only range but also other relevant factors to classify and adjust works further and improve assessment quality. The connection between model 3 and previous models is that model 3 builds upon model 1 and model 2 by considering the relationship between range and innovation as well as the differences in rating levels and evaluation criteria among evaluation experts to make the model more comprehensive and detailed with practical application value (Figure 3). Difference Perception Review Model analysis: Addressing Difference Perception Review Model requires consideration of the completeness and systematicity of innovative competition evaluations [26].
The key factor in resolving this issue lies in finding an appropriate calculation method, establishing a complete evaluation model, analyzing existing models, and making suggestions for future evaluation processes. Based on the differentiation of expert judges, we established a difference-perceived evaluation model that combined with the Z-score standard score calculation method proposed in Comprehensive Review Model to form a complete evaluation model, further improving assessment efficiency. By analyzing current issues and social surveys based on existing problems, we propose practical suggestions that have real-world significance for improving the fairness and scientificity of future evaluations (Figure 4).
Figure 2

Figure 3

Figure 4

1. Based on the issues raised in this paper and the analysis above, we have made the following model assumptions:
2. It is assumed that the data provided are reliable and accurate.
3. It is assumed that the evaluation levels of the experts involved are comparable.
4. It is assumed that the experts are evaluating in the same environment without any external factors interfering with their evaluation.
5. It is assumed that the experts evaluate independently, without being influenced by the ratings of other experts or communicating with each other.
6. It is assumed that the experts' evaluations are relatively objective, unaffected by other factors, and only related to the quality and innovation of the work.
7. It is assumed that the experts' scores are relatively evenly distributed, i.e., there will be no excessively high or low scores.
The commonly used symbols are shown in the following table, and other symbols are described in each chapter of the paper (Table 1).
Table 1: Symbol Description Table.

In this section, we model and solve the four methods through experiments, which are divided into four subsections.
0-1 Programming Model
We should firstly deals with the number of intersections of works and the comparability of scores under the fixed number of participating teams, judges, and the number of judges for each work [27-30]. A 0-1 programming model is established to optimize the intersections of works among judges [31,32]. This subsection mainly focuses on the establishment, solving, and analysis of the 0-1 programming model (Figure 5).
Figure 5

Establishment of the 0-1 Programming Model: The objective of this model is to optimize the intersections of works among judges, that is, to make the intersections of works as large as possible, in order to increase the comparability of scores. The constraints are:
Each work is judged by exactly D judges, that is
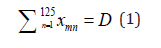
where m = 1, 2...,3000.
Each judge must judge exactly C works, that is

where n = 1, 2,...,125.
If the set of works judged by the nth and the q-th judges have an intersection, then Ynq = 1. ,otherwise Ynq = 0,that is
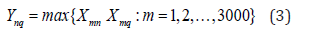
where n, q = 1, 2...,125, n ≠ q.
Solution and Analysis of the Model
Design of Calculation Methods and Determination of Parameters
Design of Calculation Methods:
Review Coverage Rate:
The proportion of experts who have been reviewed for each work, that is, the higher this indicator, the more review opinions each work receives, and the higher the fairness.
Review Overlap Rate: The ratio of the intersection between the works reviewed by each expert and the works reviewed by other experts, that is, the higher this indicator, the more intersections between the reviewed works and the higher the comparability of ratings (Table 2).

Table 2: 0-1 Programming Model Parameter Table.

Evaluation Balance: The balance between the difficulty and innovation of the works reviewed by each expert, i.e
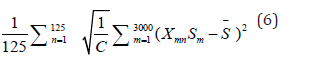
where it refers to the score of difficulty and innovation for the m-th work, and the average score of difficulty and innovation for all works. The lower this indicator, the more uniform the difficulty and innovation of the works evaluated by each expert, and the higher the fairness of the evaluation.
Modeling this problem as a combinatorial optimization problem [33,34], using the linear programming algorithm to solve the 0-1 integer programming problem, the steps are as follows:
Determination of Key Variables: Define a binary variable that represents the review expert number and the work number. This variable represents the status of the first reviewer reviewing the work. At 1 hour, the reviewer reviewed the work; When it is 0, it indicates that the work has not been reviewed.
x(n,m)nmnmx(n,m)nm . (8)
Definition of Objective Function: The objective is to optimize the comparability of scores given by different expert reviewers, that is, to maximize the intersection between the sets of works reviewed by different experts. So, the objective function can be defined as: this objective function represents maximizing the number of cross reviews between all reviewers and works.
Add Constraint Conditions: Limit the maximum number of works that can be reviewed by each review expert: The following constraints can be used to represent: for all of these constraints, ensure that each review expert does not exceed the maximum number of review works.
Each Work Needs to be Reviewed by a Peer Reviewer:
The following constraints can be used to ensure that all works are reviewed by peer reviewers.
Problem Solving Model: Use linear programming algorithm to solve the above optimization problem and find the optimal variable value, which is the best "cross distribution" scheme.
Result Analysis: Once the solution is completed, the results can be analyzed to determine which review experts should review which works, in order to maximize the comparability of the review.
Parameter Determination: Xmn as a 0 −1 variable, it represents the status of the m− th work being reviewed by the nth expert, where m = 1, 2, 3000, n = 1, 2, 125.
Xnq as a 0 −1 variable, represents the intersection state of the collection of works reviewed by the nth and q − th experts, where n, q =1, 2,125, n #q
Z as an integer variable, represents the total number of intersections of all expert reviewed work collections, i.e
C as a constant, it represents the number of works reviewed by each expert, i.e.
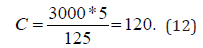
D as a constant, it represents the number of experts evaluated for each work, i.e.
Result Analysis: Based on the analysis of the results, the model has successfully achived an optimal "cross-distribution" scheme. The average distance between the evaluation experts and the work is 1439.29893. Under this optimal solution, optimize the cross-evaluation scheme when the constraint conditions are met. The code also provides a list of works reviewed by each reviewer. It can be seen that each reviewer reviewed 120 works, each of which was reviewed by 5 experts, and there were no duplicate reviews. This review arrangement ensures the fairness and effectiveness of the review, while also avoiding conflicts of interest among review experts and the impact of quality differences between works on the review results. This optimal solution helps to ensure the efficiency and feasibility of the review process, thereby improving the quality and reliability of the review (Figure 6).
Figure 6

Answer: Substitute the determined parameters into the Programming Model and use the pulp.LpProblem() function in Python see (Appendix 1) for the program to obtain an average distance of 1439.29893 between the reviewers and the work (see the result analysis chart)
The relevant indicators of the "cross distribution" plan include review coverage, review overlap, and review balance. Implementation details, including the following steps:
Step 1: To evaluate the difficulty and innovation of each work, quantification and standardization can be carried out based on the evaluation suggestions proposed by the proposition group, and a score of for the difficulty and innovation of each work can be obtained.
Step 2: Using the linear programming algorithm to solve the 0-1 integer programming problem mentioned above, the optimal "cross distribution" scheme is obtained, which is the value of each and the corresponding value of Z (intersection of expert reviewed work sets).
Step 3: According to the optimal "cross distribution" plan, randomly distribute the works to different experts, so that each work is reviewed by 5 experts, and ensure that there is a certain intersection between the sets of works reviewed by different experts.
Step 4: Evaluate the optimal "cross distribution" scheme, calculate the values of the three indicators mentioned above, as well as other possible indicators such as review time progress, quality differences, etc., and compare it with other schemes to analyze the advantages and disadvantages of this scheme.
Comprehensive Review Model
In order to solve the problem that the assumption of the standard score evaluation scheme may not hold, an improved comprehensive evaluation model was established [35,36]. The main content of this section is data preprocessing, establishment of the comprehensive evaluation model (including Z-score evaluation model, PCA evaluation model and fuzzy evaluation model), solution and analysis of the comprehensive evaluation model, and design of a new standard score calculation model (Figure 7).
Figure 7

Data Preprocessing: After observation, in order to better ensure the quality and applicability of the original data, for the subsequent model building and analysis, this section performed corresponding processing on data 1.
1. Outlier processing in order to better match the established model and obtain the required data, we perform simple processing on the abnormal data. Due to the different disputes over the team scores, we delete the team scores that are subject to reconsideration, and then better analyze the relationship between different components and obtain more accurate results.
2. Data filtering Since there are many data, but there are a lot of meaningless data, in order to ensure a more accurate comparison of the modeling methods, we remove all the team scores that have not undergone the second review, and only retain the scores of all the winning teams.
3. Data reintegration in order to better adapt to the model establishment and calculation, we rearrange and rename the filtered data, so that it is more convenient to calculate when inputting data into the model. The rearranged data mainly include the final score, ranking, award, original score and standard score of the first review, and original score and standard score of the second review.
4. Data preprocessing flow chart.
Establishment of Comprehensive Review Model:
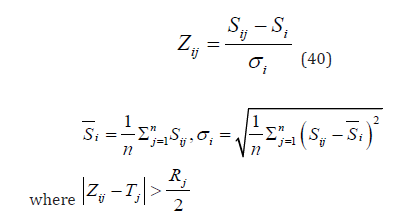
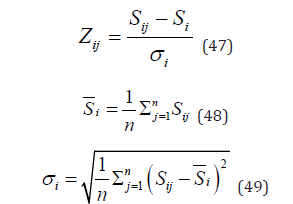
Z-score Evaluation Model: The original scores are standardized to eliminate the influence of dimension and scale on the scores, and to compare and rank the scores of different evaluation experts. Standardization is to subtract the average score of the evaluation expert to which each score belongs, and then divide by the standard deviation of the evaluation expert to which it belongs, to obtain the standardized score, which has a mean of 0, a variance of 1, and conforms to the standard normal distribution. The formula for the standardized score is:
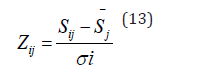
where denotes the original score, Sij denotes the average score of the

Then, the standardized scores of each work on each reviewer are summed up to obtain the comprehensive score, which corresponds to the quality of the work, the larger the better. The formula for the comprehensive score is:
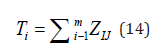
where Tj denotes the comprehensive score of the j-th work, Zij denotes the standardized score of the i-th reviewer for the j-th work, and m denotes the number of reviewers.
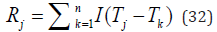
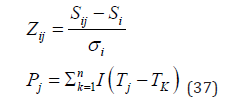
According to the size of the comprehensive score, the works are sorted to determine their final ranking. The formula for the ranking is:
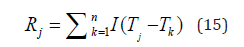
where Rj denotes the ranking of the i-th work, Tj denotes the comprehensive score of the j-th work, I denotes the indicator function, which takes the value 1 when the condition in the parentheses is satisfied, and 0 otherwise, and n denotes the total number of works.
PCA Evaluation Model
Data preparation: According to the original data information, filter and preprocess to obtain the original data matrix, the size of the original matrix is m×n, where m represents the number of works, and n represents the number of experts.
Data calculation: First, calculate the original score and the standard score average of the works in the first review process, which can be expressed by the formula:

where Xij denotes the original score of the i-th work by the j-th expert Xsij.denotes the standard score of the i-th work by the j-th expert, and

Next, calculate the highest and lowest scores of each work in the first review, which can be expressed as:
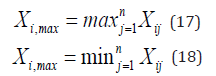
where denotes the meaning of the highest review score obtained by the work in the review process, denotes the lowest score of the work in the review process.
Finally, calculate the range of each work in the first review process, which can be expressed as:
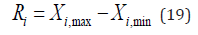
using the same calculation method, the corresponding average and range of the second review process can be calculated, and the specific calculation process is consistent with the above.
Principal component analysis: First, calculate the standard deviation of each work in the first review original score and standard score, which can be expressed by the formula:
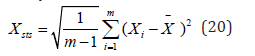
where m denotes the total number of works data, denotes the score value of the team’s work, denotes the average value of all team data, and denotes the standard deviation of the work review.
Next, calculate the standard deviation of the original score and the standard score of the second review, and the specific calculation process is consistent with the method of the first review process.
Finally, according to the PCA principle [37-40], calculate the principal components of the first and second reviews, in order to facilitate the subsequent calculation of the comprehensive standard score, and the specific calculation of the principal components is:
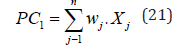
where PC1 is the first principal component, and similarly, the second review result can be obtained as the second principal component for subsequent calculation and evaluation, that is,PC1 is the first principal component
Calculate the comprehensive standard score:

where Score is the comprehensive standard score, α and β are adjustable weight factors.
Sorting: By calculating the comprehensive standard score, reorder them in descending order to determine the final ranking of the scores.
Fuzzy Evaluation Model
Based on the principle of fuzzy evaluation scheme, we constructed a mathematical model, which contains the following main parts:
Part 1: The method of determining the fuzzy set of evaluation results: We regard the evaluation result of each work as a fuzzy set, which is formed based on the scores of the evaluation experts [41-43]. Each score corresponds to a membership degree, which indicates the degree to which the score reflects the level of the work. For example, for a work with 90 points, its degree of belonging to “excellent” is 0.9, its degree of belonging to “good” is 0.1, and its degree of belonging to “general” and “poor” are both 0. The membership degree can be determined according to the distribution of scores, using methods such as triangular fuzzy numbers or trapezoidal fuzzy numbers [44]. The following are the specific formulas: Assuming that the score is x, the maximum value of the score is M, and the minimum value of the score is m, then the membership function of the score can be expressed as (Figure 8):

Figure 8

the membership function graph of the triangular fuzzy number is as follows:
If the distribution of scores is asymmetric, we can consider using the membership function of trapezoidal fuzzy numbers, with the formula and graph as follows:Let x be the score, M be the maximum score, m be the minimum score, Q3 be the upper quartile of scores, and Q1 be the lower quartile of scores. Then, the membership function of scores is:

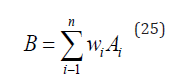
Part 2: Composite method for fuzzy set of works: Using fuzzy mathematics [45], each work's evaluation result is comprehensively integrated into an overall fuzzy set, representing the overall level of the work. The composite method can consider the weight of the evaluation scores given by the evaluation experts, and calculate using methods such as weighted average or weighted geometric mean. The fuzzy set of the work is recorded as A, the weight of the evaluation scores given by the evaluation experts is w, and the comprehensive fuzzy set is B. The formula is as follows:
Part 3: Weighted Average Composite Method: Multiply the membership degrees of each rating by their respective weights, and then add them up to obtain the composite membership degree. If the sum of the weight ratings is not equal to 1, normalization processing is required. The formula is as follows:

Part 4: Sorting Method for Composite Fuzzy Set of Works: Using fuzzy mathematics [46], sort each work's composite fuzzy set to determine the work's ranking. The sorting can be based on the membership degree function of the fuzzy set, using methods such as the maximum membership degree principle or the maximum membership degree sum principle. The composite fuzzy set of the work is B, and its membership degree function is


Solution and Analysis of Comprehensive Review Model
Design of Calculation Methods and Determination of Parameters
Design of Calculation Methods for Z-Score Evaluation Model:
The determination of key variables: refers to the original rating of the i-th reviewer on the j-th work, refers to the standardized rating of the i-th reviewer on the i-th work, refers to the comprehensive rating of the j-th work, refers to the ranking of the j-thwork, m refers to the total number of reviewers, n refers to the total number of works, refers to the average rating of the i-th reviewer, and represents the standard deviation of the i-th reviewer.
Standardized Rating:

Comprehensive rating: Calculate the sum of ratings for each work on all reviewers, i.e

Ranking:
Sort works based on their overall rating, i.e

where I represents the indicator function, which takes a value of 1 when the condition in parentheses is true, otherwise it is 0. For the PCA (Principal Component Analysis) evaluation model, the main factors affecting the evaluation results were identified, and a review plan was designed to recalculate the standard score. The results were output through coding and compared with the original traditional standard score calculation results, achieving better results. (The modeling flowchart is as follows)
PCA Design of Calculation Methods:
For the Fuzzy Evaluation Model, convert the scores of each evaluation expert into fuzzy numbers, establish a fuzzy evaluation matrix, determine the weight vector of evaluation indicators, calculate the fuzzy evaluation vector, and finally sort the works based on the size of the fuzzy numbers. This is an evaluation method based on fuzzy mathematics theory, which deals with the uncertainty and fuzziness of scoring (Tables 3 & 4).
Table 3: Z-Score Evaluation Model Parameter Information Table.

Table 4: PCA Evaluation Model Parameter Information Table.

For the Z-Score Evaluation Model, the parameters are determined as follows:
Number of review experts
The total number of works (Works entering the second round)
Original score: The original score is an The matrix of 352, where each element takes an integer value between 0 and 100, represents the i-th evaluation expert's rating of the work.
Ranking: Sort works based on their overall rating, i.e .
where I is 0 or 1.
For the PCA Evaluation Model, the parameters are determined as follows:
For the Fuzzy Evaluation Model, the Parameters are Determined as follows:
Establish a fuzzy evaluation matrix. Firstly, use a matrix of to represent the evaluation results of evaluation indicators on evaluation objects. Each element is a fuzzy number, which refers to the evaluation results of the evaluation indicator on the evaluation object. Then determine the weight vector of each evaluation indicator, which refers to the weight of the first evaluation indicator. Finally, calculate the fuzzy evaluation vector, which refers to the fuzzy number and represents the comprehensive evaluation result of the second evaluation object (Table 5).
Table 5: Fuzzy Evaluation Model Parameter Information Table.

Result Analysis
Z Score Evaluation Solution:
Based on the original rating, calculate the average rating and standard deviation for each reviewer, and then calculate the standardized rating for each work.

Calculate the comprehensive rating for each work based on standardized ratings.

Calculate the ranking of each work based on the comprehensive rating.
Fuzzy Evaluation Solution: According to the fuzzy evaluation vector, the evaluation objects are sorted according to the size relationship of the fuzzy number, and the final order of the evaluation objects is obtained.

The Judgment Method for the Size Relationship of Fuzzy Numbers: If the sum of two fuzzy numbers satisfies, then; If the sum of two fuzzy numbers satisfies, then; If the sum of two fuzzy numbers does not satisfy both the above two conditions and their inverse negation proposition, or, then the sum is not comparable and further judgment is needed (Table 6).
Table 6: Comparison of Evaluation Schemes.


Verification Method:
If, then; If, then; Otherwise, and still cannot be compared, other methods need to be used to determine, such as taking the center value of fuzzy numbers or membership functions (Figures 9-11).

Figure 9

Figure 10

Figure 11

Designing a New Standard Score Calculation Model
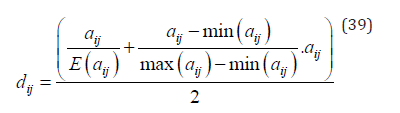
Firstly, we assume that each expert gives an original score for each work, representing their subjective evaluation of the quality. We use to represent the original score given by the expert for the work. Secondly, we consider the objective evaluation of each expert on the quality of the work, which refers to their to represent the objective score given by the expert for the work. The objective score is calculated by dividing the original score by the average original score of the expert's evaluated works and then multiplying by the original score, expressed as
where represents the expected value of the scores given by the expert to all works.
Thirdly, we consider the comparability of each work among different experts, which refers to its relative position in the works evaluated by different experts. We use to represent the comparable score given by the expert for the work. The comparable score is calculated by subtracting the minimum original score of the expert's evaluated works from the original score and then dividing by the difference between the highest original score and the lowest original score of the expert's evaluated works,

Finally, we comprehensively consider the above three aspects to give a standard score for each work under evaluation by each expert. We use to represent the standard score given by the expert for the work:
By calculating the standard scores for 5 experts in Stage 1 and 3 experts in Stage 2 using this standard score calculation model, and then taking a weighted average of the standard scores of the 5 experts in Stage 1 by multiplying their respective weights, adding the standard scores of the 3 experts in Stage 2 multiplied by their respective weights, and finally summing them up, we obtained the final total score. We then analyzed and compared this final score with the actual award-winning paper ranking agreed upon by multiple experts, and found that the rank correlation difference of this new standard score formula was 96.32%. This shows that the new standard score formula is reliable.
Range Model
To address the issue of extreme variability in large-scale innovation competitions [47-49], this section establishes a programmatic "range" model. Its main components include data preprocessing, the construction of the "range" model, solution and analysis of the model, and model verification.
Data Preprocessing: In order to facilitate data reading and calculation, the first stage 5 experts rating and the second stage 3 experts rating data in data 2.1 and data 2.2 are split into separate table data.
Establishment of the “Range” Model
Determination of Key Variables:
denotes the original score of the review expert for the work, denotes the standardized score of the review expert for the work, denotes the range of the work, denotes the comprehensive score of the work, denotes the ranking of the work, m denotes the total number of review experts, n denotes the total number of works, denotes the average score of the review expert, denotes the standard deviation of the review expert, α denotes the range threshold [50], β denotes the comprehensive score threshold.
Standardized Score:
Range: Calculate the difference between the maximum and minimum values of the scores of all review experts for each work, that is,

Comprehensive score [51]: Calculate the sum of the scores of all review experts for each work, that is,

Ranking:

where I takes 0 or 1.
Classification:
According to the range and comprehensive score, the works are divided into four categories, namely:
High score and high range: Rj ≥α and Tj ≥ β , representing high innovation of the work, but the opinions of the review experts are inconsistent, and need to be reconsidered.
High score and low range: Rj ≥α and Tj ≥ β , representing high innovation of the work, and the opinions of the review experts are relatively consistent, and no reconsideration is needed.
Low score and high range: Rj ≥α and Tj ≥ β , representing low innovation of the work, but the opinions of the review experts are inconsistent, and no reconsideration is needed.
Low score and low range: Rj ≥α and Tj ≥ β , representing low innovation of the work, and the opinions of the review experts are relatively consistent, and no reconsideration is needed.
Adjustment: For works with high scores and high ranges, according to the second-stage review experts, adjust the “large range” rule and complete the following adjustment process:
For the absolute value of the difference between the standardized score and the comprehensive score of the review expert, that is,

it is considered that the score of the review expert deviates from the score of other review experts and needs to be adjusted. Let the standardized score of the review expert approach the comprehensive score by a certain proportion, that is,
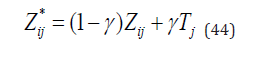
where represents the standardized score after adjustment, represents the adjustment ratio, and can try to take 0.5 first. After adjustment, recalculate the range and comprehensive score of the work. The adjusted range, that is,

Solution and Analysis of the Model
Design of Calculation Methods and Determination of Parameters
Design of Calculation Methods:
Calculate the average score and standard deviation of each reviewer based on the original score, and then calculate the standardized score for each work. Calculate the range and comprehensive score for each work based on standardized grading [52-54]. According to the range and comprehensive rating, works are divided into four categories, namely high score high range, high score low range, low score high range, and low score low range. For works with high scores and high range, adjust the deviation score by a distance of 0.5 (half) towards the direction of the comprehensive score according to the adjusted proportion to obtain a standardized score, and then calculate the range and comprehensive score of the work. Sort the works according to the comprehensive rating or to obtain a ranking (Table 7).
Table 7: Range Model Parameter Information Table.

Parameter Determination:
Number of evaluation experts: The number of evaluation experts in the first stage is 5, and the number of evaluation experts in the second stage is 3, that is, mm_1=5,m_2=3.Total number of works: (Attachment Data 2.1) nn=240. Original rating: The original rating is an 8240 matrix with elements ranging from 0 to 100, which refers to the rating of the first work by the first reviewer.
Threshold of Range: The range threshold is set to 2, which means that when the range of the work is greater than or equal to 2, it is considered that the range of the work is too large and needs to be adjusted. Threshold of comprehensive evaluation: The threshold of comprehensive evaluation is set to 0, which means that when the comprehensive evaluation of a work is greater than or equal to 0, it is considered that the work has high innovation and belongs to a high segment. Otherwise, it belongs to a low segment.
Adjustment Ratio: The adjustment ratio is 0.5, which means that when the range of the work is too large, the deviation score is adjusted by a distance of 0.5 (half) closer to the direction of the comprehensive score.
Result Analysis
By calculating and analyzing the average and range of evaluation scores in the two stages, as shown in Figure 12, the average score in the first stage is higher than that in the second stage, and the range in the first stage is also higher than that in the second stage. This may be due to the stricter requirements of experts in the second stage and the more unified evaluation of experts, which can more accurately evaluate works and eliminate the differences in scores between different experts to a greater extent, Therefore, adopting a two-stage review is more reasonable.
Figure 12

In order to achieve a programmatic approach (without human intervention) for handling the "big range" of non high and non low segmented works in the first evaluation stage, we wrote Python script code and divided the works into four categories by setting thresholds, namely high score high range, high score low range, low score high range, and low score low range. We also used the code to handle the "big range" of non high and non low segmented works by adjusting the threshold of the comprehensive rating β And adjusted proportions γ The model was revised and the final work with a "large range" score selected by the model had an award rate of over 95%, proving the effectiveness of the model.
Difference Perception Review Model
This section mainly focuses on the establishment of the optimized complete model, as well as data preprocessing, the establishment of the difference perception review model, solving and analyzing the model, and model verification.
Data Preprocessing
Data Processing: The data used in this section is the data provided in Attachment 1. To avoid any conflict between the output results of the new designed model and the original traditional computing method, we first deleted the original rankings, awards, and final grades columns. Secondly, to enable future comparison with the original results, we inserted a randomly generated work number in the first column of both the original data table and the input model's data table. The purpose of this work number is solely for subsequent evaluation and comparison purposes and has no other meaning.
Statistical Data Analysis: To better construct the model and train it, we conducted statistical analysis on the number of people who won each award level and the total number of teams in the original data. We defined these variables as variables for use in the model, ensuring data consistency and allowing for more fair and comparative analysis.
Establishment of the Difference Perception Review Model
This section proposes a Difference Perception Review Model that can calculate scores and rank entries based on input raw data, outputting the final ranking results. To better verify the effectiveness of this method, we also evaluated the results output by this model against the original ranked results. The specific implementation steps of the Difference Perception Review Model [55-57] are as follows:
Step 1: Input the dataset to be ranked, data, which records information mainly including scores and simple score calculations given by experts to entries in the competition during the first and second review processes.
Step 2: For the input data, first calculate the standard scores of all first review scores. For the standard score calculation, we adopt the Z-score evaluation scheme proposed in section 5.2.2 to recalculate the standard scores. The specific formula can be expressed as:
Then, based on the standard scores given by the first five experts in Stage 1, we calculate the average score and sort the data in descending order of this average score. Based on the sorted data, we conduct preliminary grade evaluations by selecting the first n teams to enter Stage 2 for comprehensive evaluation and grading. This approach ensures fairness and reduces subjectivity due to expert judgements. Let's assume there are m teams in total, then we evaluate the remaining (m-n) teams. We directly evaluate the first a teams as third-place winners, and all remaining teams as unsuccessful. The parameters m, n, and a are calculated during the data statistics section."
Step 3: For the teams entering Stage 2 evaluations, we first differentiate them based on the range difference scores from Stage 2 reviews. If the range difference score is greater than a threshold δ (in our model, δ = 20), then the overall final score is equal to the weighted sum of the average score S1 from the first review, the standard scores S2 from the second review, and the average score S3 from the original scores in Stage 2. The specific process can be expressed using a formula:
Score =α *S1+ S2 +μ

Step 4: In this model, A, B, C, D, and E represent the standard scores calculated by the first five experts during the first review, H, F, and G represent the standard scores calculated by the three experts during Stage 2, M, N, and Q represent the original scores given by the three experts during Stage 2. α, μ, β, γ and ε are all weight factors, and their sum is equal to 1. The specific weight values can be obtained from model training. The optimal value for alpha is 0.6, while μ, β, γ and ε are all set to 0.1. If the range difference score is greater than the threshold δ,the final score is equal to the weighted sum of the average score S1 from the first review, the standard scores S2 from the second review, and the average score S3 from the original scores in Stage 2. The specific process can be expressed using a formula:
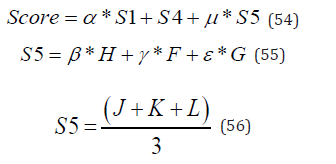
where J, K, and L represent the review scores given by the three experts in Stage 2.
Step 5: Subsequently, the teams that will undergo the second evaluation are arranged in descending order of their final scores, and the performance grades are divided based on these scores. Each grade is then further divided by the number of teams in it. Finally, the data tables for the teams that have gone through both the first and second evaluations as well as those that only went through the first evaluation are combined into one data table, sorted, and outputted. The final score sheet for this model is also outputted.
Step 6: To evaluate the model, we calculate the correlation between the output score sheet and the original data table that was arranged correctly. We then plot a heat map to visualize and evaluate the degree of correlation between them.
Solution and Analysis of the Model
Design of Calculation Methods and Determination of Parameters:
The Difference Perception Review Model mainly includes three main parts:
Data preprocessing, model design, and model evaluation. The specific details and ideas of model design can be seen in Figure 13.
Parameter Determination: In the Difference Perception Review Model, the main parameters we need are expert ratings A, B, C, D, E, F, G, H, and weight parameters provided in two stages α, µ, β, γ, ε, The specific modeling process code can be found in the Appendix 2-6, (Figures 14 & 15) (Table 8).
Figure 13

Figure 14

Figure 15

Table 8: Difference Perception Review Model Parameter Information Table.

Result Analysis: According to the Difference Perception Review Model, using Python, the title attachment data is used as the basic data for model training and solving, and data such as award level, ranking, and final score of each work are obtained. After analyzing the solution results, it was found that the differentiated design of the Difference Perception Review Model can effectively evaluate and analyze the performance of the work. For "innovation" competitions, this section designs a Difference Perception Review Model based on differentiated performance of judges. This model utilizes methods such as Z-score standard weight calculation and weight adjustment to calculate the entries, and considers multiple comprehensive evaluations based on grading, thereby improving the efficiency of the evaluation system. We believe that there are several suggestions for improvement in the current evaluation plan (Figure 16).
Figure 16

Before Review: Convene a more comprehensive and representative review panel, covering different fields and professional backgrounds as much as possible. At the same time, a random grouping method can be used to divide the evaluation committee, which can greatly avoid the interest correlation between the evaluation experts. Provide systematic training for evaluation experts to ensure that each expert is familiar with the current evaluation rules and avoid interference from scoring indicators based on previous competition experience.
Under Review: Moderately increasing communication and communication between reviewers and authors can help them better understand the innovation and practical value of the work, ensuring the accuracy of the review. Especially when there are works with significant differences in ratings, sufficient communication is necessary to effectively avoid the impact of individual biases or misunderstandings by reviewers on the evaluation results. In situations where the review time is not urgent, a feedback mechanism can be used to ensure that both the review experts and the author of the work receive the review results and opinions in a timely manner.
After Review: After obtaining the original evaluation score, when calculating the final result, it can be considered to introduce weight factors and allocate them based on factors such as the qualifications, abilities, and professionalism of each evaluation expert, in order to improve the scientificity and rationality of the evaluation. Some evaluation quality indicators, such as consistency and efficiency, can also be introduced to monitor the progress of the review and evaluate the quality of the review.
What further data needs to be collected in the future, I believe, can include the following aspects:
Review the professional direction, research background, review experience and other information of the experts, in order to comprehensively consider the allocation of each weighting factor.
More detailed information about the author of the work, such as competition experience, past honors, etc., can provide more key references for analyzing the quality of the work, especially for works with significant differences in evaluation opinions, which is more conducive to the unity of evaluation opinions.
A list of records for the review process, including the review cycle, stages, review methods, review suggestions, review feedback, etc., to facilitate the supervision of the review process and the verification of the review results of works with significant differences.
The collection of opinions after the evaluation cycle, including the rationality of the various rules set in the competition schedule and the satisfaction of the evaluation results by the evaluation experts and participating authors.
Model Validation: The difference perception review model is the complete review model [58]. To more comprehensively evaluate the performance of this model, this section carried out a model test. The specific process was implemented according to the following steps:
First, we screened the data output and generated test data. Due to the large amount of original data, we chose the "final score" data for analysis during the data test.
1 Model test: We conducted multiple simulations, setting the number of simulations to 1000, and introduced different random errors in each simulation process to observe whether the model's output is stable and whether the model's performance is interfered with.
2 We calculated the mean squared error (MSE) and determination coefficient (R²) to further evaluate the degree of fit of the model.
3 By following these steps and generating box plots through visualization, we can more intuitively and comprehensively test the model.
The box plot in Figure 16 shows that the distribution of data in this graph is relatively uniform, with relatively few outliers. As we know, the smaller the MSE, the better the fit of the model. The R² value can be used to measure the model's ability to explain variance. The closer R² is to 1, the better. We calculated the mean squared error of the model and obtained a result of MSE = 0.24 and a decision coefficient of R² = 0.99 (rounded to two decimal places). Based on these results, it can be seen that the difference perception review model has good fitting ability and stability (Figures 17 & 18).
Figure 17

Figure 18

Advantages of the Models
For the 0-1 Programing Model: It aims to maximize the intersection of works evaluated by experts as its optimization goal, with the following advantages:
1.It can effectively utilize the resources of expert evaluation, ensuring that each work receives sufficient review opinions;
2. It can effectively increase the intersection of works evaluated by experts, enhancing the comparability of review results;
3. It can ensure an even distribution of workload and balanced review tasks among experts.
For the Z-score Evaluation Model: It standardizes the ratings of each expert, eliminates rating bias, calculates a standard score for each work based on the scores of all works, and finally sorts the works based on their total score. Its advantages are as follows:
1. It has low computational complexity and does not require weight determination.
2. It can flexibly adapt to different rating scales and ranges, showing certain universality.
3. It can both reflect the rating level and overall tendency of each expert and the rating differences of each work.
For the PCA Evaluation Model: It constructs a scoring matrix with each expert's score as a variable, uses the PCA algorithm to extract the main components that can serve as evaluation indicators, adds up the main component scores of all works to obtain the total score of each work, and finally sorts the works based on their total score. Its advantages are as follows:
1. It can reduce the dimensionality and information redundancy of ratings and extract the most representative indicators.
2. It can both reflect the differences between works and measure the influence of each expert's ratings.
3. It can extract key evaluation indicators by analyzing the main components, avoiding randomness in grading.
For the Fuzzy Evaluation Model: It transforms each expert's rating into a fuzzy membership degree [59], constructs a fuzzy evaluation matrix, assigns expert weights, then uses fuzzy evaluation operators [60] to multiply the weight vector with the fuzzy evaluation matrix to obtain a fuzzy evaluation vector for each work, and finally sorts them. Its advantages are as follows:
1. It can utilize the concept of fuzzy mathematics to handle uncertainty and vagueness in ratings.
2. By expressing the evaluation results as fuzzy numbers, comparisons between different evaluation objects are more comparable.
3. The mathematical foundation of fuzzy evaluation models is solid, providing reasonable evaluation results and fully considering the interrelationships between different factors.
For the "Range" Model: Its advantages are as follows:
1. It can utilize the correlation between range and innovation to discover works with higher innovation levels.
2. It can use statistical methods to reduce uncertainty in ratings, making the final review results more reliable.
3. It can utilize a re-evaluation mechanism to handle works with large rating differences and diverse opinions, thus enhancing consistency in review results.
4. It can comprehensively consider expert ratings, difficulty levels of works, innovation levels of works, and experts' weights and measurement standards of works, making the final results fairer.
For the difference Perception Review Model: Its advantages are as follows:
1. Considering expert differences: Considering the differences between individual experts in two reviews can effectively reduce deviations caused by subjectivity, contributing to improving the scientificity and fairness of reviews.
2. Integrating multiple dimensions of information: Not only using average scores for performance evaluation but also considering revision scores, raw scores, standard scores, range values, etc. Through weight allocation, it makes comprehensive performance assessment more objective and reasonable.
3. Fairness and rationality: Through multiple rounds of reviews, the difference perception evaluation model can to some extent improve the fairness and rationality of reviews, reducing disputes over review results.
4. Considering range threshold: The difference perception evaluation model sets a range threshold to distinguish different review methods under different circumstances, helping to better adapt to different performance situations of works, which is more flexible and specific in grade evaluation for works, with less workload.
Limitations of the Models
For the 0-1 programing model,it has difficulties in solving when there are a large number of review experts and works, resulting in high time and space costs.
For the Z-score evaluation model, it ignores the relationship between the difficulty and innovation of works and the differences in weights among experts.
For the PCA evaluation model, it has complex computations that involve matrix operations and eigenvalue decomposition.
For the fuzzy evaluation model, it requires establishing appropriate fuzzy membership functions, determining evaluation levels and weights, as well as selecting appropriate fuzzy evaluation synthesis operators.
For the "Range" model, there may be difficulties in parameter selection, such as weight coefficients and evaluation coefficients [61].
For the difference perception review model, When analyzing it, only key aspects are analyzed, ignoring other relevant objective factors, making it overly idealistic.
Promotion of Models
The Practical Advantages of the Models Developed in this Paper are: They can be applied to the design and optimization of review plans for large-scale innovation competitions, as well as in other fields that require multiple experts for evaluation, such as scientific research projects, academic papers, and artistic works, to improve the efficiency and quality of the evaluation process [62]. The main difference between the 0-1 planning model and other models is that it maximizes the intersection of works among review experts as the optimization objective, while other models usually minimize the difference in works among review experts as the optimization objective. This makes the model more reflective of the comparability and consistency of the evaluation results. The comprehensive review model synthesizes the advantages of Z-score evaluation models, PCA evaluation models, and fuzzy evaluation models, while overcoming their shortcomings, making the model more reflective of the reliability of the evaluation results. The "Range" model considers factors such as difficulty, innovation, expert ratings, and evaluation criteria for a work comprehensively, compared to other models that typically focus only on work ratings and differences or expert ratings and tendencies, without fully considering the interrelationships and impacts between works and experts.
The main advantage of this model over others is that it can effectively utilize the resources of review experts, allowing each work to receive sufficient reviews, and then comprehensively considering different reviews. Other models may not fully reflect the objectivity of the evaluation due to insufficient reviews for some works or too many reviews causing unbalanced issues, affecting the fairness and effectiveness of the evaluation results. The potential value of this model is theoretically that it provides new theoretical and practical methods for designing and evaluating review plans for large-scale innovation competitions, enriching the research content of review plans, providing new standards for plan selection and evaluation; practically it simplifies the workflow of review plans, improves efficiency and timeliness, supports programmability and automation of review plans; socially it enhances the social justice and fairness of review plans, improves transparency and credibility, promotes public participation and supervision; and economically it helps to assess and optimize the economic cost and benefit of review plans, reduces resource consumption, improves the ratio of input to output, and promotes coordination and balance between economic and social benefits.
The limitations of this model include ensuring impartiality and effectiveness in the evaluation requires an appropriate ratio between the number of review experts and works to ensure that each work receives an equal number of reviews. Otherwise, it may lead to insufficient or excessive reviews for some works, affecting the accuracy and fairness of the evaluation results.
Improvement directions for this model include incorporating machine learning or artificial intelligence methods to improve the efficiency and quality of evaluation, considering data mining or data analysis methods to discover rating patterns and features to enhance the meaning and value of evaluation; considering multi-objective optimization or multi-criteria decision-making methods to comprehensively consider the intersection and difference of works among review experts and their rating levels and evaluation standards to improve the reasonableness and fairness of evaluation results; considering fuzzy mathematics or uncertainty theory methods to handle rating uncertainty and fuzziness to improve the scientificity and reliability of evaluation results. The prospect for applying this model in practice is to hope that it can be widely used in the design and optimization of review plans for large-scale innovation competitions.
We have no conflict of interests to disclose and the manuscript has been read and approved by all named authors.
This work was supported by the Philosophical and Social Sciences Research Project of Hubei Education Department (19Y049), and the Staring Research Foundation for the Ph.D. of Hubei University of Technology (BSQD2019054), Hubei Province, China.


