info@biomedres.us
+1 (502) 904-2126
One Westbrook Corporate Center, Suite 300, Westchester, IL 60154, USA
Site Map

Received: May 20, 2017 Published: May 31, 2017
Corresponding author: Abhijit Mitra, Department of marine science, University of Calcutta, 35 B.C. Road, Kolkata 700091, India
DOI: 10.26717/BJSTR.2017.01.000114
Urban vegetation, particularly trees provides a wide spectrum of ecosystem services which include upgradation of air quality, stabilizing temperature, reduction in ultraviolet radiation, oxygen generation, carbon sequestration, habitat of several flora and fauna (enhancement of biodiversity) aesthetic beauty etc. Oxygen production is one of the most commonly cited benefits of urban trees. The purpose of this article is to estimate the oxygen production by the dominant trees in the urban area of Konnagar, compare it with the estimated oxygen consumption by the population of the area and illustrate why oxygen production by urban trees is an important ecosystem service.
Net oxygen production by trees is a function of the amount of oxygen produced during photosynthesis minus the amount of oxygen utilized during respiration [1]. If the carbon dioxide uptake during photosynthesis exceeds carbon dioxide release by respiration during the year, the tree will accumulate carbon (carbon sequestration). Thus, a tree that has a net accumulation of carbon during a year (tree growth) also has a net production of oxygen. This net production of oxygen is estimated as per the following expression
Net O2 release (Kg/yr) = Net C sequestration (Kg/yr) ×32/12
The entire methodology of estimating oxygen production conducted during 2016 involved four phases.
Konnagar is located on the west bank of the River Hooghly between 22.7°N and 88.35°E and has an average elevation of ~ 13.56metres. It is positioned between Rishra and Hindmotor on the Howrah-Bardhaman Main Line and Grand Trunk Road. Approximate area of Konnagar is 4.32km2. A wide spectrum of tree species is a noted feature in the landscape of Konnagar. The dominant tree species includes Mangifera indica (Mango), Azadirachta indica (Neem), Aegle marmelos (Bel), Terminalia arjuna (Arjun), Eucalyptus globus (Eucalyptus), Psidium guajava (Guava), Acacia auriculacformis (Akashmoni), Peltophorum pterocarpum (Radhachura), Delonix regia (Krishnachura) etc.
The entire network of the present study initiated with the selection of six sampling zones in the Konnagar Municipality area. In each zone 10m×10m quadrat was selected (at random) for the study and the average readings were documented from each such quadrate by involving the school students and teachers after imparting a training to the team members on biomass estimation of trees. A form was supplied to all the participating schools where the students measured and estimated the Diameter at Breast Height (DBH) and Relative Abundance (RA) of the tree species under the supervision of their teachers. The mean relative abundance of each tree species was evaluated for assessing the order of dominance of tree species in the study area. Only those species occupying equal to and above 70% in the study area were considered for carbon estimation. This exercise (by involving the teachers, students and staffs of Konnagar Municipality) was carried out to aware the people of all ranks of the society regarding the values of trees in upgrading the environmental health.
The Above Ground Biomass (comprising of stem, branch and leaf) of individual trees of dominant species in each quadrate was estimated as per the standard procedure stated here and the average biomass values (of all quadrates of each zone) were finally expressed as tonnes per hectare. The methodologies adopted for assessing the above ground biomass (sum total of leaf, stem and root) in the present study are explained in details through three sections.
Section 1: Stem biomass estimation
The stem biomass for each tree species in every plot was estimated using non-destructive method in which the Diameter at the Breast Height (DBH) was measured after assessing the circumference with a measuring tape and height with laser beam (BOSCH DLE 70 Professional model). Form factor was determined with Spiegel relascope as per the method outlined by Koul and Panwar[2]. The stem volume (V) was then calculated using the expression FHΠr2, where F is the form factor, r is the radius of the tree derived from its DBH and H is the height of the target tree. Specific gravity (G) of the wood was estimated taking the stem cores, which was further converted into stem biomass (BS) as per the expression BS = GV.
Section 2: Branch biomass estimation
The total number of branches irrespective of size was counted on each of the sample trees. These branches were categorized on the basis of basal diameter into three groups, viz. <6cm, 6–10cm and >10cm. Dry weight of two branches from each size group was recorded separately using the equation of Chidumaya [3].
Total branch biomass (dry weight) per sample tree was determined as per the expression:
Bdb = n1bw1 + n2bw2 + n3bw3 = Σ nibwi
Where, Bdb is the dry branch biomass per tree, ni the number of branches in the ith branch group, bwi the average weight of branches in the ith group and i = 1, 2, 3, …..n are the branch groups. This procedure was followed for all the dominant tree species separately for every quadrate.
Section 3: Leaf biomass estimation
Leaves from nine branches (three of each size group as stated in section 2) of individual trees of each species were removed. One tree of each species per quadrate was considered for estimation. The leaves were weighed and oven dried separately (species wise) to a constant weight at 80 ± 50C. The leaf biomass was then estimated by multiplying the average biomass of the leaves per branch with the number of branches in a single tree and the average number of trees per plot as per the expression:
Ldb = n1Lw1N1 + n2Lw2N2/ + ……….niLwiNi
Where, Ldb is the dry leaf biomass of the tree species per quadrate, n1..….ni are the number of branches of each tree species, Lw1 …….Lwi are the average dry weight of leaves removed from the branches and N1………Ni are the number of trees per species in the quadrate.
Direct estimation of percent carbon was done by a CHN analyzer. For this, a portion of fresh sample of stem, branch and leaf from selected trees (two trees/species/plot) of individual species (covering all the selected plots) was oven dried at 700C, separately ground to pass through a 0.5mm screen (1.0mm screen for leaves). The carbon content (in %) was finally analyzed for each part of each species through a Vario MACRO elementar CHN analyzer. The total stored carbon in the above ground biomass was estimated by considering the mean relative abundance of each species in the selected quadrats and finally the stored carbon in the above ground biomass was estimated for each species by dividing the values with the respective age of the species. The information on the age of the tree was collected from the local inhabitants.
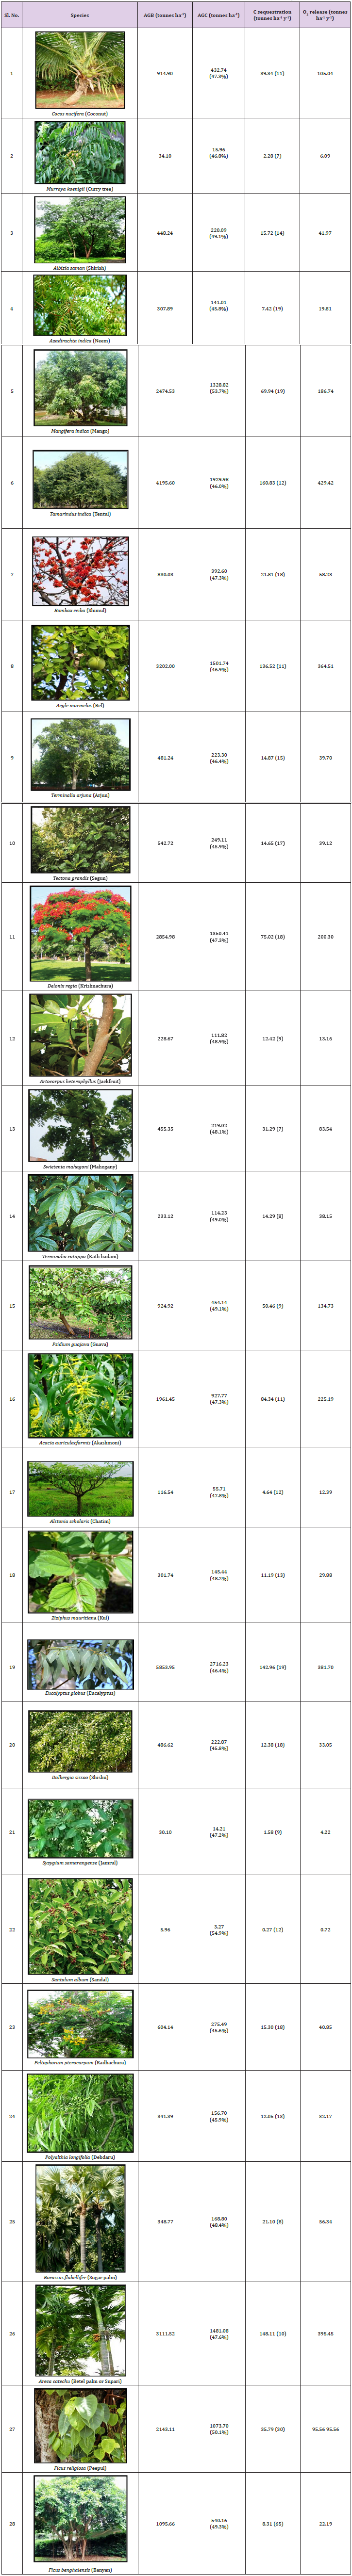
The AGB of the study site was in the order Eucalyptus globus (5853.95) > Tamarindus indica (4195.60) > Aegle marmelos (3202.00) > Arecea catechu (3111.52) > Delonix regia (2854.98) > Magnifera indica (2474.53) > Ficus religiosa (2143.11) > Acacia auriculacformis/ (1961.45) > Ficus bengalensis (1095.66) > Psidium guajava (924.92) > Cocos nucifera (914.90) Bombax ceiba (830.03) > Peltophorum pterocarpum (604.14) > Tectona grandis (542.72) > Dalberegia sissoo (486.62) > Terminalia arjuna (481.24) > Swietenia mahagoni (455.35) > Albizia saman (448.24) > Polyalthia longifolia (341.39) > Azadirachta indica (307.89) > Ziziphus mauritiana (301.74) > Terminalia catappa (233.12) > Artocarpus heterophyllus (228.67) > Alstonia scholaris (116.54) > Murraya koenigii (34.10) > Syzygium samarangense (30.10) > Santalum album (5.96) (Table 1).
Similarly the AGC followed the sequence of Eucalyptus globus (2716.23) > Tamarindus indica (1929.98) > Aegle marmelos (1501.74) > Arecea catechu (1481.08) > Delonix regia (1350.41) > Magnifera indica (1328.82) > Ficus religiosa (1073.70) > Acacia auriculacformis (927.77) > Ficus bengalensis (540.16) > Psidium guajava (454.14) > Cocos nucifera (432.74) > Bombax ceiba (392.60) > Peltophorum pterocarpum (275.69) > Tectona grandis (249.11) > Terminalia arjuna (223.30) > Dalberegia sissoo (222.87) > Albizia saman (220.09) > Swietenia mahagoni (219.02) > Polyalthia longifolia (156.70) > Ziziphus mauritiana (145.44) > Azadirachta indica (141.01) > Terminalia catappa (114.23) > Artocarpus heterophyllus (111.82) > Alstonia scholaris (55.71) > Murraya koenigii (15.96) > Syzygium samarangense/ (14.21) > Santalum album (3.27) (Table 1).
The net oxygen release varied as per the order Tamarindus indica (429.42) > Arecea catechu (395.45) > Eucalyptus globus (381.70)> Aegle marmelos (364.51) > Acacia auriculacformis (225.19) > Delonix regia (200.30) > Magnifera indica (186.74) > Psidium guajava (134.73) > Cocos nucifera (105.04) > Ficus religiosa (95.56) > Swietenia mahagoni (83.54) > Bombax ceiba (58.23) > Borassus flabellifer (56.34) > Albizia saman (41.97) > Peltophorum pterocarpum (40.85) > Terminalia arjuna (39.70) > Tectona grandis (39.12) > Terminalia catappa (38.15) > Dalberegia sissoo (33.05) > Polyalthia longifolia (32.17) > Ziziphus mauritiana (29.88) > Ficus bengalensis (22.19) > Azadirachta indica (19.81) > Artocarpus heterophyllus (13.16) > Alstonia scholaris (12.39) > Murraya koenigii (6.09) > Syzygium samarangense (4.22) > Santalum album (0.72) (Table 1).
The production of oxygen by the trees is undoubtedly an important ecosystem service as this gas regulates the metabolic activities of living organisms. An average adult human being consumes 0.84 kg of oxygen per day, which is equivalent to 1.85 lb per day [4]. Considering this value, the average oxygen consumption in Konnagar Municipality is 306.6Kg/year/head. As per 2011 census, Konnagar had a population of approximately 80,000 and therefore there is a necessity of 24,528 tonnes of oxygen per year to sustain this population. The present study shows that the yearly generation of oxygen by the 28 dominant species in Konnagar Municipality is 2959.68, which indicates that there is an approximate deficit of oxygen in the Municipality area by 8 times to balance the need of oxygen by the population of Konnagar Municipality. In other words 8 times more plantations are required to meet the oxygen requirement of the people of the area. This calculation, however, has uncertainty as the seedlings and grassy vegetations have not been considered in the present estimation. The water bodies of Konnagar Municipality have also been overlooked in this estimation process, although phytoplankton are the major sources of oxygen in the ambient environment. Our first order analysis, however, reports that trees like Tamarindus indica, Arecea catechu, Eucalyptus globus, Aegle marmelos need to be planted to restore the oxygen depletion in the present municipality area. A more detailed study considering the seedlings, herbs and shrubs along with oxygen generated by phytoplankton is needed to achieve a comprehensive picture of floral based oxygen budget in the present geographical locale.
Table 1: List of dominant tree species in Konnnagar Municipality with their respective AGB, AGC, C-sequestration and O2 release values.