info@biomedres.us
+1 (502) 904-2126
One Westbrook Corporate Center, Suite 300, Westchester, IL 60154, USA
Site Map

Received: December 01, 2017; Published: December 18, 2017
Corresponding author: Bassil El Masri, Department of Geosciences, Murray State University, Murray, KY, 42071, USA
DOI: 10.26717/BJSTR.2017.01.000604
Soil moisture is a key variable of the climate system and plays an important role in local, regional and global climates. It constrains vegetation photosynthesis, respiration and transpiration in many regions of the world. However, large-scale and long-term observation of soil moisture is sparse. The main objective of the paper is to investigate the spatial and temporal variability in remote sensing soil moisture for the State of Kentucky. The observed trends in satellite soil moisture estimates for different Kentucky biome types are analyzed. To accomplish this task soil moisture data from Advanced Microwave and Scanning Radiometer (AMSR-E) for years 2002-2011 are used. Daily AMSR-E data are averaged to produce monthly estimates. Moderate Resolution Imagining Spectroradiometer (MODIS) Land cover data are used to subset the AMSR-E data for the major Kentucky biomes: Forest and cropland. Results show that the spatial variability of soil moisture is related to vegetation type. AMSR-E soil moisture data shows an apparent decreasing trend in KY soil moisture during the vegetation growing season. This trend is consistent with observed decrease in the precipitation duration during the growing season in KY, particularly from July to September. In conclusion, AMSR-E soil moisture data are capable of detecting the spatial and temporal variability in soil moisture for KY biomes. Evaluating satellite soil moisture products is important for improving our understanding of the spatial variability in vegetation carbon and water cycles.
Soil moisture plays a key role in controlling the exchange of carbon, water, and energy fluxes between the land surface and atmosphere in local, regional and global scales. It is an important term for accurate prediction of runoff, infiltration, drainage, soil evaporation and other important variables [1]. It thus affects near-surface climate by changing soil property such as albedo, soil thermal capacity. Soil moisture plays an important role in constraining plant respiration, transpiration, and photosynthesis in many regions of the world [2]. Also, soil moisture is involved in a number of feedback at different spatial scales and plays a major role in climate change projections [3]. For instance, it is found that up to 40% of the heat wave anomalies can be explained by interannual and seasonal variability of soil moisture because of the significant effect of soil moisture on air temperature [4].
Although soil moisture plays an important role in weather, climate and ecosystem functions, there is a lack in adequate longterm observations of soil moisture which represent challenges to the efforts to accurately predict soil moisture. Soil moisture measurement have been taken using field samples and more recently using soil moisture sensors, but are labor intensive and offer limited spatial variability. Thus, such point-based observation does not represent the high variability in soil moisture both temporally and spatially and are insufficient for regional or global analysis of soil moisture. Meanwhile, satellite imagery is an important tool for soil moisture studies because it’s continuous spatial and temporal coverage. Several studies have used remote sensing derived surface temperature and reflectance indices to estimate soil moisture [5,6]. The validation of such techniques with ground measurements is important for improving remote sensing soil moisture retrieval.
Since the lunch of the Advanced Microwave Scanning Radiometer (AMSR-E), global soil moisture data are available at a 25km spatial resolution. Soil moisture from AMSR-E is calibrated and validated at different sites. Good agreement is found between AMSR-E soil moisture and ground data at different sites ranging from natural vegetation to crops [7-10]. This consistent level of agreement between AMSR-E soil moisture with ground observation over a range of meteorological and surface conditions, offers a promise for application of AMSR-E soil moisture data to areas with different environmental conditions. The primary objective of the paper is to investigate the spatial and temporal variability in remote sensing soil moisture for the State of Kentucky. In particular, the spatial pattern of soil moisture during the vegetation growing season and it’s relation to vegetation type is explored. The strategy is to compare and analyze any observed trends in satellite soil moisture estimates for different Kentucky biome types. The goal of this paper is to evaluate the trends in Kentucky soil moisture and whether these trends have possible link to climate change. To answer these questions, the growing season soil moisture for 10 years are analyzed.
Daily soil moisture data from the Advanced Microwave and Scanning Radiometer (AMSR-E) are downloaded for the state of Kentucky from the National Snow and Ice Data Center achieve center for year 2003-2011 [11-14]. Moderate Resolution Imagining Spectroradiometer (MODIS) combined Aqua and Terra land cover data (MCD12) are downloaded for years 2004-2011from Earth Explorer. Land cover data are used to subgroup the AMSR-E data for the major Kentucky biomes: Forest, cropland, and mixed forest/ crop. All land cover classes designated as forest (e.g. evergreen, deciduous) are combined to create a new lad cover class named “forest”. Since MODIS combined land cover data are available starting year 2004, land cover data for year 2004 is used to extract Kentucky biomes for AMSR-E 2003. All satellite images are mosaic and subset to the State of Kentucky borderline. Image processing is done in Erdas Imagine (Hexagon geospatial) and statistical analysis and plotting are done in R (R statistical group).
Daily AMSR-E data are averaged to obtain monthly soil moisture for years 2003-2011. Then to generate a growing season average soil moisture, the monthly soil moisture data are averaged to produce 9 years averages for January-February-March (Jan-Feb- Mar), April-May-June (Apr-May-Jun), July-August-September (Jul- Aug-Sep), and October-November-December (Oct-Nov-Dec).
The spatial variability in AMSR-E soil moisture is illustrated in (Figure 1) Lower soil moisture in Appalachian Kentucky can be related to errors in AMSR-E algorithm/retrieval due to elevation and surface terrain resulting in fewer collected data by AMSR-E. Otherwise, the spatial variability in soil moisture tracks the seasonal variability in precipitation. It is not clear how the spatial variability of AMSR-E soil moisture is related to vegetation types, but still some pattern can be detected. For example, low soil moisture increases in Western Kentucky (dominated by agricultural fields) from January to September and then decreases afterword.
Figure 1: Spatial variability of 10 years average AMSR-E soil moisture in Kentucky.
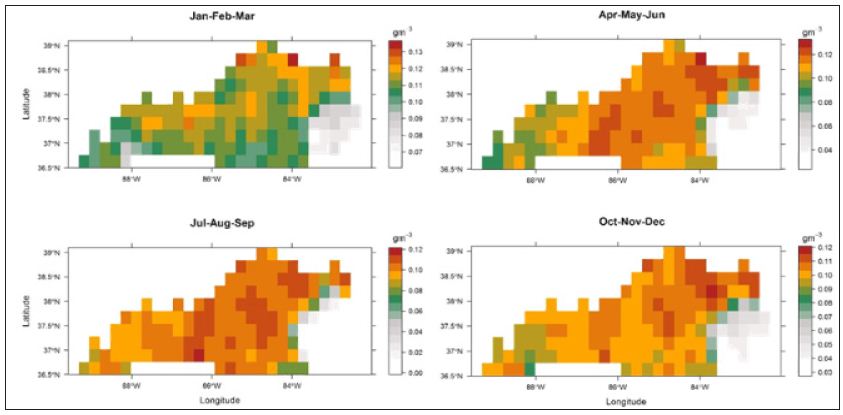
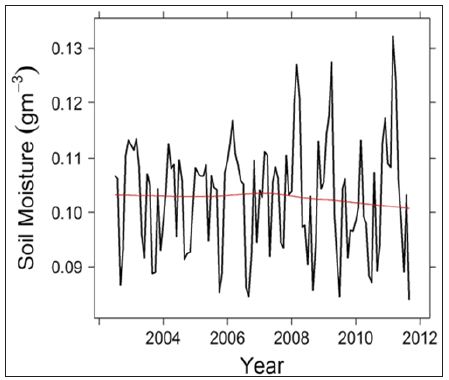
This can be related to irrigation that is used during the crop growing season and ceases before harvest, which is typically around September/October depending on the crop type. It is important to remember that AMSR-E soil moisture is for the top 1cm of the soil that is highly correlated with precipitation amount and variability. Temporal variability in soil moisture reflects the temporal variability in precipitation with higher soil moisture during the winter and spring seasons and lower during the summer season (Figure 2). AMSR-E data shows a decreasing trend in Kentucky soil moisture after year 2009 which can be related to decrease in precipitation. What is driving this decrease in soil moisture? Is it changes in winter, spring, or summer precipitation? To answer this question, the growing season soil moisture (April-September) is averaged for each of the 10 years (data not shown).
Figure 2: Time series of AMSR-E soil moisture for years 2002-2011.
Analysis reveals that the apparent decreasing trend in Kentucky soil moisture during the vegetation growing season is due to a decrease in July-September AMRS-E soil moisture (Figure 3). This decreasing trend is consistent with observed decrease in the precipitation duration (not intensity) during the growing season in Kentucky, particularly from July to September. Since the shift in precipitation is toward higher rates in shorter time period, runoff is increasing leading to a decrease in water infiltration and thus soil moisture. Soil moisture is higher in crops compared to forest ecosystems by about 20% (Figure 4). The seasonal variability in forest soil moisture is similar thought out the study nine years period. Higher soil moisture is detected by AMSR-E during the dormant season for forest ecosystem (Figure 4).
Figure 3: Time series of average AMSR-E soil moisture for the months of July-September.
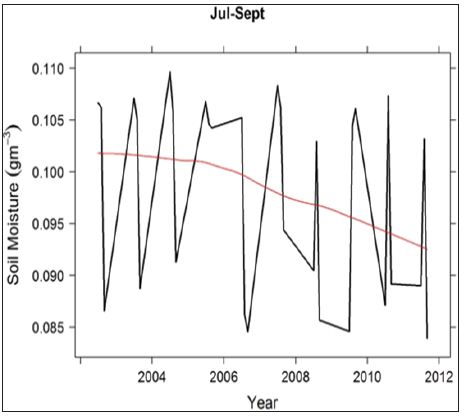
Figure 4: Time series of AMSR -E soil moisture for forest (top), crop (middle) and mixed crop/forest (bottom) biomes in Kentucky.
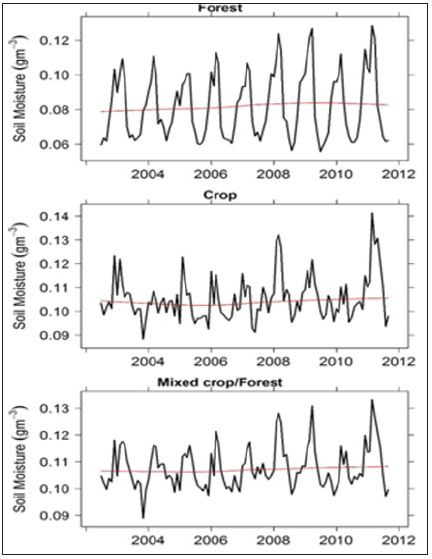
Whereas, lower soil moisture can be detected during the vegetation growing season reflecting the use of soil water by plants for transpiration. Also, water interception by leaves can impact soil moisture by decreasing the amount of precipitation reaching the forest floor. Crop soil moisture does not show a distinct seasonality most probably due to human activities such as irrigation (Figure 4). For the mixed crop/forest, the soil moisture signal resemble more the crop soil moisture in that there is no apparent seasonal cycle in soil moisture estimates (Figure 4). Nevertheless, AMSR-E soil moisture data are capable of detecting the temporal variability in soil moisture for the major Kentucky biomes.
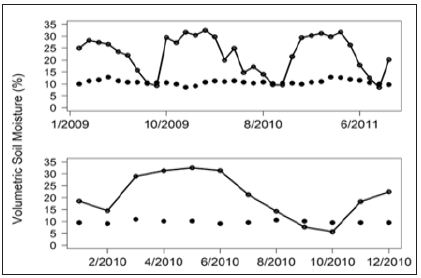
To check the ability of AMSR-E soil moisture data to capture the variability in soil moisture, two sites in Kentucky (agricultural and forest sites) are used and compared to AMSR-E soil moisture data. Results show that AMSR-E soil moisture underestimated observed soil moisture and show better agreement for the months of July to September (Figure 5). AMSR-E soil moisture is able to capture soil moisture during the dry period for both sites (Figure 5). To a great extent, the trend is represented by AMSR-E not the actual values. The lower variability in AMSR-E soil moisture compared to site data is likely the results of different measurement depth (~1cm for AMSR-E vs 5cm for site data). Lower moisture is expected in the top 1cm of the soil as it dries quicker due to evaporation and infiltration compared to 5cm soil depth. Another reason for this difference is the coarse resolution of AMSR-E (25km), where the variability in soil moisture due to texture, vegetation cover, and topography are not well captured by AMSR-E. It is important to note that soil moisture varies at very fine spatial scale that can be captured at the site level, but are harder to detect using satellite signal that represents the average of heterogeneous areas (mixed of different land cover types, topography, soil type, etc.)
Figure 5: Field soil moisture measurement at 5cm depth (connected dots) for Mammoth Cave (top) for years 2009- 2011 and Princeton field station (bottom) for year 2010. Piont data represent AMSR-E soil moisture.
This work presents the capability of remote sensing to capture the spatial and temporal variability in soil moisture and its relation with vegetation types in Kentucky. AMSR-E soil moisture data are capable of detecting the spatial and temporal variability in soil moisture for Kentucky biomes. The temporal variability in soil moisture for forest ecosystems reflect the continuous drying during the growing season. This is more apparent toward the end of the growing season due to decrease in precipitation amounts. The nine years data revealed a decrease in soil moisture, but continuous availability of satellite soil moisture is needed before such a trend can be significantly related to climate change. Evaluating satellite soil moisture products is important for improving our understanding of the spatial variability in vegetation carbon and water cycles.


