info@biomedres.us
+1 (502) 904-2126
One Westbrook Corporate Center, Suite 300, Westchester, IL 60154, USA
Site Map

Received: March 12, 2018; Published: March 29, 2018
*Corresponding author: Ioannis Mamarelis, Department of Cardiology, NIMTS Veterans Army Hospital of Athens, Greece
DOI: 10.26717/BJSTR.2018.03.000901
In the present study, FT-IR spectra were used to study the carotid arteries of 20 diabetic patients. From the comparison of infrared spectra between insulin-dependent (type II) diabetic patients or diabetics on oral hypoglycemic drug treatment with the corresponding patient spectra having normal blood glucose levels, it was found that insulin-dependent(type II) diabetic patients showed more pronounced changes throughout the absorption spectrum range (4000-800 cm-1). Particularly, the observed increase of the intensities of the stretching vibration bands of ethylene (vCH2) groups indicated that the lipophilic environment of the membranes is significantly altered. This conclusion is attributed to the increase in the destructive effect of free radicals produced during oxidative stress in diabetics. Also from the shifts of the amide I and amide II absorption bands to lower frequencies it is concluded that the secondary structure of proteins has been changed from a-helix to β-sheet and random coil. The most significant changes were observed in the area where the C-O-C groups of sugars and C-O-P-O sugar-phosphate groups of DNA and phospholipids absorb as a result of the disease.
Keywords: Oxidative Damage; Atherosclerosis; Diabetes, Infrared Spectroscopy, SEM
It is well documented that the elevated glucose levels in serum causes significant pathological changes and increases the morbidity and mortality [1,2]. It is estimated that it affects about 6.1% of the population in Greece [3]. Diabetes is associated with a number of secondary implications, such as heart attack and stroke. There are many risk factors that promote diabetes development, which include metabolic syndrome, hypercholesterolemia and obesity. Histopathologically the type II diabetes is characterized by the fibril amyloidal formation in the islet of Langerhans, but the mechanism and the role of armloads in the cell's membrane is not yet well understood. Up to now, blood glucose control methods do not provide direct neither indirect information about diabetes' role in atherogenesis at the molecular level. On the other hand, atherosclerosis is a complex phenomenon of plaque formation in carotid and coronary arteries [4,5].The biochemical changes that take place metabolically in lipids, generate an athermanous plaque that thickens the lumen and decreases the blood flow, while the chemical components of the plaque could induce atheroembolic events [5-8]. The risk factors that influence achromatic generation include hypertension, hypercholesterolemia, diabetes, smoking and oxidative stress.
The oxidative stress is characterized and identified mostly from the end-products and the involvement of oxygen molecules (O2) and its free radical anion (O2-*) at the final steps of free radical reactions, as well as at the electron transfer reactions. The free radicals are continuously produced endogenously in the living cells from metabolites, while external factors, such as cosmic rays, medical diagnostic techniques, and xenobiotics lead also to free radical production [2,9-15]. Free radicals because of the presence of non-paired electrons are very reactive species and they have the tendency to give or attract electrons in order to pair them and be stabilized.
In all cases, it is necessary to have excess of electron transfer reactions which activate the oxygen molecules, as electron acceptors, and accumulation of damaged products to induce pathological effects [11-14]. In the last decade Fourier transform infrared (FT- IR) spectroscopy has shown that it is a powerful technique [9-14]. Easy-to-use and non-destructive, that could be used to evaluate the complicated systems of human tissues and cells, by studying the vibration modes of the functional groups (NH2, -NH-CO-, -COOH, OH, etc.) [9-14]. In the FT-IR spectra there are several bands, which are useful and informative on the structural changes that take place in the tissues upon metabolism. Each band is characteristic and appears at the same characteristic wave numbers (cm-1). The exact position of the bands depends on electron-withdrawing or donating effects of the intra- and inter-molecular environment in which the molecules are vibrating.
This sensitivity of IR spectroscopy gives us the ability to gain information, at a molecular level, which is associated with certain diseases. The spectral analysis of the absorption bands of carotid arteries give the characteristic "fingerprint" bands or signature bands of the tissues of the patient. In the present work the mid-FT- IR spectroscopy is used to study the spectra and the development of achromatic plaque of carotid arteries in patients who underwent carotid end arterectomy. In addition, SEM (Scanning Electron Microscopy) also a non-destructive method was used to study the composition and architecture of the membrane and foam cell of carotid and the metals present in the carotid of the patients.
Biopsies were obtained from 53-85 years old patients, who underwent carotid artery carotid artery endarterectomy. Representative sections of the biopsies were restored in formalin and histological evaluation showed normal thermo, with no evidence of metabolic or inflammatory disease. The specimens were fixed in buffered formaldehyde solution immediately after the excision and the blood was removed by using H2O2 and acetone. The samples were taken after the surgery of the patients according to the Greek ethical rules and the permission of the Hospital and the University.
FT-IR absorption spectra were recorded on a Nicolet 6700 spectrophotometer, equipped with an ATR (attenuated total reflection) accessory. In this case IR light passes through a Zn-Se crystal and after multiplication of the internal reflections on the sample the beam is collected by a detector and is transformed to spectrum. The diamond increases the ratio of signal to noise and thus minimizes the size of the sample. Furthermore, by using the ATR apparatus the samples are not homogenized and this allowed us to obtain spectra from different parts of the carotid artery samples of each patient. The advantage of ATR-FTIR technique is that the spectra give simultaneously information about all the components of the biopsies each spectrum consisted of 120 coadded spectra at a spectral resolution of 4 cm-1 and the OMNIC 7.2a software was used for data analysis.
Scanning electron microscope from Fei Co, The Netherlands, was used for the detection of aortic valve surface architecture. SEM was combined with Energy Dispersive X-Ray (EDX) apparatus for the chemical elemental composition analysis in different sites of the aortic valves and tissues. It must be noticed that there was not any coating of the samples with carbon or gold (Figure 1).
Figure 1: FT-IR spectra of carotid biopsies obtained from patients on insulin treatment patients
a. Patients on oral hypoglycemic drugs treatment and
b. Normal concentrations of glucose in serum. Spectral region 4000-800 cm-1.

In Figure 1 are shown representative FT-IR spectra of carotid arteries obtained from insuin-dependent (type II) diabetic patients
a) Diabetics on oral hypoglycemic drug treatment
b) And with normal glucose levels
c) In serum. Comparison between the spectra of the patients shows that some of the spectral regions have the same pattern, while in other regions are shown considerable differences in band absorption intensity, bandwidths, frequency shifts, as well as appearance of new bands in all infrared spectral regions from 4,000-700 cm'1.
In this region are located the stretching vibration bands of vOH, vNH, vCH3, vCH2 groups from water molecules, glucose, proteins, lipids, DNA and other biological molecules. The shoulder band observed at 3394 cm-1 is assigned to vOH vibration modes of water molecules and polysaccharides [7-15]. This band decreases from insulin-dependent (type II) diabetic patients to normal glucose in serum patients. The high intensity band at 3290 cm-1 arises from the stretching vibration of v NH groups of proteins. This band shows intensity changes. The band intensity is higher in the spectra of insulin-dependent (type II) diabetic patients following the spectra of diabetics on oral hypoglycemic drug treatment. The observed shifting to lower frequencies is related to lipid-protein interactions.
The band at 3082 cm-1 arises from the carbon hydrogen bond stretching vibrations of the fatty acids and is assigned to stretching vibration of the olefinic v=C-H carbon hydrogen bond. This particular band could be used as diagnostic band to evaluate the per oxidation of lipids, since it was observed that its intensity was following the LDL (Low Density Lipoprotein) concentration levels of the patients [7-9]. Significant variations are also observed in the region of 3000 cm-1to 2850 cm-1frequencies, which arise from stretching vibrations of carbon-hydrogen bond (v C-H)of lipids and phospholipids, which are assigned to the antisymmetric and symmetric vibrations of vCH3 and vCH2 groups [7-15]. The significant higher intensity of these bands in foam carotid cells indicates that the environment became more ordered.
This region is also influenced by the clinical characteristics of each patient and was significant for patients with diabetes and hyper uricemia. Considerable intensity increases of the antisymmetric and symmetric stretching vibration bands of vCH2at 2924 cm-1 and 2850 cm-1, respectively, in insulin-dependent (type II) diabetic patients. The shift of the band from 2853 cm-1 to lower wave numbers at 2850 cm-1 indicates that the membrane became ordered [15-19]. This shift of the band 2853 cm-1 to lower wave numbers at 2850 cm-1 was also related to LDL concentration, indicating that cholesterol influenced the packing of the membrane acryl chains to the increase of order
The spectral region 1800-700 cm1 contains information about the secondary structure of proteins. The band at 1736 cm-1 is attributed to lipid ester carbonyl (vROC=O) stretching vibration and -COOH of the atherogenic plaque. This band appears at higher frequencies (up to 1744 cm-1) upon oxidative stress and aldehyde production [1,6-8,20-22].This particular band is also associated with LDL cholesterol concentration and is an indication that oxidative stress is a pathway of lipid per oxidation during atheromatic plaque formation. The amide I band which arises from stretching vC=O and bending 5NH vibrations of peptide bond (-NHCO-), shifts from 1650 cm-1 to 1630 cm-1. The amide II band, which arises from vC-N vibration shifts from 1550 cm-1 to 1540 cm-1. Upon the shifting of these bands to lower frequencies, it is suggested that the proteins change their secondary structure from a-helix to random coil due to breaking of the hydrogen bonds, which hold the protein helices.
The infrared spectra showed two minor bands at 1690 cm-1 and at 1620 cm-1, which are attributed to apo-B100 of LDL. It is known that LDL contains only apo-B100 as apolipoproteins and is characterized from their p-strands. Indeed, the insulin-dependent (type II) diabetic patients showed in their carotid FT-IR spectrum greater changes due to several eliminations of proteins [23]. These bands are associated with the increase ofthe lipophilic environment, which is in agreement with the absorption bands observed in the region 2900-2850 cm-1. The band at 1465 cm-1, which is assigned to CH2 scissoring vibrations of lipids, becomes broader and in the insulin-dependent (type II) diabetic patients splits in two. Fourier self de convolution of this band showed two peaks at 1473 cm-1 and 1447 cm-1. From this pattern and the band at 1473 cm-1, it is suggested that the lipid acyl chains are in TTan’s configuration and that the lipophilic interactions lead to order structure.
This finding is in agreement with the increase of the intensity of the methylene stretching vibration band observed in the region 3000-2850 cm-1. Upon deputation, these bands shift slightly to lower frequencies, as a result of the hydrogen bonding forces between proteins and the lipophilic environment. The absorption bands at the region 1300-1000 cm-1 match the spectral patterns that arise from amide III, -C-O-C- of sugars, vC-O-P-O of sugar phosphate modes and vPO2- in phosphodiester groups of the phospholipids and DNA (Figure 2). This region could be characterized as the "fingerprint" of sugar molecules. Considerable changes are shown in the shape and. Intensity of absorption bands in both insulin- dependent (type II) diabetic patients and on oral hypoglycemic drug treatment diabetics, compared to patients with normal blood glucose levels. The band at about 1165 cm-1 shifts to higher frequencies at 1170 cm-1in insulin-dependent (type II) diabetic patients.
Figure 2: FT-IR Spectra of carotid Biopsies obtained from Patients on Insulin Treatment Patients.
a.Patients on oral hypoglycemic drugs treatment and
b. Normal Concentrations of Glucose in Serum. Spectral Region 1180-1000 cm-1.

The band at 1170 cm-1 originates from Glycosylation of membranes and was also observed in cancerous tissues [14,24,25]. The band at 1044 cm-1 is lesser extent in the diabetic patient, who is on oral hypoglycemic drug treatment compared to the patient with normal blood glucose level. This band arises from oxidative degradation products of hyaluronic acid of the connected tissues of carotid membrane [5,26]. Therefore, the bands at 1170 cm-1 and 1044 cm-1 could are an indicator of the "injury" insulin-dependent (type II) diabetic patient suffered and could be used to predict possible arterial lesions due to the disease (Figure 3). Shows the SEM analysis. Of the surface architecture of carotid artery, in foam cells' region. It is observed that the region is highly heterogeneous and rich in fibrils and mineral deposits. These findings confirm the amyloidal protein formation as it was suggested by FT-IR analysis. By using SEM-EDX analyzer, heavy metal ion deposition was detected in some patients, such as copper (Cu), lead (Ld), silver (Ag), titanium (Ti), because of their professional occupation and their medical history of metallic implants.
Figure 3: SEM Analysis of Surface Architecture of CArotidartery. Mag 100, scale 500 μm.

It has been established that in humans during metabolism or oxidative stress, free radicals are produced, which dysregulate many important biological pathways leading to disease development and even death. [2,11].The H2O2 molecules are intermediate products in the catalytic cycle of oxidation of cytochromes according to Eqtn 1[15].

The hydrogen peroxide molecules which are formed could react with the bivalent iron cations (Fe 2+) of the hemoproteins or with copper cations (Cu2+) from copper proteins, as well as with toxic bivalent metal ions of transition metals, e.g. Co2+, Ni2+, Cr2+ producing hydroxyl free radicals (HO.) according to the following Fenton’s or Haber-Weiss [Eqtn 2] like reactions

The produced from the Eqtn 2 hydroxyl free radicals (HO.) can react with lipid acyl chains by subtraction of a hydrogen atom, leading to acyl chain free radical:
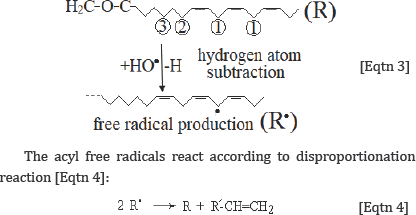
Through this reaction, the initial molecule (lipid) is reproduced together with one more molecules containing one less hydrogen atom, leading to the generation of one terminal double bond. The reaction [Eqtn 4] explains very well the increasing of the intensity of the band at 3082 cm-1, which is assigned to the v=C-H terminal (olefinic) group. Since aerobic conditions predominate in humans, the oxygen (O2), which is a double free radical (.O=O.) reacts rapidly with the above formed radical to generate a lipid hydroperoxyl radical:
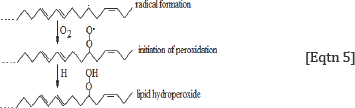
The formed proxy radicals, (C-O-O.), take up very fast mobile hydrogen atoms from compounds (donors) of the environment, such as adjacent lipids, thrills, etc. and can finally produce hydroperoxyl groups (-C-O-OH), which are non-ionic. Since aerobic conditions predominate in humans, the oxygen (O2), which is a double free radical (.O=O.) reacts rapidly with the above formed radical to generate a lipid hydroperoxyl radical:

This reaction also leads to the fixation of lipid damage, induced by hydrogen abstraction from hydroxyl free radicals [18]. Hydro peroxyl groups can also be produced by reaction of lipid radicals with hydro peroxyl radicals (HO2.) as follows [27].
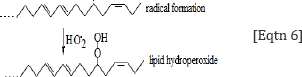
Reactions shown in Eqtn 5 and 6 explain the presence ofthe band near 1000 cm-1, which is assigned to -v-O-O- peroxyl stretching vibration. This finding allows us to suggest that the hydroxyl free radicals are required for the formation of lipid hydro peroxides and aldehydes according to the following general reaction [28]:
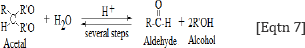
It is accepted that per oxidized lipids decompose easily, generating both free and core aldehydes, as well as ketenes that covalently modify ε-amino groups of lysine residues of the protein moiety [29-31].
Fourier self deconvolution and second derivative of the spectral region 1800-1500 cm-1, where the amide I and amide II absorb, showed new bands at about 1690 cm-1 and 1516 cm-1, which are attributed to anti parallel β-sheet and parallel β-sheet, respectively. These bands are related with amyloidal protein formation. This suggestion is also confirmed by the increase of lipophilic environment, which is also in agreement with SEM analysis. The elemental analysis of SEM indicated large amount of calcium and phosphorous in the areas of foam cells. It has been found that initiation of thermo formation takes place in this region and thus, it is expected to be a region which corresponds to achromatic plaque rich in phospholipases (Lp-PLA2). The enzyme Lp-PLA2, which is produced by inflammatory cells, hydrolyses oxidized phospholipids to lysophosphatydil choline most likely causes the atherogenesis [32].
The present study showed that infrared spectroscopy can be used to identify the damage of carotid arteries caused by oxidative stress. The increase of stretching vibrations of ethylene groups is related with the increase of lipophilic environment. The shifts of amide I and amide II bands to lower frequencies indicate the change of secondary protein structure, as well as the amyloidal protein and fibril formation. The characteristic absorption bands at 3070 and 1734 cm-1 are associated with LDL production and oxidative stress diagnostic bands. The bands at 1170 and 1044 cm-1 are characteristic in insulin-dependent (type II) diabetic patients. SEM-EDX analysis confirmed the fibril formation, while foam cells were the preferential site for metal.


