info@biomedres.us
+1 (502) 904-2126
One Westbrook Corporate Center, Suite 300, Westchester, IL 60154, USA
Site Map

Received: April 02, 2018; Published: April 13, 2018
*Corresponding author: F Acevedo, Department of Basic Sciences, Faculty of Medicine, Universidad de La, Scientific and Technological Bioresource Nucleus, Casilla 54-D, Temuco, Chile
DOI: 10.26717/BJSTR.2018.03.000962
Background: Gallbladder cancer is a highly lethal pathology, mainly due to late diagnosis and poor therapeutic alternatives. Epigallocatechin gallate (EGCG) has been reported as a cancer chemoprophylaxis, but its low stability and bioavailability limit its utility. The purpose of this study was to define the optimal process conditions by nano spray drying for EGCG microencapsulation using gum arabic and maltodextrin as a wall material and to test its chemopreventive action efficiency on gallbladder cancer cell lines (GB-d1).
Methods: For microcapsule production using a Buchi nanospray dryer, an experimental Taguchi design was applied using a L4(23) matrix. The effects of cytotoxicity and reactive oxygen species (ROS) production on GB-d1 cells in the presence of microencapsulated EGCG were assessed.
Results: A high EGCG loading efficiency (≥99%) obtained under optimal process conditions was the result. Microencapsulated EGCG triggered a considerable increase in cellular cytotoxicity compared with free EGCG; however, no statistically significant differences were found in ROS levels of microencapsulated and free EGCG (p≥0.05).
Conclusion: Based on these results, the microencapsulation technology enabled the successful encapsulation of EGCG, enhancing its antitumor effect on gallbladder cancer cells.
Keywords: Antitumor activity; Maltodextrin; Gum arabic; Encapsulation; Epigallocatechin gallate
Cancer is a major health problem; it is the primary cause of death, even over cardiovascular diseases [1] among digestive tract cancers, gallbladder cancer (GBC) is the most prevalent malignant tumor of the biliary tract. Worldwide, GBC incidence is relative low (2.2/100,000); however, in some geographic regions such as South America and Eastern Asia, incidence and mortality rates are a public health problem [1,2]. GBC is characterized by high mortality rates (1.7/100,000) due to its late diagnosis and therapy failure [3]. To date, a wide range of therapeutic agents have been developed to treat various cancers and GBC effectively. However, conventional chemotherapy has significant problems, including but not limited to non-selectivity between diseased and healthy cells, resulting in unwanted systemic toxicity, low drug stability to environmental and biological conditions, rapid drug metabolizing and low oral bioavailability [4]. In recent years, there has been a huge research effort to develop more effective forms of oral administration for anticancer drugs, using micro or nanoscale technologies of drug delivery to achieve site-specific release of chemotherapeutic agents by exploiting their physicochemical characteristics and biological attributes [5,6].
Micro or nanocarriers are used for drug protection, controlled release, increased specificity and bioavailability [7,8]. To this end, microcapsules produced by nanospray dryer have gained importance as vehicles for drug delivery applications owing to their ease of processing, ability to enhance drug stability and drug release behavior. Nanospray drying process conditions could significantly influence the physical characteristics of microcapsules. For this reason, the experimental design process should be used as a tool to identify the optimal processing parameters for reaching spray-dried therapeutic formulations with a high process yield and desired properties. Natural products have been a fertile source of bioactive compounds for the prevention and treatment of diseases caused by oxidative damage such as cancer. Polyphenolic compounds are known to be useful as nutritional or medicinal formulations for the treatment of several diseases [9].
Epidemiological studies showing an inverse association between increased green tea intake and relative risk for cancer suggest that green tea may be useful as a therapeutic agent for cancer [10]. Among polyphenols, catechins are compounds belonging to the flavonoid class and are potentially beneficial to human health. Epigallocatechin-gallate (EGCG) is the most abundant catechin in green tea and has been reported to be chemopreventive for many different cancers [11]. However, green tea catechins possess certain physicochemical limitations that hamper their use as a therapeutic agent. Catechins have very low oral bioavailability due to their poor absorption and rapid systemic elimination [12,13]. Also, another challenge with EGCG is that it tends to undergo oxidation, polymerization and epimerization reactions at alkaline pH and in the presence of oxygen and elevated temperature during processing [14]. Hence, its bioactive properties are not fully utilized and its applicability in clinical trials has met with limited success [15]. Improved stability could allow a more effective use of natural polyphenols as nutraceuticals and dietary supplements, thereby not only improving food safety, but also providing cancer therapeutic properties [11,16]. By encapsulating EGCG in suitable delivery systems, its bioavailability and the therapeutic efficiency could be enhanced. Furthermore, the purpose of this study was to define the processing parameters of the nanospray dryer for obtaining microcapsules of EGCG and to test its chemopreventive action efficiency on GBC cell lines (GB-d1).
Gum arabic (GA), maltodextrin (MD, dextrose equivalent 6.519.5) and epigallocatechin gallate (EGCG) were purchased from Sigma-Aldrich. Experimental design for microcapsule production using a Buchi nano spray dryer the encapsulation process was carried out in a B-90 nanospray dryer (Buchi, Switzerland) on a laboratory scale with different nozzle diameters (4 - 5.5 - 7 μm), encapsulating EGCG using GA and MD as wall materials. The solution (2% w/v) was fed into the main chamber through a peristaltic pump. Preliminary assays were performed to establish the process conditions: air input temperature (90 to 120°C), air flow (100 to 140 L/min) and nozzle diameter (5.5 μm). To optimize the EGCG encapsulation process, an experimental Taguchi design was applied using the criterion "smaller is better" and utilizing a L4(23) matrix with three independent variables: wall material GA/ MD ratio (Factor A, ratio 4:1 and 3:2), air input temperature (Factor B, 100 and 120°C) and air flow (Factor C, 120 and 140 L/min; Table 1). The microcapsule diameter (Yd) response was measured using scanning electron microscopy (SEM, Hitachi SU3500). Three images were used for each microcapsule sample and at least 20 different segments were randomly measured to obtain an average diameter. The average for the level of each factor and analyses ofvariance were calculated using Microsoft Excel 2013. The optimized theoretical equation (OTE) was determined considering the response averages with the greatest impact, identifying the most important factors and levels of work. Table 1 shows the orthogonal matrix and the orthogonal array used with the design factors.
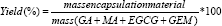
The yield was calculated for samples using the following equation (Eq. 1):
Analytical Method Validation for EGCG
The samples were filtered and analyzed using the HPLC-DAD system (Jasco PI-2089, Japan) with a C18 Hypersil ODS column (250 mm length x 4.6 mm ID, 5 μm particle size, Supelco). The flow rate was set at 0.7 mL/min. The mobile phase was HPLC grade water acidified with 0.5% v/v acetic acid (phase A) and methanol (phase B), both previously sonicated for 15 min. The detection was performed at 280 nm for EGCG. The elution gradient was as follows: 0-2 min, 95% A/5% B; 2-10 min, 50% A/50% B; 10-20 min, 30% A/70% B; 20-30 min 95% A/5%B. To validate the method, different analytical performance parameters such as linearity, sensitivity as limit of detection (LOD) and limit of quantification (LOQ), accuracy and precision were determined for EGCG.
Linearity
The linearity was analyzed in triplicate through standard EGCG curves ranging from 5 to 100 mg/L. Linearity was evaluated by linear regression, which was calculated by a least square regression analysis.
Sensitivity
LOD and LOQ for EGCG were determined using a calibration curve, considering the standard solution at low concentrations ranging from 0.5 to 5 mg/L. The LOD and LOQ were calculated using the following equation:
LOD = (3.3 * SD)/ S (Eq 2)
LOQ = (10 * SD) / S (Eq. 3),
Where SD is the standard deviation of the response, and S is the slope of the calibration curve.
Accuracy
The accuracy of an analytical method corresponds to the closeness of test results obtained by that method to the true value (USP-25-NF20, 2002). The accuracy of the method was determined by analyzing five solutions at different concentrations. The percent recovery was calculated by comparing peak areas of the resultant solutions with reference standard solutions at the same concentration.
Precision
Precision is related to the degree of agreement between individual tests when the method is applied multiple times on the same sample. The precision is expressed as the coefficient of variation (CV), where Xm corresponds to the average and SD to the standard deviation (Eq. 4).
cv = ( sd *100) / xm (Eq. 4)
Loading efficiency of EGCG
The loading efficiency was determined according to Rocha et al. (2011). Five mg of microparticles were washed with 1 mL of methanol and then centrifuged at 14,000 g for 10 minutes. The supernatant was filtered and analyzed by HPLC-DAD (Jasco PI- 2089, Japan). The pellet was re-suspended in 1 mL of water grade HPLC and then also measured by HPLC-DAD. The sum of the non encapsulated fraction (in methanol phase) and the encapsulated fraction (in aqueous phase) corresponded to 100% of the EGCG concentration, respectively.
Scanning Electron Microscopy (SEM): The size and morphology of microparticles were determined using SEM (Hitachi SU3500) at 5.0 kV and 90 Pa.
Cumulative Distribution of Particle Size: A laser diffraction particle size analyzer (Shimadzu, SALD - 3101) was used to determine the cumulative distribution and average particle size. Microcapsules (0.1 g) were suspended in 10 mL of hexane in a quartz cuvette for reading. This analysis was carried out in duplicate and the average particle diameter and standard deviation were determined using Eq. 5 and Eq. 6:
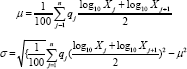
Where μ: population mean; a: standard deviation; x.: diameter particle (μm); q.: differential % (differential distribution). Cell viability assay of free and microencapsulated EGCG
Free EGCG Solutions: A stock solution at 20 mg/mL was prepared for EGCG (Sigma-Aldrich). Each stock solution was dissolved in DNase-free water (IDT Technologies).
Microencapsulated EGCG
Microcapsules of EGCG were diluted in 2.5 mL of RPMI 1640 culture media (Corning) to a final concentration of 1000 μM. From this solution, several dilutions were prepared at concentrations ranging from 0.001 μM to 200 μM.
Cell Culture
Human gallbladder cancer cell line GB-d1 was provided by Dr. Anirban Maitra (Johns Hopkins University, Baltimore, USA). This cell line was established from a poorly differentiated adenocarcinoma of the gallbladder, obtained from a metastatic lymph node of a 54-year- old man in Japan [17]. GB-d1 was cultured in RPMI 1640 medium supplemented with 10% (v/v) fetal bovine serum (HyClone) and 1% (v/v) penicillin and streptomycin (HyClone). Cells were maintained at 37°C in 95% humidified atmosphere and 5% CO2. Flasks were sub cultured when they were 80-90% confluent. Five- minute exposure to 0.25% trypsin-EDTA (CORNING) was used to release attached cells from the tissue culture surface. All cell line experiments were performed in biological and technical triplicates for each condition.
In Vitro Cytotoxicity Assay Cytotoxicity of free and microencapsulated EGCG was assessed by standard MTS assay. Briefly, cells were seeded in 96-well plates at a concentration of 2500 cells/well in 100 μL of media culture and incubated for 24 h to enable cell attachment. Cells were exposed to different concentrations of free and microencapsulated EGCG ranging from 0.001 μM to 200 μM for 72 h. Cells treated with microcapsules without EGCG were used as the control. At the designated times, the medium was removed, and cells were washed with 100 μL of DPBS/Modified (HyClone). Finally, 20 μL of MTS (Cell Titer 96® Aqueous Assay Kit, Promega) was added to each well in the plate and incubated for 1 h. The absorbance at 490 nm was measured using a micro plate reader (Photo micro plate absorbance reader, Autogiro).
EC50 values were calculated after 72 h of incubation under different concentrations of free and microencapsulated EGCG. The EC50 values were plotted against the logarithmic concentration for the dose-response curve. Dose-response curves and EC50 values were calculated by nonlinear regression, using GraphPad PRISM® 5.0 software. The two-way ANOVA with a Bonferroni post-test was used to compare groups. P values ≤ 0.05 were considered statistically significant. ROS production in the presence of free and microencapsulated EGCG Reactive oxygen species (ROS) levels were detected by flow cytometry using a CM-H2DCFDA probe (Life Technologies). Briefly, 18,000 cells per well were seeded in a total volume of 500 μL medium in 24-well plates and incubated for 24 h at 37°C in an atmosphere humidified with 5% CO2. Then, cells were exposed to 61.44 μM of free and microencapsulated EGCG for 72 H. Cells treated with H2O2 were used as a positive control of ROS production. After the treatment period, cells were washed with DPBS/Modified and incubated with 300 μL of a general oxidative stress indicator (CM-H2DCFDA 1 μ M) at 37°C for 40 minutes. Finally, cells were harvested by trypsinization and after washing cells were re-suspended in DPBS/Modified and collected for analysis by flow cytometry (FACSCANTO II, BD). The fluorescence was read at maximum excitation/emission 495/527 nm. ROS levels were analyzed using GraphPad PRISM® 5.0 software. Kruskal- Wallis followed by Dunn's post-test were used to compare groups. P values μ0.05 were considered statistically significant.
Experimental design for microcapsule production using a Buchi nanospray dryer In order to obtain an effective EGCG microencapsulation by spray drying, higher proportions of GA in the polymeric mixture were tested. In fact, a GA/MD ratio of 3/2 and 4/1 were selected for the Taguchi experimental design. The viscosities of these polysaccharide solutions were 1.67 ± 0.02 and 1. 79 ± 0.03 cP at 20°C, respectively. These viscosity values (< 2 cP) were adequate for the optimal operation of the microencapsulation process. The particle size average determined by SEM varied between 1.7 and 2.1 μm (Table 1). The magnitude of average difference by variables and working levels influenced the particle size (Table 2); as a result, the greater the difference, the greater the influence of variables on the particle size. It was then possible to identify the working level for the best results. The air flow showed a major difference of 0.2 units between the response of working level 2 and working level 1 than the inlet temperature and GA/MD ratio with a difference of 0.15 and 0.13 units, respectively, between the working levels. Figure 1 shows the degree of inclination of the slope as response: the greater the difference between level 1 and level 2 for a variable, the more marked the change in the magnitude of response. Therefore, air flow (factor C) presented the highest slope compared to variables A and B. Consequently, the more restricted the air flow, the smaller the particle size.
Figure 1: Analysis of main effects of variables on particle size.

Table 1: Microcapsule size using the orthogonal array L4(23).

Table 2: Levels selected as "larger is better" in the results obtained for the particle size response using a nano spray dryer.

An analysis of variance (ANOVA) was performed to determine the degree of influence or contribution of variables in the response. The Fexp values were 17.12, 22.82 and 40.02, respectively. The ANOVA demonstrated that the determination coefficients (R2) for the variables A, B and C were 20.4, 27.2 and 47.7%, respectively, of which C was the most significant factor (p ≤ 0.05). The contribution of factors A and B together was 46.6% of the response, which was significant (p ≤ 0.05); however, separately these factors had no significant effect (p > 0.05). The determination coefficient for these three variables was significant (p ≤ 0.05) with R2=95.2%, indicating a high association of control factors with the response of particle size.
The optimized theoretical equation (OTE) for particle size was determined by Eq. 6 considering the three variables:
OTE = T + (A1 - T) + (B2 - T) + (C 1- T) (Eq. 6)
Where T = 1.8 is the total average of responses of experimental runs, A, B and C are the variables and sub-indices 1 and 2 corresponding to working levels 1 and 2. The OTE obtained for the particle size was 1.62 μm.
Furthermore, the optimal process conditions for a small particle size (1.7 ± 0.06 μm) were GA/MD ratio 4/1, air input temperature 120°C and air flow 120 L/min. Under these conditions, a high yield (88.43 ± 3.91%) was obtained for the formulation of microcapsules.
Linearity was demonstrated based on the calibration curves with an R value of 0.9998. LOD and LOQ values were 0.570 mg/L and 1.438 mg/L, respectively. Recovery ranges (> 97%) indicate that the method presented a satisfactory accuracy. The method is considered precise, showing a CV value of 3.5%, a value within the 5% acceptance range.
This study demonstrated that the experimental Taguchi design was useful for selecting the best conditions to successfully encapsulate EGCG at lab-scale using a spray drying apparatus aimed at achieving high loading efficiency (99%).
Microcapsule morphology: Microcapsules obtained under optimal conditions showed mostly a spherical shape and others with surface indentation (Figure 2).
Figure 2: Scanning electron microscopy (SEM) of microcapsules.

Cumulative distribution of particle size: The cumulative distribution of particle size for 25% of the population was less than 500 nm. By contrast, particle diameters for 50% and 75% of the population were 2.72 and 4.61 μm, respectively. Some particle agglomeration (aggregation) was also observed due to physical bridges, thereby increasing the mean diameter of the particle size distribution.
Cell viability assay of free and microencapsulated EGCG For the in vitro cytotoxicity assay a GB-d1 cell line was used, a poorly differentiated Adenocarcinoma [17].
GB-d1 cells were treated with a concentration between 0.001 - 200 μM of free and microencapsulated EGCG. The effective doses (EC50) of free and microencapsulated EGCG were 61.44 μM and 10.88 μM, respectively. A two-way ANOVA followed by a Bonferroni post-test demonstrated a statistically significant difference in cell viability reduction by microencapsulated EGCG at 0.001 μM (p <0.01) and 0.01, 0.1, 1.0, 10 μM (p <0.001) (Figure 3). The inhibitory effect of microencapsulated EGCG and free EGCG was similar at 100 μM and 200 μM. On the other hand, microcapsules without EGCG (control) presented a negligible effect, thereby confirming the lack of toxicity of nanoparticles (data not shown).
Figure 3: Cell viability of free EGCG and microencapsulated EGCG on GB-d1 cell line.

ROS production in the presence of free and microencapsulated EGCG
ROS production of free and microencapsulated EGCG was evaluated at 61.44 |iM for each condition, corresponding to the effective dose of EGCG in GB-d1 cells. Cells without EGCG were used as a control. The flow cytometry analysis by CM-H2 DCFDA staining is shown in Figure 4. The dot plots showed similar fluorescence intensity in all treatments. The Kruskal-Wallis followed by Dunn's post-test demonstrated that there were no statistically significant differences in ROS levels of microencapsulated EGCG compared with free EGCG (p ≤ 0.05) in terms of the percentage of ROS positive cells (Figure 5).
Gallbladder cancer is a highly lethal neoplasia due to late diagnosis and deficiencies in treatment [3]. Nanoencapsulation of antineoplastic agents haves been shown to improve drug delivery and cell response, making it possible to reduce drug dosage and side effects [18]. In this study, the effect of free and microencapsulated EGCG on gallbladder cancer cells was proven in vitro in order to analyze the capacity of this green tea polyphenol to inhibit cancer cell growth in GBC [19]. The selection of an appropriate wall material is an important factor in the microencapsulation process of bioactive compounds, since it can affect the viscosity of the infeed emulsion [20,21]. In this study, GA and MD were selected as wall materials due to their low cost and good interaction, which improves their intermolecular bonding [22]. In spite of GA and MD having been previously tested for preserving EGCG, their use as a vehicle via a nanospray dryer under optimized conditions for reaching a possible increase in the chemotherapeutic action of EGCG after encapsulation has not yet been assessed.
Figure 4: Dot plots of ROS generation flow cytometry analysis by CM-H2 DCFDA staining on GB-dl cell line

Figure 5: ROS levels of free and microencapsulated EGCG on GB-d1 cell line. The ED used for the analysis was 61.44 μM for both free and microencapsulated EGCG.

GA has been used as a microencapsulation matrix due to its low viscosity, good emulsification and high stabilization, providing protection against oxidation [23-26]. By contrast, MA has proven to be an efficient stabilizer in the microencapsulation of vitamins, minerals, colorants, oils, among others, reducing the oxygen permeability of the wall matrix [27,28]. Previous results have indicated that the GA/MD matrix was optimal for the oil microencapsulation process by spray drying [29]. On the other hand, scientific evidence has already demonstrated that the polysaccharide GA/MD matrix constitutes a potential vehicle for preserving EGCG antioxidant properties and inhibiting the effects of the proliferative activity of prostate cancer [30,31]. Also [13,30] confirmed through NMR and ATR-IR analysis that EGCG molecules are incorporated into the GA/MD (2/3) matrix by intermolecular dipole-dipole interactions, maintaining EGCG chemical integrity after the spray-drying process.
The different morphologies observed in the resulting particles are dependent on their size and the properties of their polymeric shell in the final stages of the drying process [32,13] obtained spherical and corrugated particles with highly dented surfaces after the nanoencapsulation of EGCG using the GA/MD matrix as a wall material. Nunes [31] obtained EGCG microcapsules with structural differences between the particles, some particles with highly dented surfaces and other particle populations with a spherical shape and smooth surface free of visible cracks and pores. A particle agglomeration (aggregation) was also observed due to physical bridges as reported by [33], thereby increasing the mean diameter of the particle size distribution. For EGCG encapsulation by a pilot Niro spray dryer, Rocha et al. [32] reported two particle size populations with lower average diameters of about 30 and 200 nm.
EC50 of free EGCG was determined in GB-D1 cell line (61.44 μM). The EC50 obtained was similar to other reports, but in prostate cancer cells EC50 varied from 40 μM to 80 μM depending on the cell type and the exposure time [34]. The EC50 of EGCG microcapsules decreased considerably to 10.88 μM. This event demonstrated that EGCG encapsulation allowed a better incorporation of the compound to the gallbladder cancer cell, reducing the amount of EGCG necessary to inhibit cell proliferation. EGCG possesses great potential in cancer treatment and prevention; however, its low bioavailability, inappropriate systemic release and bioavailability have limited its therapeutic use [35]. In this study, we have demonstrated that EGCG microcapsules could be an appropriate method to deliver this compound. Another study tested in prostate cancer cells showed an antiproliferative action of nanoencapsulated EGCG at concentrations of 1-2 μM [32]. The anti-cancer activity of EGCG has been tested in several studies, where it has been shown that cell viability in the presence of this polyphenol is reduced due to apoptosis activation and proliferation inhibition [34].
Therefore, the activities could be increased by encapsulation, allowing the use of low doses of EGCG with better results than free EGCG, offering a therapeutic alternative in a highly lethal disease like gallbladder cancer. With respect to ROS production in gallbladder cancer cells treated with free and encapsulated EGCG, we found no statistical differences between the treatments. However, a slightly increasing trend of ROS production in cells treated with free EGCG can be noted compared with parental cells, and in cells treated with EGCG microcapsules compared with parental cells and free EGCG treatment, although the results are not statistically significant. EGCG has been documented as a compound involved in ROS production [34,36]. This contradictory evidence seems to depend on cell type and time of exposure to treatment [37]. Tao et al. (2014) studied the EGCG effect on oral carcinoma cell lines, finding that EGCG induces mitochondrial ROS in SCC-25 cells, but not in HGF-1 cells [37]. Another study using esophageal squamous carcinoma cells lines showed that EGCG induces ROS production in Eca-109 and Te-1 cells [38]. Wei et al. (2015) described an alteration of TRAIL-induced apoptosis in renal cell carcinoma cells due to the production of ROS after treatment with EGCG [39]. On the other hand, has at skin cells exposed to x-rays showed a reduction in the generation of radiation-induced intracellular ROS when they were previously treated with EGCG [40].
This study has demonstrated the importance of determining the EGCG activities in different types of cancer, both free and encapsulated, since EGCG action depends on cell type and encapsulation strategy. The use of an experimental Taguchi design as a tool to identify the critical factors of the spray-drying process is also an important step within encapsulation. The variable air flow was identified as the factor with the highest contribution to the particle size, while the GA/MD ratio and temperature were also significant variables together. The high yield of microparticles and the EGCG loading efficiency using low cost wall materials such as MD and GA are promising results for scaling up the process for pharmaceutical applications. Conversely, microencapsulated EGCG triggered a considerable increase in cellular cytotoxicity compared with free EGCG, providing an EC50 value 6-fold lower than free EGCG. Furthermore, these results clearly suggest that spray drying is a viable and rapid approach to producing EGCG microcapsules with high antitumor activity on gallbladder cancer cells. To date, this is the first study to measure ROS potential in microencapsulated EGCG on gallbladder cancer cell lines. However, based on viability results it seems that EGCG could be a therapeutic alternative for gallbladder cancer, which increased its action as EGCG microcapsules, reducing the concentrations needed to generate the same action. Future studies are needed to clarify the role of ROS production and cell cytotoxicity in gallbladder cancer therapy.
This work is funded by FONDECYT projects 11140127, 1150802 and 11150622.


