info@biomedres.us
+1 (502) 904-2126
One Westbrook Corporate Center, Suite 300, Westchester, IL 60154, USA
Site Map

Received: August 12,2018; Published: August 17,2018
*Corresponding author: Nguyen Thi Trang, Department of Biomedical and genetics, Hanoi Medical University, Viet Nam
DOI: 10.26717/BJSTR.2018.08.001603
Introduction: Fructose is formed in the seminal vesicle under the action of testosterone and is secreted along with the vas deferens during each ejaculation, so fructose is considered a biochemistry that faithfully reflects the function of these components. Fructose concentrations in normal semen confirm the role of testosterone and the function of normal seminal vesicles, without the phenomenon of obstruction.
Materials and Methods: The semen samples were obtained from 300 male partners of infertile couples who attended the Department Biomedical and Genetics of the Hanoi medical university and the semen samples were analyzed for the routine seminal parameters. Fructose concentration was assessed using spectrophotometry (improved ROE method).
Results: Optimal solution concentration of TCA is 10%. Composite color composition include 2,5 ml of HCL 30% and 0,25 ml of resorcinol 0,1%; Repeatability: CV% = 1, 407 % <5%; Intermediate precision: CV% = 2.032 % < 5%; Trueness: tex= 0,906 <tt = 2.262. Specificity was 98,9 % and 99,52 % sensitivity. Significant correlation between the two methods with r=0,990, p<0,001; average difference between the two methods is 0,0116 with equivalent is 2,078 % (p=0,035< 0,05).
Conclusion: Complete the manufacturing procedure of kit for determination of fructose concentration in seminal fluid.
keywords: Improved ROE Method; Male Infertility; Seminal Fructose; Spectrophotometric Method
Due to the various reasons caused male infertility, it is essential to identify appropriate diagnosis methods to detect them. Many tests have been applied for several decades such as semen analysis, genetic tests and hormones methods. Recently, some of biochemical markers including zinc and fructose are becoming significant implications for diagnosing the cause in male infertility [1]. They have thus been established as good indicators ofhuman male fertility An understanding of the factors affecting these characteristics is critical to proper understanding of the mechanisms underlying male infertility [2,3]. In 1945, Mann and al. identified fructose in the form of Methyl-Phenyl-Fructosazone [4]. Fructose is secreted from the seminal vesicles and the accessory sex glands under effect of testosterone, so seminal fructose could be used as a marker of the seminal vesicles function. Fructose is essential for spermatozoa metabolism and spermatozoa motility [5]. Fructose is an energy source for spermatozoa. It is produced by the seminal vesicles with some contribution from the ampulla of the ductus deferens [6,7]. Determination of seminal fructose concentration has been used in examination of obstructive azoospermia and inflammation of male accessory glands [8,9]. The role of fructose concentrations in seminal plasma for total and sperm density has been investigated by several authors.
Gonzales GF et al. reported that a negative correlation between seminal plasma fructose concentration and motile sperm concentration [10,11]. However, other studies have also shown that fructose concentrations in seminal plasma of patients with oligoz oospermia and azoospermia did not decrease as compared to normal men. According to the WHO 2010, low concentration of fructose in seminal plasma is characterized by vasospasm, splenomegaly, androgen deficiency, or upstream ejaculation [12,13]. Fructose in seminal plasma is reported to play important roles in sperm motility and concentration, particularly with regard to energy metabolism [14]. Many studies show that low levels of seminal fructose are positively correlated with low seminal volume, low sperm motility. In Vietnam, this test was be put into use in 2011 at the Viet Duc hospital and in 2013 at the Hanoi Medical University Hospital, and is increasingly popular in clinics. The need to use test kits to quantify fructose in semen is increasing. However, in Vietnam there are currently no units or establishments that produce this test. Therefore, all tests must be imported from abroad with many intermediate costs increasing the cost of the test many times.
WHO 2010 divided male infertility into 3 groups: normozoospermia (sperm concentration >=15 billion/ml), oligozoospermia (sperm concentration < 15 billion/ml) and azoospermia (no sperm) [15]. There are many studies determined seminal fructose and its correlations with concentration, vitality and motility of sperm. Azoospermia is the reason in 20% infertility man17 and the common reason of azoospermiais CBAVD [16].
Study subjects are semen samples of male patients who come for examination, counseling and testing semen at the Genetic counseling center and the Urology and Urology Clinic, Hanoi Medical University Hospital from June 2017 to March 2018. The participants of the study were asked to produce sperm by masturbation and collected in sterile container with period of 2-5 days of intercourse abstinence. Sperm should be analyzed within 2 hours after produced. Routine semen analysis was performed according to WHO 2010 guidelines.
Criteria for selecting subjects: semen samples from male patients of reproductive age from 18 to 50 years without acute illness and consent to participate in the study.
a) Men with genital cancers, HIV, syphilis, gonorrhea.
b) Men are suffering from acute illness, mental illness.
c) The person disagrees with the study.
The procedure for fructose quantitative testing in semen. The steps are as follows:
Semen sample is centrifuged at 1500 rpm for 10 minutes. This step is used to settle the sperm cell down to the bottom and only take the top of the semen containing the fructose for testing, as the sperm is not used in the test. Then give 100 μl of supernatant to 400 μl TCA 10%, mix well, centrifuge at 3000 rpm for 10 minutes. This step is used to remove the protein (after centrifugation, the protein will be precipitated, only recover the supernatant which fructose). Take 100 μl of supernatant to 2.5 ml of 30% HCl and 250 μl of 0.1% resorcinol in ethanol 95%. Incubate at 80 - 85°C for 5 minutes. After that, cool down and measure optical density (OD) at 530nm wavelength, 1cm curvature. For control, 100 μl of TCA 10% was substituted for semen. The color of the solution remained unchanged within 2 - 3 hours. Finally, determine the fructose content with coefficients built by the calibration function.
C fructose = E (OD) x C (h) / E (h)
E (OD) is the optical density of the fructose sample of the patient's semen at 530 nm.
C (h) is the fructose standard concentration in the calibration function.
E (h) is the optical density of the fructose standard in the calibration function.
C (h) / E (h) is the coefficient a constructed from the calibration function
Chemical components for the preparation of test kits including:
Trichloroacetic Acid (TCA) (CCl3COOH) 10%.
HCl 30% solusion
0.1% resorcinol solution in 950-stage ethanol by 0.1 g resorcinol in 100 ml ethanol 95°
Fructose standard.
Kit Fructose test (Fertilpro Belgium). To calculate the accuracy, we look at the following parameters:
Construction of calibration function: we are using a calibration function with thresholds of 0; 0.5; 1; 1.5; 2; 2.5; 3; 3.5 and 4 because fructose concentrations in the seminal fluid are normal from 1.3 to 4.0 g / l. Using the Ms- Excel 2013 software, construct the calibration equation y = ax and the correlation coefficient R. The accuracy include precision and trueness (the precision include repeatability, intermediate precision, reproducibility) To calculate the sample size to determine sensitivity, specificity and equivalence:
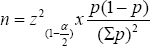
z(i-(α/2) : confidence factor (with 95% confidence, Z = 1.96).
According to Zahoor Ahmed and colleagues in 2010, the percentage of men with low fructose concentrations in the azoospermia and oligospermia groups was p = 25% [17]. s: is 0.2; n = 1.962 x 0.25 x (1 - 0.25): (0.2 x 0.25) 2 = 147, rounded to 150. We took the sample size of 300 to increase the accuracy. On the same sample of semen, we measured fructose concentrations twice methods: once with the IVD kit (Fructose test, Fertilpro company, Belgium) and once with the improving kit. The difference between the two methods was based on Pearson correlation, T-test and Bland- Altman plot.
The sensitivity and specificity are calculated according to the formula:
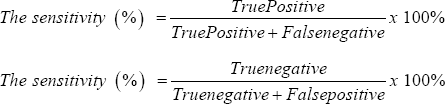
a) True negative mean the fructose concentration is below the normal level when testing with both kit.
b) False negative mean the level of fructose below the normal level when testing with the self-mixing kit and over with IVD kits.
c) True positive mean the fructose concentration is the normal level when testing with both kit.
d) False positive is the concentration of fructose in the normal range when tested with the self-mixing kit and below normal with IVD kits.
Statistical analysis was performed using SPSS version 16.0. The means were compared using student t test. The statistical tests were considered to be signifcant at the p < 0.05 level.
Ethical approval to conduct the study was sought from the Hanoi Medical University. Permission to use data from the Hanoi Medical University Hospital was sought from the hospital authority. All the information from the database was kept under strict confidentiality. No names were recorded.
We used TCA 10% to denature protein in semen. We tested 9 samples of fructose standard with TCA volumes of 0μL, 100μL, 200μL, 300μL, 400μL, 500μL. The results are as follows: (Table 1)
Table 1: Fructose concentration by volume TCA.

Comment: The fructose concentration at 400pL TCA of volume produces the most accurate result, so we choose this volume to denature the protein in semen.
We used the color indicator 250 μl resocinol 0.1% reacts with fructose in semen in strong acid medium (2.5 ml HCl 30%) and incubated for 5 minutes at 85°C to form a complex bright red. The intensity of the color mixture is proportional to the concentration of fructose in semen. Experiment with 9 samples of fructose standard concentration, OD density at 530nm wavelength of the color complex obtained at 0h, 1h, 2h, 3h, 4h, 5h we obtained the results shown in the following Table 2.
Table 2: OD of the color mixture measured at 530nm over time.

Comment: Color mixture with OD density are stable when measured in the range of 0 - 3h, measured after 3 h OD density tend to decrease will lead to distortion fructose concentration.
The calibration function is constructed with the standard fructose concentration threshold of 0; 0.5; 1; 1,5; 2; 2.5; 3; 3,5; 4 g / l, we measured the OD density corresponding to each standard fructose concentration threshold according to the completed test procedure and established the calibration curve as follows (Figure 1).
Figure 1: Calibration curve for fructose concentration according to OD at 530nm.
Comment: The calibration we have built in this study is y = 1.2797x with R = 0.99. Where y is the concentration of fructose in semen, x is the OD measured.

Table 2 Use the formula to calculate the intermediate precision, we obtained the standard deviation of SD = 0.051, so the coefficient of variation was CV% = 2.032%. The coefficient of variation lies within the CV% <5% limit. With the above results, we calculate the trueness has tex = 0.906. In addition, through the table look at tt = 2,262; tex < tt so we achieves testing standards.
Tables 3-5 Comparable equivalents between the self-mixing kit and the IVD kit. Use the formula to calculate the intermediate precision, we obtained the standard deviation of SD = 0.051, so the coefficient of variation was CV% = 2.032%. The coefficient of variation lies within the CV% <5% limit. With the above results, we calculate the trueness has tex = 0.906. In addition, through the table the sensitivity of the self-mixing kit is 99.52% and the specificity look at tt = 2,262; tex < tt so we achieve testing standards. Thus, is 98.90%.
Table 3: Determining the accuracy of the kit.

Comment: From the results in the table above, we calculated the repeatability has standard deviation of SD = 0.034 and the coefficient of variation CV% = 1.407. The variation coefficient of the self-mixing kit is within the allowable limits (CV% <5%).
Table 4: Statistics of fructose quantitative results in 3 groups of patients.

Table 5: Index of indicators to calculate the sensitivity and specificity.

Table 6: Table of correlation coefficient between two kit.

Comment: The Pearson test showed a strong correlation between the self -mixing kit and the IVD kit with r = 0.990 (0.983-0.995), p < 0.001.
Table 7: T-test of the difference between the two methods.

Comment: The mean value of the difference between the two methods is -0.29 and is not different from zero with p = 0.035 <0.05, ie there is a correlation between the two methods with reliability 95%.
Figure 2: Bland Altman diagram shows the compatibility of the two methods.
Comment: The mean difference between the two methods was very small (0.0116), close to 0. Most cases were within ± 1.96 standard deviations. Therefore, two methods have the same value in the quantification of fructose concentrations in semen.

(Tables 6 & 7) From the tests above we have built the Bland Altman diagram showing the correlation between the results of the two methods (Figure 2).
Quantification of fructose in semen by the self-mixing kit has many improvements with current processes in the world.
a) TCA Trichloroacetic Acid (CCl3COOH) 10%.
b) 30% HCl solution
c) 0.1% resorcinol solution in 950-stage ethanol by 0.1 g resorcinol in 100 ml ethanol 95°
d) Fructose standard (Merck, Germany standard PE).
Choosing that chemical is the difference between this process in Vietnam and the world. In the world, the color indicator used for fructose quantification is often used indola color indicator that is expensive and hard to find in Vietnam. We phase 0.1% resorcinol solution with resorcinol 0.1g in 100 ml ethanol 95°. On the other hand, we can't make mistake when manufacture the chemical. However, our kit is established for the chemicals after each phase. When using out of the chemicals, the calibration function needs to be rebuilt. Thus, the design of kit for many samples, divided into two separate sections, includes a mixture of colorants and color indicators for long-term preservation and helps us limit errors and help us to use chemicals in efficient and economical way.
This is the most improved point of this process because when using only HCl and resorcinol, compared to the original ROE method using HCl, resorcinol and benzoic acid. The amount of HCl in the original version was 6 ml, resorcinol 2 ml, while the kit used only 2.5 ml of HCl and 0.25 ml of resorcinol for one time per patient. While the kit of Fertipro use the color indicator is Indola. Not only this chemical is too poison and hard to found in Vietnamand but also the kit has been added to NaOH to stop color creation.
We improved against the ROE method when contruct the calibration function. When ROE complete the manufacturing procedure of kit they using a calibration function with thresholds of 0.1; 0.5 and 0.025 g / l. According to WHO 2010, fructose in normal human> 1.3 g / l. However, according to studies using the ROE method, human fructose is normally 1.3 to 4 g / l. While building the calibration function with the smallest distance to make higher the accuracy. Between the different chemical phases, due to subjective or objective factors, there may be errors that make the result between the two lots different. In order to limit the confounding factors, ensure the stability of the results between different batches of chemicals, with each chemical phase we rebuild the calibration function. The equation for the calibration equation is y = 1.2797x, the correlation coefficient R = 0.99. So when calculating, the quantitative results when using the following batch of chemicals need to be multiplied by a factor of 1, which means that no additional factor. It can be seen that there are no significant differences in the test results between the different batches of test reagents.
In trials, especially quantitative testing, there are a number of error factors that affect the test, leading to inaccurate results. Therefore, in order to control these confounding factors, it is necessary to use the precision. Precision results only depend on the random error factor that is not related to the actual result of the sample. The lower precision the standard deviation, the greater the variance. Precision is based on three parameters: the repeatability, the intermediate precision and the reproducibility. In this study, we only performed experiments that calculated the repeatability and the intermediate precision because there is no equivalent laboratory, it is not possible to calculate the reproducibility. In this study, our self- mixture kit has a repeatability with a CV% coefficient of 1.407%, so that the coefficient of variation does not exceed 5% indicates that satisfies the requirements of the analysis. When calculating the intermediate, we obtained the coefficient of variation CV% = 2.032%. This coefficient of variation is also valid for not more than 5%. And so, the process also meets the requirements of the analysis. Thus, when the effect of random error elements is the same, the concentration measured under different conditions has a tolerable range.
The trueness of the method shows that the degree of proximity between the result obtained and the actual value or accepted value is true (μ). By experimentally testing the trueness, the result we obtained is tex = 0.906. Also, when looking at the table, the tt value obtained is 2.262. This means that the concentration of fructose measured from this method has the same effect as the actual concentration of the sample. The process achieves the required accuracy of an analysis. The IVD kit we use in this study is the Fructose Test (Belgium), which is being used widely to measure fructose in semen in laboratories today. This kit also follows the principle of colorimetric method, but indol is used as an expensive chemical that is difficult to buy in Vietnam and requires the use of a color rendering stopper. In addition, the kit must be imported from abroad, through many intermediate stages leading to the cost of testing high. While our self-mixture test kits use only simple, low cost, common-sense, easy-to-buy, and less chemicals than commercial kits. The sensitivity and specificity are two statistics that reflect the accuracy of the test. A good test kit should have high sensitivity and specificity, which means that the kit has low false positives and false negatives. These are two important criteria for evaluating the quality of an analysis kit. Our kit achieves a specificity of 98.90% and the sensitivity is 99.52%. It is therefore possible to use this kit to quantify fructose in semen with high reliability. Results showed that there were significant correlations between the two methods (r = 0.990; p <0.001), the mean difference between the two methods was 0.0116, equivalent to 2.078%. This difference was not statistically significant (T test: p = 0.035 <0.05). The chart shows that the difference is completely random and independent from the standard scale.
a) The optimum TCA solution content is 10%
b) The mixture of color is 2.5 ml HCl 30% and 0.25 ml resorcinol 0.1% for one time quantitative per 01 patient and optimal range 0-3h
c) Repeatability: CV% = 1,407 %
d) Intermediate precision: CV% = 2.032 % (< 5%)
e) Trueness: tex = 0,906 < tt = 2, 262
f) The sensitivity is 99.52%; the specificity is 98.90%
g) Results showed that there were significant correlations between the two methods (r = 0.990; p <0.001), the mean difference between the two methods was 0.0116, equivalent to 2.078%. This difference was not statistically significant (T test: p = 0.035 <0.05).
The authors would like to take this opportunity to extend my sincere thanks to Ministry of Health for providing financial support for the study. We also are grateful for the technical support of the Hanoi Medical University Hospital for the assay of the seminal fructose concentration.


