info@biomedres.us
+1 (502) 904-2126
One Westbrook Corporate Center, Suite 300, Westchester, IL 60154, USA
Site Map

Received: January 24, 2019; Published: February 04, 2019
*Corresponding author: Attaphongse Taparugssanagorn, Asian Institute of Technology, Thailand
DOI: 10.26717/BJSTR.2019.14.002485
Photoplethysmography (PPG) is a noninvasive method to measure heart rate which is commonly used in wearable devices. PPG measured at the wrist is corrupted with Motion Artifacts (MA) during physical activities and therefore a certain amount of signal processing is needed before estimating the heart rate. There are several proposed methods to remove MAs from a PPG, such as independent component analysis, sparse spectrum based methods, and Singular Value Decomposition (SVD). These methods have a high complexity compared to the Least Mean Square (LMS) adaptive later technique with acceleration data as the reference signal. In this paper, the performances of several types of LMS liters are computed and compared with the performance of the SVD method. The results show that the general LMS algorithm and the normalized LMS algorithm perform better than the other variants of LMS algorithm and that the general LMS algorithm performs better than the SVD. An autoregressive integrated moving average (ARIMA) model of the PPG signal has also been estimated for future applications of this signal.
Keywords: Photoplethysmography; Modeling; ARIMA Motion; Artifacts Signal Processing; LMS Algorithm
Abbrevations: PPG: Photoplethysmography; MA: Motion Artifacts; SVD: Singular Value Decomposition; LMS: Least Mean Square; ECG: Electrocardiogram; MSE: Mean Square Error; FIR: Finite Impulse Response; VSS: Variable Step Size; BPM: Beats Per Minute; FFT: Fast Fourier Transform; ARIMA: Autoregressive Integrated Moving Average; AIC: Akaike’s Information Theoretic Criterion; MAE: Mean Absolute Error
Heart rate is one of the vital signs measured to monitor the health status of a person. The oldest method to measure heart rate is by taking the pulse. It is still used all over the world. But this method cannot be used on a continuous manner. Heart rate also can be measured by using Electrocardiogram (ECG) or Photoplethysmography (PPG). ECG cannot be used out-side hospital environments. Due to its simplicity PPG is commonly used in wearable devices to measure heart rate. Photoplethysmography uses light to measure the blood volume in an organ. Light absorbance rate changes with the amount of blood owing through the veins, which changes with the heart rate. Light absorbance rate can be measured using a photo diode. There are two methods, namely transmitted mode and reactive mode. In transmitted mode, the light emitted from the photo diode travels through the tissue and is received by the receiver at the other side of the body. This method can be used at earlobes and undertips. In reacted mode, light transmitted by the transmitter gets reacted by the tissue and is received by the receiver at the same side of the body.
This method can be used at undertips or wrists. Since a photo diode can be easily added to a device, which can be comfortably worn at the wrist, reactive mode is used in wearable devices to measure heart rate at the wrist. One problem is that, this signal is an acted by Motion Artifacts (MA). Although in [1] a Stochastic model is estimated for the PPG signal, this method cannot be directly used when the PPG signal is corrupted with MA and it is a complex method to measure heart rate. Anuradhi Welhenge et al. When a person is engaged in physical activities the PPG signal is corrupted by MAs. If the level of corruption is high, an amount of signal processing is needed before analyzing the PPG signal. There are several studies done on this. Some of them are, a heuristic non-linear physical model [2], a recognition method to find uncorrupted pulses based nature of light, occurrence and pulse size [3], a smoothed pseudo Wigner {Ville distribution [4]. Sparse spectrum based methods [5], independent component analysis, singular value decom-position [6], wavelet decomposition [7,8], an empirical mode decomposition [9,10], adaptive filtering [11] are more of the techniques often used to remove MAs. General Least Mean Square (LMS) algorithm, signed LMS, zero forcing LMS, clipped LMS, variable step size (VSS) LMS, zero attracting VSS LMS [12] are some of the variants of LMS algorithms.
In this paper, we have selected adaptive filtering techniques since it is the simplest of the methods listed. We have compared the performances of variants of the LMS algorithm for MAs removal from PPG signals collected by a wrist worn device. We also have compared the performance of Singular Value Decomposition (SVD) with the general LMS algorithm. Although some studies have used general LMS, an adaptive step size algorithm [13], to the best of our knowledge no study has used signed LMS, zero forcing LMS and clipped LMS algorithms for MA removal. Most of the wrist watches or on-body devices with heart rate measuring functionality are already equipped with accelerometers. Several previous studies have used the acceleration data for their algorithms. The method proposed in this paper uses the summation of all three components of the acceleration as the reference signal. In previous studies a reference signal was derived from the signal itself or only one component of the acceleration signal was used. With the acceleration data, the proposed LMS algorithms in this paper have low complexity when compared to other algorithms such as singular value decomposition. Low complexity algorithms require less computation time which in turn yields low power consumption which is desirable for a small wear-able device. The paper is organized as follows: Section II pro-vides the background to this work. Section III describes the proposed methodology. Section IV describes the experiments and results. Finally the conclusion of the work is drawn in Section V.
When using a wrist attached device to measure the PPG signal, the noise introduced by MAs at the wrist is unknown, it is then best to consider this type of noise as a black box and try to estimate it using adaptive algorithms. Several adaptive filters can adjust their coefficients using an algorithm such that the mean square error is minimized.
LMS algorithm tries to minimize the Mean Square Error (MSE) cost function. This algorithm is shown in Figure 1. The PPG signal corrupted with MA (dk) (k 2 Z) has the cardiac component (sk) which is the PPG signal without the MA and the noise component which is the MA and any other unrelated noise (nk). The acceleration signal is used as a reference signal to generate the Finite Impulse Response (FIR) signal, which can be used to model the noise (^nk) from the acceleration signal. And LMS adaptive algorithm generates the FIR coefficients. Subtracting this estimate from the original signal (dk), an estimate for the cardiac component can be achieved. We have investigated the following distinct methods of the LMS algorithm family.
Figure 1:Adaptive filter structure.

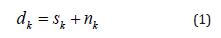
It is the most common among the LMS algorithms. It can be described by the following equations. The noise corrupted signal is expressed as,
The filter output is then written by
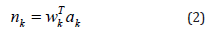
where wk and ak denote filter coefficients and acceleration signal, respectively.
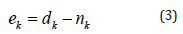
And finally, the estimated signal is expressed as
The corresponding weight is updated in each time instant as
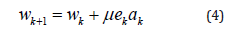
Where μ is the step size and can take values between zero and one.
Other variants include Variable Step Size (VSS) algorithm, signed LMS algorithm, clipped LMS algorithm, and zero forcing algorithm. VSS LMS algorithm is done as follows [14].
The step size μ is calculated as
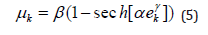
Where α, β and γ are constants and sech are hyperbolic secant function. The signed LMS algorithm updates the corresponding weights as
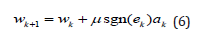
Where
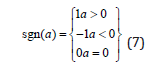
The clipped LMS algorithm updates the corresponding weights as
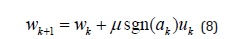
And the zero forcing LMS algorithm updates the corresponding weights as
In the normalized LMS the corresponding weight is updated in each time instant as
If X is an m × n matrix, then the singular value decomposition of X is given by
where U is an m × n matrix, S is an n × n diagonal matrix and VT is an n × n matrix. The diagonal elements of S are called singular values. U and V are unitary matrices with UTU = I and VTV = I, where I is an identity matrix. In [15], they used SVD method to remove MA from the PPG signal. In this method the acceleration signal is not needed. If the signal (x(t)) is periodic and the wavelength is n then the signal can be expressed as a matrix (X) with each row length equal to wavelength as shown below. By performing an SVD, the matrix S is a rank one matrix, which means it only has a value for the first element and rest of the diagonal elements in this matrix are zeros. The PPG signal is a quasi-periodic signal and for this type of signal diagonal elements do not become zero. However, in this case if the length of the matrix corresponds to the dominant frequency, then the ratio of the first two singular value is a maximum. This ratio is called the Singular Value Ratio (SVR).
When comparing the complexities of the algorithms used for MA removal from PPG signals, the LMS algorithm has the lowest complexity. There are two commonly used algorithms to calculate SVD. One of them is the Jacobi algorithm with a complexity of O(N3) [16]. The algorithm used in Matlab also has a complexity of O(N3) [17]. Algorithms with a complexity of O(N2) are mentioned in [18] and [19]. However, the complexity of the LMS algorithm is 2N+1 [20], where N is the number of inputs. This is also shown in Table 1. The complexity of processing the accelerometer data should be added to the LMS complexity. However, for processing acceleration data we only need N computations. Even after including this LMS algorithm has a lower complexity than SVD. This means that less calculations are needed, and therefore low power consumption, which is desirable by small wearable devices.
Table 1: Comparison of complexity of different algorithms.

According to the American Heart Association, heart rate is the number of times your heart beats per minute
[21]. Average resting heart rate is 60 - 100 Beats Per Minute (BPM). But when exercising the heart rate increases.
In detecting HR, the first stage is to remove any MA. If there is no MA, then the HR peaks can be easily identified in the frequency domain. However, with MAs, the HR peak is likely buried within the MA peaks. For these cases an HR peak tracking algorithm is used. In peak detection algorithms, a next peak is detected by comparing the new peak with the previous peak since the HR does not change much in a short time. Zhao et. al. has found that within 0.1s period HR can change only by -2-4 BPM [22]. In some cases using only peak detection may yield inaccurate values and hence HR prediction algorithms are preferred. In this study, for the initial stage of removing the MA, various LMS adaptive algorithms were used and their performance was compared with each other. Initially, the data is segmented into 8 second(s) time windows since the ground truth HR derived from ECG data was calculated for 8 second(s) windows in the used datasets.
In adaptive MA cancellation techniques the MA reference signal is derived from the PPG signal it-self or the acceleration signal is used. In the PPG signal, the frequency range of the cardiac activity is within 0.5 and 4 Hz and the frequency range of the respiratory activity is within 0.2 and 0.35 Hz and the MA is located somewhere at the frequency range greater than 0.1 Hz. In the PPG signal, making amplitudes of frequencies of the cardiac and the respiratory components equal to zero and converting back into the time domain, the synthetic noise reference signal is generated [13]. However, in this method since acceleration data is also available, they are used as the reference signal. Signals from all the axes (x, y and z) of the accelerometer are added together to generate the acceleration signal (ak). This takes the effects of noise on all three axes. This signal is represented with a FIR model. Using an adaptive filter, the FIR coefficients are derived [11]. The output is an estimate of the noise (^nk). This signal is then subtracted from the PPG signal (dk) which is the addition of the cardiac component (sk) and the noise component (nk) to get an estimate (ek) for the cardiac component. The adaptive filter continuously adjusts the filter coefficients. The purpose of this method is to minimize the error between nk and n^k.
Furthermore, the SVD method is also used to re-move MA and to compare the results with the general LMS algorithm. The SVD algorithm does not use acceleration data but the complexity of the general LMS algorithm even with acceleration data is lower when com-pared to SVD algorithm. The SVD algorithm is based on [15]. Each time, 5 cycles of data that corresponds to 4 second(s) duration is processed. Starting from 150 samples which represent a heart rate of 0.833Hz, are used as the row length and a matrix is formed. SVR is computed from this matrix by first applying SVD and by finding the matrix S. Then the second matrix is formed by reducing the sample size by one and again the SVR is calculated. This process is repeated until the row length is 62 samples which corresponds to a heart rate of 2Hz. The next step is to plot the SVR against the row length using Matlab and find the row length depicting the maximum SVR. This row length is the dominant period of the PPG signal and the first cycle of the signal can be recovered by taking the column wise average. Figure 2 shows the SVR spectrum for three cycles for dataset 1. Final step is to drop the samples corresponding to the period from the beginning the signal and add the same amount to the end of the signal from new data and repeating the above process.
Figure 2: SVR spectrum for three cycles for dataset 1.

Using the MA removed signal, the peak is detected in the frequency domain. The signal is segmented into the 8s windows and Fast Fourier Transform (FFT) is ap-plied. In each window, either the highest peak or the peak which is closer to previously found peak is detected. Also it is verified whether there is a peak in the acceleration signal at this frequency, if it is, then this peak is neglected. This method is utilized to resolve the problem of the HR peak buried within MA peaks. If the detected peak is not within the range of the previous peak - 2 BPM to the previous peak + 4 BPM, the HR is predicted.
To validate this algorithm, datasets used in [16] are used. Datasets are recorded using a single-channel PPG signal, a threeaxis acceleration signal, and an ECG signal from 12 male subjects with yellow skin and ages ranging from 18 to 35. For each subject, the PPG signal was recorded from wrist using a pulse oximeter with green LED (wavelength: 515nm). The acceleration signal was also recorded from wrist using a three-axis accelerometer. Both the pulse oximeter and the accelerometer were embedded in a wristband, which was comfortably worn. The ECG signal was recorded from the chest using wet ECG sensors. All signals were sampled at 125Hz. During data recording, the subjects walked or run on a treadmill with the following speeds in order: the speed of 1-2km/h for 0.5min, the speed of 6-8km/h for 1min, the speed of 12-15km/h for 1min, the speed of 6-8km/h for 1min, the speed of 12-15km/h for 1min, and the speed of 1-2km/h for 0.5min in order to increase their heart rates. Depending on their ages, the heart rate can be more than 100 BPM at some of these speeds. The subjects were asked to purposely use the hand with the wristband to pull clothes, wipe sweat on forehead, and push buttons on the treadmill, in addition to freely swing.
A model for the MA corrupted PPG signal is estimated using an autoregressive integrated moving average (ARIMA) process. This can be used to forecast the missing parts of a recorded signal or if the signal has unexpected errors as well as to derive bounds for the performance of different algorithms. We model the PPG signal with noise using an ARIMA process of order (p,d,q). Since this model is not for the PPG signal without MA, this cannot be used to estimate heart rate directly. Therefore this model is not used to estimate the heart rate in this paper, but the purpose is to provide a repeatable model for readers. Box-Jenkins method is used to estimate ARIMA parameters, i.e, Ø1; Ø2; : : ; Øp, Ѳ1; Ѳ2; : : : ; q, and d and to estimate the order of the process Akaike’s Information Theoretic Criterion (AIC) is applied. The resultant estimates are as follows: p = 9, q = 9, d = 1, Ø= 1.54; 0.84; 0.07; 0.15; 0.93; 1.41; 0.76; 0.07; 0.12,
Ѳ= 2:17; 1:19; 0:30; 0:30; 0:98; 2:14; 1:16; 0:29; 0:29, and2w σ is 2.01.
For these datasets the Mean Absolute Error (MAE) is calculated as
while the coefficient of determination (R2) is calculated by
where SSE denotes the sum of squared error and SST denotes the sum of squared total.
For the general LMS algorithm, three different step sizes are used to find the best step size value. Comparison of MAE for different step sizes and R2 values are shown in Figures 3,4 respectively. Comparison of MAE and R2 for different LMS algorithms are shown in Figures 5,6. The step sizes for VSS LMS, clipped LMS and zero forcing LMS are set to 0.05 and one for the signed LMS it is set to 0.0075 since it yields better results than 0.05. Results for MAE and R2 for SVD method is shown in Table 2 while Table 3 shows the MAE values for the same datasets using Singular Spectrum Analssysis (SSA) and Wavelet denoising for MA removal. SVD SSA and wavelet denoising methods do not perform well com-pared to the LMS variants. They have high MAE values and SVD method has low R2 values.
Figure 3: Comparison of MAE for different step sizes.

Figure 4: Comparison of R2 for different step sizes.

Table 2: Results for MAE and R2 for SVD method without using acceleration data.

Table 3: Results for MAE for SSA and wavelet denoising method.

Figure 5: Comparison of MAE for different LMS algorithms.

Figure 6: Comparison of R2 for different LMS algorithms.

For the general LMS algorithm slightly better MAE values and R2 values are obtained when the step is 0.05 compared to 0.04 and 0.06. In some of the data we can see that a large MAE and a very low R2 value was obtained. This can be due to the dataset having a MA much higher than other datasets and the subjects lowered their acceleration in the middle of the test due to tiredness. Among the variants of LMS algorithms, normalized LMS algorithm have low MAE values and high R2 values compared to the others. In Figures 7,8, ground truth vs. HR for aggregate data for general LMS and SVD method was shown. If the calculated values were the same as the ground truth values, they should be on the t-ted line. In the SVD graph, a wider dispersion from the fitted line can be seen when compared to the general LMS graph.
Figure 7: Ground Truth HR vs. Calculated HR for aggregate data from the General LMS algorithm.

Figure 8: Ground Truth HR vs. Calculated HR for aggregate data from the SVD method.

This result indicates that the general LMS method yields more accurate values than the SVD method. Hence, we can conclude that the general LMS algorithm with a step size of 0.05 performs better than the SVD method. We obtained high MAE values and low R2 values from the SVD method compared to the LMS algorithm. Comparison between SSA and wavelet denoising also shows that LMS algorithm performs better in terms of MAE. In LMS algorithm the highest MAE is 6.63 whereas in SSA MAE is some-times above 100. Similarly, in wavelet denoising highest is 44.93 which also shows a worse performance than LMS. We then compared the general LMS algorithm with a study done on a commercial product.
One of the commercial devices to measure heart rate is Fitbit product which also uses motion data to calculate heart rate. But a study conducted by Jo et. al. [24,25] has shown that Fitbit Charge HR and Fitbit Surge do not pro-vide a valid measure of users’ HR specially during the moderate to high intensity activities. These data were validated by ECG readings. The collected results from this study are compared in Table 4 with the data collected from our above study. For this comparison results from the aggregate data are used in the new proposed method as well as in the study. Our proposed method performed better compared to Fitbit products in the study. Our method has a high correlation, low standard error of estimation and a low MAE value.
Table 4: Comparison of performance between the new proposed method, Fitbit Charge HR and Fitbit Surge [18].

In this paper we compared the performances of variants of LMS algorithms for motion artifact removal in PPG signals during physical activities. The optimal step size for the LMS algorithm is 0.05, since it gives lower mean absolute errors and lower correlation coefficients. Among the different variants of the LMS algorithms, the general LMS algorithm and normalized LMS algorithm gives a better performance compared to the others. For removing MA the LMS algorithms are better than the SVD method. Also, these algorithms perform better than the results given in The MAE for the normalized LMS is better than the MAE reported in [26].
However, these algorithms can be further improved, and future work will comprise of improving the correlation between estimated and actual values. The importance of this work is that, LMS algorithms have a lower complexity yielding low power consumption on wearable devices and can have a positive effect on the battery life. We also estimated a model for the PPG signal with MA using ARIMA process. ARIMA model of the PPG signal is very useful in the cases where the signal has missing parts or if the signal has unexpected errors. It can be used to detect changes across time in heart rate and can be used to detect other physiological parameters such as the blood oxygen saturation. It can also be used in Kalman filters to filter out the MAs, which will be explored in future work.


