 Research Article
Abstract
Keywords: 3D Printing; Magnetic Resonance Imaging; MRI, computed tomography; CT; Episcopic Confocal Microscopy; ECM; Congenital Malformation; Mouse
Introduction
Three-dimensional (3D) printing is an additive manufacturing process to turn digital files into graspable 3-dimentional physical objects 1. 3D printing from medical imaging data has been gaining wider clinical applications in surgical planning, clinical training, and imaging research [1-3]. With the advancement of medical imaging, the 3D computed tomography (CT) and magnetic resonance imaging (MRI) can be obtained in high resolution within a reasonable breath-hold time window [2,4]. However, the visualization of the 3D medical imaging source data is still largely limited to 2-dimentional (2D) multiplanar display, which makes diagnosis and surgical planning challenging. 3D printing can overcome this barrier by turning the multiplanar imaging data into anatomically accurate 3D models, to train new surgeons in controlled environment without risking patient safety, to aid radiologists for better diagnosis 5, and to facilitate patient-specific pre-surgical planning [2,4,6]. The rapid prototyping of the heart by 3D printing from medical imaging data is particularly transformative for managing the congenital heart disease (CHD), because the presentation of the complex CHD is highly variable among individuals [3,7-10].
Wide spectrum of anomalies in great vessels, valves, and intracardiac chambers can co-exist or be missing in multiple locations in a single CHD patient, which can make surgical planning very challenging. The individualized structurally accurate physical model of the heart and vessels for each CHD patient can allow individualized comprehensive diagnosis, optimizing planning for surgical intervention, and allowing rehearsals of the surgical procedures to improve precision; consequently, to improve patient outcome. Small animal models, particularly mouse models, of human diseases are indispensable tools for biomedical research. Genetically engineered transgenic mice and mutant mouse models generated by forward genetic screening with N-ethyl-N-nitrosourea (ENU) chemical mutagenesis are essential in understanding human CHD because mice and human share similar physiology and anatomy, including the 4-chambered hearts, vascular systems, and similar structure and function of visceral organs. More importantly, many genes, gene modifiers, as well as biological processes and molecular pathways are conserved between mice and humans. Detailed phenotypic characterization by imaging [11-14] is crucial in the development of animal models, mechanistic studies into disease pathogenesis and testing the efficacy of experimental therapeutics. With the advancement of modern transgenic technology, including CRISPR-Cas9 gene targeting, as well as several national and international programs, such as IMPC, KOMP, IPADMD, MGD, and EMMA, systematically knocking out every single gene in the mouse genome, generating unprecedented number of mutant mice, it is now possible to pursue detail mapping of genetic functions and pathways in CHD.
Detailed characterization of the structural cardiac and vascular presentation of these genetic mutants can help mapping genetic networks governing heart development [15,16] and their effects on topological manifestation of CHD. We have utilized micro-CT, micro-MRI, and episcopic confocal microscopy (ECM) extensively for ultra-high-resolution imaging and phenotyping of CHD mutant mice [11, 12,17-19], especially in fetal and neonatal mice with CHD. However, the micro-CT, micro-MRI, and ECM images of fetal and neonatal mice are drastically different from human medical imaging in spatial resolution, voxel dimensions, voxel numbers, dynamic ranges, imaging contrast and texture, as well as source imaging data format, because of the minuscule sizes of mouse fetuses. As a result, the routine 3D printing tools developed for human medical imaging are not directly applicable for mouse micro-CT, micro-MRI, and ECM. In this work, we introduce a practical work flow for converting micro-imaging data to 3D printed physical models. We will discuss this practical guide in three sections: imaging acquisition, image post-processing for 3D modeling, and 3D printing.
Imaging Acquisition
Micro-CT
Micro-CT is a powerful imaging modality that utilizes x-ray attenuation to acquire high-resolution three-dimensional images from radio-opaque tissues, such as bones. Iodine-based contrast agents can enhance X-ray attenuation in soft tissues, enabling micro-CT imaging with high accuracy [12,19-21]. Formalin fixed mouse embryos or newborn pups stained with iodine (Figure 1A) by simple immersion in 0.025 N potassium tri-iodide (Lugol) solution can provide excellent contrast, enabling micro-CT scans to be used for performing virtual necropsies [22-24]. A typical scan takes approximately 25 minutes, during which four to eight fixed embryos (embryonic day 12-16) or 12 fixed newborn mouse pups can be scanned at a resolution of 15μm or 45μm, respectively. The imaging data collected in this manner (Figure 1B) can provide remarkably accurate visualization of fetal and newborn mouse anatomy [12,18,19,25]. With the ability to simultaneously image 8-12 fetuses/pups per scan, mutant mice can be readily identified from an entire litter with just a single scan, greatly accelerating the diagnosis of CHD and other structural birth defects.
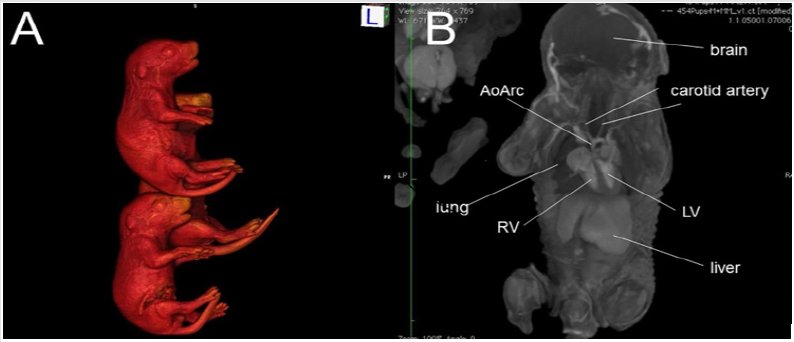
Figure 1: An example of ex vivo 3D micro-CT of formalin-fixed mouse pups imaged at 46 m X 46 m X 46 m spatial resolution. (A) 3D surface rendering of iodine-stained mouse pups, and (B) a plane from the multi-planar 3D imaging data stack. Abbreviations: AoArc: aortic arch; LV: left ventricles; RV: right ventricle.
Micro-MRI
MRI is based on the detection of protons utilizing low-energy radio-frequency (RF) waves in magnetic fields to form images without ionizing radiation. MRI has excellent intrinsic soft tissue contrast because the relaxation characteristics of water protons are governed by the micro-environment of each tissue 11. With the development of small-board high-field magnets and small micro-RF coils, micro-MRI is capable of very high-resolution 3D imaging of mouse embryos with excellent contrast 26-29, thus termed “MR Microscopy” 30. Hence, micro-MRI is a suitable imaging modality for “digital pathology” or “virtual histology” 11, 28, 31, 32 for phenotyping and characterizing mouse embryos without tissue sectioning as conventional histology. Formalin fixed mouse embryos or newborn pups can be soaked in 0.05 % gadolinium (Gd) solution for one to a few days for contrast enhancement prior to imaging. Figure 2 shows multiple mouse embryos harvested on the embryonic day E16.5 imaged by micro-MRI with 33 m X 46 m X 46 m spatial resolution. Congenital structural birth defects can be identified (Figures 2C-2E).
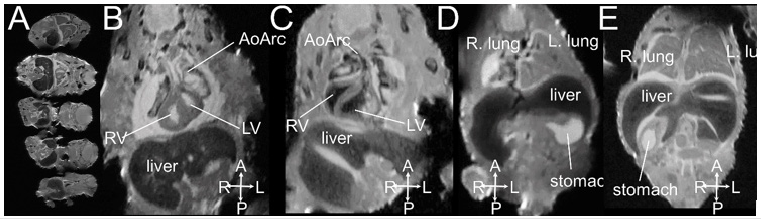
Figure 2: An example of ex vivo 3D micro-MRI of formalin-fixed E16.5 mouse embryos imaged at 33 m X 46 m X 46 m spatial resolution. (A) 5 fetuses can be imaged at the same time; (B, D) normal embryos; (C) mutant with right aortic arch; (E) mutant with right stomach. Abbreviations: AoArc: aortic arch; LV: left ventricles; RV: right ventricle; The arrowheads indicate body axis: A-anterior; P: posterior; L: left; R-right.
ECM
Histopathological imaging with episcopic confocal microscopy (ECM) is the ultimate gold standard for validating the diagnosis of birth defects in mouse embryos and neonatal pups. With ECM imaging 12, 17, 19, the paraffin embedded specimen is sectioned using a sliding microtome with a fixed photoposition, and the block face is serially imaged after each cut using a laser scanning confocal macroscope mounted over the microtome (Figure 3). In this manner, the 2D serial image stack collected of the specimen is in registration, allowing rapid 3D reconstructions to be generated and it is possible to digitally re-slice the serial 2D image stack in any imaging plane. In this manner, it is possible to make a complete assessment of any structural cardiac anomaly, regardless of the embedding plane of the specimen. This ECM histopathology has all the conveniences of micro-CT or micro-MRI data, but with the much higher resolution (5 μm) achieved by histology.
On the other hand, micro-CT and micro-MRI allow simultaneous whole-body imaging for multiple mouse embryos or neonatal mouse pups, whereas the ECM can only section and image much smaller sample size, only 1 organ/tissue from 1 single embryo at a time. Figure 3 shows single imaging plane out of the 3D multiplanar ECM imaging stacks of embryonic mouse hearts from a normal wild-type embryo (Figure 3A), a mutant embryonic heart with hypoplastic left heart syndrome (HLHS) (Figure 3B), a mutant embryonic heart with double outlet right ventricle (DORV) (Figure 3C), and a mutant embryonic heart with atrioventricular septal defect (AVSD) (Figure 3D).
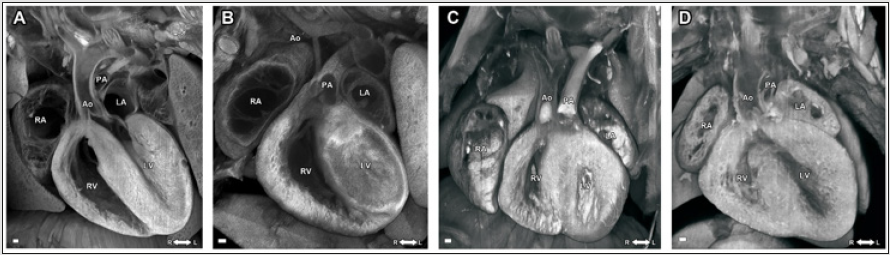
Figure 3: ECM images of (A) a normal wild-type; (B) mutant embryonic heart with hypoplastic left heart syndrome (HLHS); (C) mutant embryonic heart with double outlet right ventricle (DORV) (D) mutant embryonic heart with atrioventricular septal defect (AVSD). LV: left ventricle; RV: right ventricle; LA: left atrium; RA: right atrium; Ao: aorta; PA: pulmonary artery.
Image Post-processing for 3D Modeling
Three-dimensional multiplanar images are reconstructed to form 3D lattice, followed by 3D sculpting, surface lasso, contouring, meshing to generate 3D models for 3D printing and quantification. 3D processing and printing software is normally designed to process Digital Imaging and Communications in Medicine (DICOM) imaging format commonly used in medical imaging. Most of the micro-CT and micro-MRI vendors provide DICOM data format conversion; however, ECM platform does not have the DICOM format option, therefore, imaging format conversion is required for 3D imaging processing for 3D printing. Although micro-CT and micro-MRI source data files can be converted to DICOM format, preclinical imaging modalities generate imaging stacks with different textures and contrast from standard medical imaging. Micro-CT of the Iodinestained mouse embryos usually exhibit a very different Hounsfield unit (HU) range than regular human CT without contrast agents; thus, usually micro-CT images are not directly recognizable by the commonly used 3D processing and printing software designed for clinical CT, re-scaling is usually required. In addition, micro-CT and micro-MRI allow high-throughput simultaneous whole-body imaging of multiple mouse embryos or pups; whereas commonly used 3D printing software is designed to process 1 object at a time; therefore, segmentation for individual embryos is required to define the subject of interest one-at-a-time from the large 3D data source files.
Two open source software programs were used to establish this pipeline and a workflow established. Horos 33, a 3D segmentation, visualization, and reconstruction software; and Meshmixer 34, a 3D model editing software, were used in this project develop the model. A method in Horos was developed to overcome the difference in textures between human and preclinical imaging modalities, ultimately resulting in a 3D surface rendering of genetic mouse model heart and brain defects. Meshmixer was then used to edit said models to correct file sizes and prepare models for 3D printing. Here we outline the work flow for 3D imaging processing of 3D modeling for micro-CT, micro-MRI, and ECM for 3D printing into three steps: (1) segmentation, (2) surface rendering, and (3) optimization (Figure 4). Each step is essential to creating a final product, being a 3D printed model that accurately displays the phenotype of a given genetic mouse model, that can then be used to gain a deeper understanding of defects present in genetic models.
Segmentation
Segmentation (Figure 4) is to be carried out in the Horos software and is arguably the most important step of the process with regards to creating an accurate model. It is also where the largest deviation from human and preclinical modality conversion methods manifests. Human modalities have a much better contrast present than that of preclinical modalities, hence the segmentation process is more complicated. Instead of just thresholding and using simple tools to select regions, unwanted areas need to be cropped out by the segmentor. Essentially, it is more difficult to signify to the computer which pixels in the image stack are to be converted into a model (tissue) and which pixels are to be left out (grey space and cavities) and so extra measures must be taken. Hence, a process for segmentation and conversion was developed for ECM data. The ECM scan data which is in .tiff format is loaded into the Horos software using the import data function in Horos. This automatically loads the data in three planes. Interpolation, cropping, and thresholding were used to achieve accurate segmentation in this process. This segmentation process can be ordered into three different steps
b. Deletion of cavities using interpolation
c. Thresholding
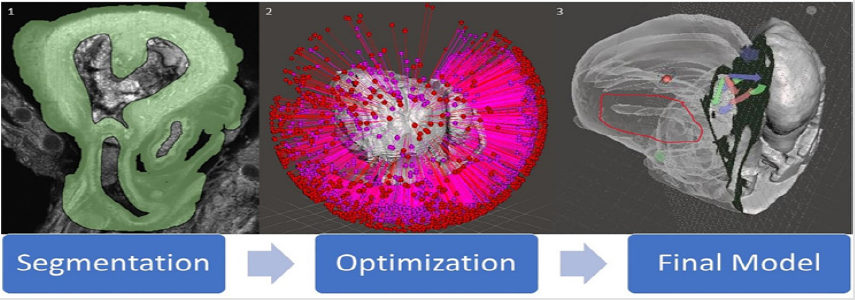
Figure 4: A diagram of the conversion process for ECM modality. (1) is a screenshot of one segmented image from a .tiff image stack. (2) is an unoptimized model immediately post surface rendering highlighting how many errors can be present in a model. (3) is a final optimized model with slicing to show internal cavities and exterior. The region of the image circled in red shows the HLHS deformity in the model. Versatility of slicing can be seen through the arrows present on the image, showing that the plane slicing the model can be easily moved in any direction.
First, any data outside of the organ in question must be deleted so that the software does not render it later on in the process. To account for this, regions of interest can be drawn every five to ten slides around the organ as closely as possible without losing any relevant data. Then, the interpolation tool can be used to fill in the missing slides via computer algorithm. This was determined to be the best method as drawing regions of interest on every slide was too time consuming and this process does not sacrifice accuracy if double checked by the segmenter. Following this, all pixels outside of the region of interest can be set to a value of zero essentially cropping the image. For ECM data, the interior cavities of the organ most likely have particles in them that will hinder the accuracy of the final model if not accounted for. To deal with this, the process outlined above can be applied again to interior cavities. This process should be iteratively carried out until the only pixels left in the image stack with any value greater than zero are the walls and tissue of the organ.
It is important to note that this is the most sensitive step in regard to accuracy because careless region selection most likely will result in loss of relevant data. Region selection must be very meticulous by the segmentor for the model to be accurate. Hence, this step is the most time consuming of the entire project. Finally, once the only pixels remaining with value in the image stack are those of the organ tissue thresholding can be carried out. Using the thresholding tool, set a lower bound pixel value ranging from one to twenty (arbitrary values that are of a greater value than the cropped region) and use the thresholding tool. All tissue should become highlighted thus completing segmentation. At this point, set all regions created from thresholding to a pixel value of 3024 (pure white) to enable surface rendering.
Surface Rendering
Surface rendering (Figure 5) is to be carried out in Horos post segmentation. It can be initiated through the surface rendering tool in the Horos software. Upon initiating the software, a window will appear asking for pixel value. A pixel value of 3024 should be entered into the box as all relevant segmentation regions should now have a pixel value of 3024 as per the previous step. The segmentations are assembled together by the program and a 3D mesh is created. If there are any holes present in the segmentation, a surface rendering will still be created, however will not be printable. Simple examination of the model created should show if it is sufficient to proceed. If it looks destroyed and incorrect, segmentation needs to be re-checked. Once this task is complete, the software will output a file in the filetype of .stl which is then compatible with 3D editing software.
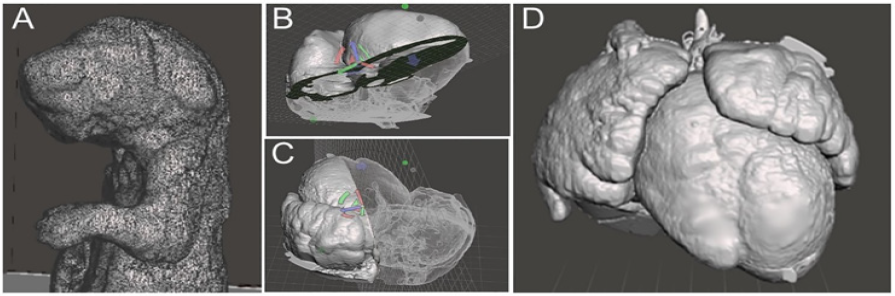
Figure 5: 3D surface rendering (A) 3D rendering of a mouse pup from micro-CT data with excessive mesh showing, highlighting the importance of optimization to reduce file weight (B, C) Examples of model slicing of a 3D rendering of a mouse heart from ECM source data file. (D) Exterior view of a 3D rendering of a mouse model heart with DORV.
Optimization
Upon rendering and exporting a .stl filetype, the model can be opened in the Meshmixer software. Optimizing the model (Figure 4) reduces file size by removing countless overlaps in data and unneeded pixels stemming from the original image stack that manifest in the mesh. Here, tools are available to repair holes in the mesh, fix overlapping edges in the data, and make it compatible with printing. This step is integral to printing because without it, the print would most likely fail if it would print at all. The tools that were used in this process were
a. Inspector tool
b. Make solid tool
c. Reduce tool
The inspector tool should be used at the beginning of the process on the “flat fill” setting. This tool identifies and fills all microscopic errors in the model. Note that texture of the original image stack is preserved through this step. Microscopic errors are altered through repair. If any large holes are present, the segmentor must go back and fix these issues in the segmentation step of the pipeline. If repaired using Meshmixer, the model will not correspond to the actual organ and accuracy will be lost. Following this step, the make solid tool should be used. This tool takes all space between cavities inside the model and makes it solid, removing errors and reducing file size greatly in the process. This tool also reduces file size of the model to approximately a quarter of the original. Note that cavities will remain open and accuracy of the model is not affected in this step whatsoever. The final tool that is useful here is the reduce tool which simply reduces file size. If reduced too much, accuracy will be lost. However, some use of the tool is helpful in making the file more versatile and transferable between computers. These three tools can be used iteratively until a satisfactory and error free model is present.
There are countless other tools that can be used to edit the model if necessary, however these three are integral in optimizing the model. It was also observed that image stacks from ECM had dimensions on the scale of five to ten meters. This is an example of another incompatibility between preclinical imaging modalities and human modalities and can be fixed using the resize tool available in the Meshmixer software. It is a simple tool to manually resize the model by dragging the cursor. Ultimately, reducing the file size of the model gives it much more versatility, reducing time taken to view and edit the file, increasing compatibility with weaker computers, and increasing ease of file sharing with other computers. This final file can also be saved and used for digital phenotyping, as it is an accurate representation of the genetic model in 3D form. It can be sliced in any direction using the place cut tool to view internal cavities and deformities making it a very versatile model. In addition to printing physical models, the segmentation and rendering models can provide volumetric information. Figure 6 shows 3D rendering and segmentation outcomes from various mutant mouse brains from micro-MRI source data.
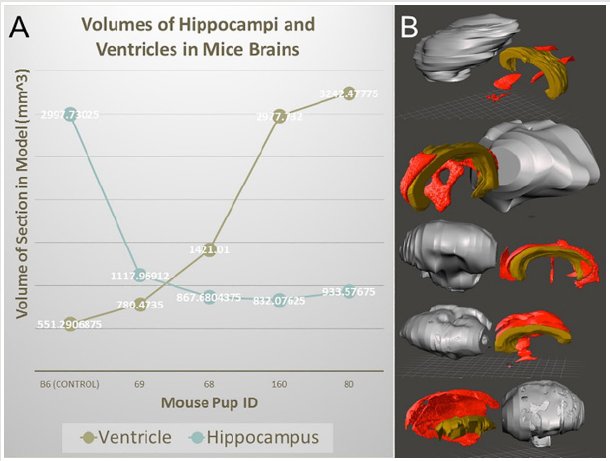
Figure 6: 3D surface rendering and segmentation for mouse brains from micro-MRI source data files. (A) volumetric analysis of ventricles and hippocampi of various mutant mouse brains. (B) 3D rendering and segmentation of the cerebrum (gray), ventricles (red), and hippocampus (brown) from various mutant mice.
3D Printing
The final step in the process is 3D printing. Once a file is sufficiently prepared in Meshmixer and accuracy is ensured, it can be sent to 3D printer for production. The resultant model should be the exact same as what is viewable on the screen and can be used to better understand the phenotype of a given genetic model. This process generally takes 16-24 hours to complete. We utilized a single- color resin printer that utilizes SLA technology to solidify resin into the print. The models were enlarged to satisfactory dimension to visualize the details and were then printed in transparent resin which was then painted to further highlight the anatomic details. Upon completing several segmentations, mouse heart models were printed depicting hypoplastic left heart syndrome (HLHS) (Figure 7). These files were also kept in database to use for future phenotyping of deformities. These saved files and printed models provided further insight into the phenotype of each deformity present in the genetic mouse models. Before this method was developed, specifically for ECM scans, there was no way to create a model that would accurately depict deformities in three dimensions. With this new method, it is now possible to go from an image stack to a 3D model that accurately depicts phenotype, providing further insight into deformities shown in genetic mouse models.
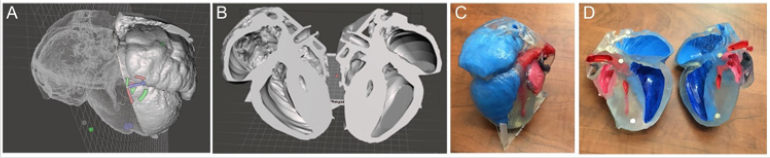
Figure 7: 3D printing of mutant mouse heart from ECM source files with the hypoplastic left heart syndrome (HLHS) (A,B) Completed 3D processed digital model of a HLHS heart; (C, D) photographs of the 3D physical model of the HLHS heart. Red: left heart; blue: right heart.
Conclusion and Future Work
We have introduced a practical workflow that can be used to generated 3D printed models of mouse embryonic and neonatal hearts from the ultra-high-resolution ECM, micro-CT, and micro- MRI source data files, to facilitate genetic mapping and deep phenotyping of mutant mouse models for CHD. This pipeline is application for other organ and model systems. Time spent is segmentation is the most limiting factor hampering the highthroughput of the prototyping with 3D printing. Automatic or semi-automatic segmentation algorithm would greatly reduce the application barrier to allow rapid and effective phenotyping. In addition, the development of a “scripting” module can further speed up and automate the workflow.
Acknowledgement
The authors wish to thank Mr. Sebastian Ho, Mr. George C. Gabriel, and Mr. William T. Reynolds for providing ECM and micro-CT data; Ms. April Krivoniak and Mr. Shawn Gottschalk for assisting with the 3D printer and printing process; and Mr. Nathan Salamacha for assisting with micro-MRI and micro-CT source data. Y.L.W. is supported by funding from the Department of Defense (DoD) W81XWH1810070 and the American Heart Association (AHA) 18CDA34140024.
References
- Bucking TM, Hill ER, Robertson JL, Maneas E, Plumb AA, et al. (2017) From medical imaging data to 3D printed anatomical models. PloS one 12(5): e0178540.
- Rengier F, Mehndiratta A, von Tengg-Kobligk H, Zechmann CM, Unterhinninghofen R, et al. (2010) 3D printing based on imaging data: review of medical applications. International journal of computer assisted radiology and surgery 5(4): 335-341.
- Cantinotti M, Valverde I, Kutty S (2017) Three-dimensional printed models in congenital heart disease. The international journal of cardiovascular imaging 33(1): 137-144.
- Esses SJ, Berman P, Bloom AI, Sosna J (2011) Clinical applications of physical 3D models derived from MDCT data and created by rapid prototyping. AJR American journal of roentgenology 196(6): W683-688.
- Mitsouras D, Liacouras P, Imanzadeh A, Giannopoulos AA, Cai T, et al. (2015) Medical 3D Printing for the Radiologist. Radiographics : a review publication of the Radiological Society of North America Inc 35: 1965- 1988.
- Goiato MC, Santos MR, Pesqueira AA, Moreno A, dos Santos DM et al. (2011) Prototyping for surgical and prosthetic treatment. The Journal of craniofacial surgery 22(3): 914-917.
- Anwar S, Singh GK, Miller J, Sharma M, Manning P, et al. (2018) 3D Printing is a Transformative Technology in Congenital Heart Disease. JACC Basic to translational science 3(2): 294-312.
- Anwar S, Singh GK, Varughese J, Nguyen H, Billadello JJ, et al. (2017) 3D Printing in Complex Congenital Heart Disease: Across a Spectrum of Age, Pathology, and Imaging Techniques. JACC Cardiovascular imaging 10(8): 953-956.
- Hadeed K, Acar P, Dulac Y, Cuttone F, Alacoque X, et al. (2018) Cardiac 3D printing for better understanding of congenital heart disease. Archives of cardiovascular diseases 111(1): 1-4.
- Vukicevic M, Mosadegh B, Min JK, Little SH Cardiac 3D (2017) Printing and its Future Directions. JACC Cardiovascular imaging 10(2): 171-184.
- Wu YL, Lo CW (2017) Diverse application of MRI for mouse phenotyping. Birth defects research 109: 758-770.
- Liu X, Kim AJ, Reynolds W, Wu Y, et al. (2017) Phenotyping cardiac and structural birth defects in fetal and newborn mice. Birth defects research 109(10): 778-790.
- Leatherbury L, Yu Q, Lo CW (2003) Noninvasive phenotypic analysis of cardiovascular structure and function in fetal mice using ultrasound. Birth defects research Part C, Embryo today: reviews 69(1): 83-91.
- Yu Q, Shen Y, Chatterjee B, Siegfried BH, Leatherbury L, et al. (2004) ENU induced mutations causing congenital cardiovascular anomalies. Development (Cambridge, England) 131: 6211-6223.
- Waardenberg AJ, Ramialison M, Bouveret R, Harvey RP (2014) Genetic networks governing heart development. Cold Spring Harbor perspectives in medicine 4(11): a013839.
- Xu H, Baldini A (2007) Genetic pathways to mammalian heart development: Recent progress from manipulation of the mouse genome. Seminars in cell & developmental biology 18(1): 77-83.
- Tobita K, Liu X, Lo CW (2010) Imaging modalities to assess structural birth defects in mutant mouse models. Birth defects research Part C, Embryo today: reviews 90(3): 176-184.
- Kim AJ, Francis R, Liu X, Devine WA, Ramirez R, et al. (2013) Microcomputed tomography provides high accuracy congenital heart disease diagnosis in neonatal and fetal mice. Circulation Cardiovascular imaging 6(4): 551-559.
- Liu X, Tobita K, Francis RJ, Lo CW (2013) Imaging techniques for visualizing and phenotyping congenital heart defects in murine models. Birth defects research Part C, Embryo today : reviews 99(2): 93-105.
- Wong MD, Dorr AE, Walls JR, Lerch JP, Henkelman RM (2012) A novel 3D mouse embryo atlas based on micro-CT. Development (Cambridge, England) 139(17): 3248-3256.
- Wong MD, Spring S, Henkelman RM (2013) Structural stabilization of tissue for embryo phenotyping using micro-CT with iodine staining. PloS one 8: e84321.
- Degenhardt K, Wright AC, Horng D, Padmanabhan A, Epstein JA (2010) Rapid 3D phenotyping of cardiovascular development in mouse embryos by micro-CT with iodine staining. Circulation Cardiovascular imaging 3(3): 314-322.
- Schambach SJ, Bag S, Schilling L, Groden C, Brockmann MA (2010) Application of micro-CT in small animal imaging. Methods 50(1): 2-13.
- Cheng KC, Xin X, Clark DP, La Riviere P (2011) Whole-animal imaging, gene function, and the Zebrafish Phenome Project. Curr Opin Genet Dev 21(5): 620-629.
- Bernhardt BC, Bonilha L, Gross DW (2015) Network analysis for a network disorder: The emerging role of graph theory in the study of epilepsy. Epilepsy & behavior E&B 50: 162-170.
- Wong MD, van Eede MC, Spring S, Jevtic S, Boughner JC, et al. (2015) 4D atlas of the mouse embryo for precise morphological staging. Development (Cambridge, England) 142(20): 3583-3591.
- Martinez Martinez MA, Pacheco Torres J, Borrell V, Canals S (2014) Phenotyping the central nervous system of the embryonic mouse by magnetic resonance microscopy. NeuroImage 97: 95-106.
- Petiet AE, Kaufman MH, Goddeeris MM, Brandenburg J, Elmore SA, et al. (2008) High-resolution magnetic resonance histology of the embryonic and neonatal mouse: a 4D atlas and morphologic database. Proceedings of the National Academy of Sciences of the United States of America 105(34): 12331-12336.
- Dazai J, Spring S, Cahill LS, Henkelman RM (2011) Multiple-mouse neuroanatomical magnetic resonance imaging. Journal of visualized experiments: JoVE 27(48): 2497.
- Badea A, Johnson GA (2013) Magnetic resonance microscopy. Studies in health technology and informatics 185: 153-84.
- Cleary JO, Modat M, Norris FC, Price AN, Jayakody SA, et al. (2011) Magnetic resonance virtual histology for embryos: 3D atlases for automated high-throughput phenotyping. NeuroImage 54(2): 769-778.
- Lerch JP, Sled JG, Henkelman RM (2011) MRI phenotyping of genetically altered mice. Methods in molecular biology (Clifton NJ) 711: 349-361.
- Horos.
- Meshmixer.
