 Research Article
Abstract
Nutraceuticals have received considerable interest because of safety and substantial nutritional and therapeutic effects. Nutraceuticals used in the treatment and prevention of different diseases. Nutrients, herbals and dietary supplements are major components of nutraceuticals for maintaining of health, act against various disease conditions and thus promote the quality of life.
Keywords: PET; PET/CT; NEMA Tests; LYSO; Time-Of-Flight Technology; Aluminum Sleeve; Spatial Resolution; Radioactive Solution; Dosimetry; Radio Chromic Film
Abbreviations: TOF: Time-Of-Flight Technology; LYSO: Lutetium-Yttrium Oxy-Orthosilicate; NECR: Noise-Equivalent Count Rate; 3D: Three-Dimensional
Introduction
The Gemini TF64 PET/CT (Philips Medical Systems) is a thirdgeneration hybrid device consisting of a PET scanner with builtin time of flight (TOF) technology that fully operates in threedimensional (3D) mode and a 64-slice Brilliance CT scanner. This equipment was installed for the first time in Cuba in the Department of Nuclear Medicine of the Institute of Oncology and Radiobiology of Havana in 2015. The PET scanner detector uses lutetium-yttrium oxy-orthosilicate (LYSO) that have intrinsic radioactivity because it contains in composition 176Lu which is a natural radioisotope. The objective of this study was to evaluate the performance characteristics of the PET scanner using the NEMA NU 2-2007 standard designed for PET scanners with intrinsic radioactivity in their detectors.
Materials and Methods
PET System Design
The PET scanner detector consists of 28 flat modules of a 23x44 array of 4x4x22 mm3 LYSO crystals. The ring diameter is 90 cm with an axial and transversal field of view of 57.6 cm and 18 cm respectively. At each axial ends of detector, a 2.5 cm thick annular ring of Pb shielding is used to reduce the detection of events originated outside the field of view. The patient bore is 70 cm in diameter. A total of 420 photomultiplier tubes in hexagonal array are coupled to the detector modules using the Anger-logic detector design [1]. The coincidence-timing window is set at 6 ns and the delayed coincidence window technique is used to estimate the random coincidences in the acquired data.
Phantoms
The NEMA NU 2-2007 test require 3 sets of phantoms: scatter phantom, sensitivity phantom and image quality phantom. The scatter phantom set include a solid circular cylinder of polyethylene with specific gravity of 0.96, outside diameter of 203 mm, length of 700 mm and a plastic tube of 800 mm long with internal diameter of 3.2 mm to hold the activity. The sensitivity phantom set consist of 5 nested aluminum tubes of known thickness and 700 mm length each and a fillable plastic tube inserted into the center sleeve. The image quality phantom is an IEC (International Electrotechnical Commission) body phantom set which consists of a torso cavity, removable lung inserts and 6 fillable spheres (10-37 mm in inner diameter).
Spatial Resolution
The spatial resolution was measured using a point source of 18F in a glass capillary with an internal diameter of less than 1 mm. For the preparation of the point source, a small amount of a solution with a radioactive concentration of 55mCi/mL of 18F was taken following the manufacturer’s recommendations [2]. The axial length of the point source was also kept less than 1 mm. Following the protocol NU 2-2007, the sources were located in the transverse plane, in cm, in the following positions: (0, 1), (0, 10), (10, 0). In the axial plane, the point sources were located in the center of the field of view and in a quarter of field of view of the center of the field of view. Two sets of measurements were made, one with the source located parallel to the axis of scanner and the other with the source perpendicular to axis of the scanner [3]. The data was reconstructed using the filtered back projection method with no smoothing. On the reconstructed images the values of the FWHM were calculated in the three directions.
Sensitivity
The sensitivity of a PET scanner is defined as the true coincidence rate per sec per unit of activity in the absence of attenuation media. For the measurement of the absolute sensitivity of the Gemini TF64 PET scanner, the NEMA sensitivity phantom was used. The 700 mm linear source was placed in the center of the field of view. The linear source was prepared so that the activity at the start of the test was between 80-200μCi following the manufacturer’s recommendations [2]. This range of activity values is sufficiently low for the loss of counts to be less than 1%. Several measurements were made with and without the aluminum sleeve that represent different levels of attenuation. The extrapolation of response to 0 absorption gives an estimate of the sensitivity in the absence of attenuation media. These measurements were performed with the linear source at the center and at 10 cm from the center of the field of view of the scanner [3].
Scatter Fraction, Count Losses and Randoms Measurement
Scatter and random coincidences are the main sources of statistical errors in PET. The count rate is an indicator of PET performance as a function of activity. The scatter, expressed in terms of scatter fraction for the entire scanner, is the quotient between the scattered events rate and the total events rate when the rate of random events is negligible. Noise is the random variation of the counts at voxel level of the image. The noise can be reduced by increasing the total counts of the image. In PET, noise is characterized by a parameter known as the noise-equivalent count rate (NECR), which is a quantity that quantifies PET efficiency as a function of activity. The activity in the peak NECR is one that maximizes PET efficiency. The test was performed using the NEMA scatter phantom. The linear source was prepared considering the activity recommended by the manufacturer at the start of the test (13-15mCi) [2]. The phantom was placed in the center of the field of view of the scanner with the source located in the position corresponding to the 6 o’clock. The acquisition was made by measuring separately the sinograms of the total and delayed coincidences using the technique of the delayed window. A 25 images were acquired during a total time of 16 h (8 images of 15 min each, 6 images of 30 min each and 11 images of 60 min each). More than 500,000 coincidences were acquired per image. The concentration of effective activity was calculated as the activity in the linear source between 22 kg [2,3].
Accuracy of Count Losses and Random Coincidences
The PET scanner must compensate for losses due to dead time and random coincidences to obtain clinically quantitative measurements. Inaccuracies in these corrections especially at high count rates affect the quality of clinical outcome. To measure the accuracy of the corrections due to dead-time losses and random coincidences, the sinograms acquired in the previous test were used. The comparison was made by measuring the true count rate in a circular ROI of 180 mm in diameter centered on all the slices and the extrapolated true count rate obtained from the data at low count rate, where losses due to dead time and random coincidences are negligible [2,3].
Image Quality
The image quality test was performed using the NEMA torso phantom. The spheres with internal diameters of 10, 13, 17 and 22 mm were filled with a radioactive concentration of 4: 1 with respect to the background. For this, in a quarter of the volume of the phantom, an activity value of 18F was diluted so that at the beginning of the test the activity value was 1.4mCi. The 4 smaller spheres were filled radioactive solution and the two remaining spheres (28 and 37 mm) were filled with water. Each sphere was placed in its position on the phantom as well as the lung insert. Finally, the remaining volume of the phantom was completed with water. To simulate activity outside the field of view of the scanner, the scatter phantom was prepared so that the activity of the linear source at the start of the test was 2.8mCi. The torso phantom was placed approximately 12 cm from the edge of the patient table and adjacent to it was placed the scatter phantom out of field of view. The data were acquired with a time per image of 5:34 min as recommended by the manufacturer [2]. Two additional acquisitions were made with a time per image adjusted for decay to accumulate the same number of events. The analysis was performed using circular ROIs drawn on each sphere and another 60 in the background region. In this way, the contrast for hot spheres, cold spheres and background variability were calculated as defined in the NEMA standard for this test [3]. The data was reconstructed with and without time of flight.
Results
Spatial Resolution
Table 1 summarizes the results of measurements of the spatial resolution of the PET scanner. It can be seen that the spatial resolution values near the center of the field of view in the axial and transverse directions are comparable. At a radial distance of 10 cm from the center of the field of view, as expected, a small degradation of the spatial resolution of the scanner is observed. In general, the results obtained show a behavior of spatial resolution within the specifications established by the manufacturer for this test.
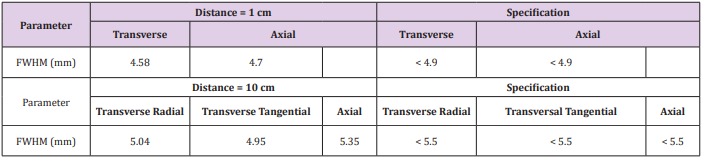
Table 1: Measures of spatial resolution using 18F point source.
Sensitivity
The measurements made show that the absolute sensitivity of the PET scanner in the center and 10 cm from the center were 7592 cps/MBq and 7945 cps/MBq respectively. As can be seen, the sensitivity values are within the specifications established by the manufacturer for this test, which must be greater than 6400 cps/ MBq. Figure 1 shows the axial sensitivity profile for a linear source located in the center of the scanner that reaches its maximum value at 171.94 cps/MBq.

Figure 1: Profile of axial sensitivity in the center of field of view.
Scatter Fraction, Count Losses and Randoms Measurement
Figure 2 shows in a graph the true coincidences, the random coincidences, the scatter coincidences and the noiseequivalent count rate (NECR) as a function of the effective activity concentration. Table 2 shows the results obtained from these data. It can be observed that these results are within the specifications established by the manufacturer for this test. The scatter fraction corresponding to the peak NECR(1r) was 34.29%.
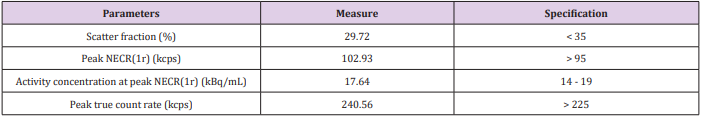
Table 2: Measures of scatter fraction, losses and random.
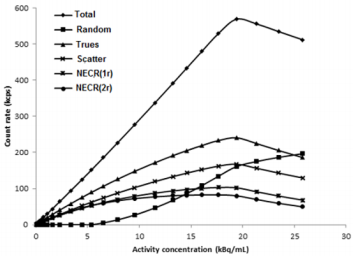
Figure 2: Behavior of the count rate performance of PET scanner.
Accuracy of Count Losses and Randoms Coincidences
Figure 3 shows the relative error of the count rate as a function of the concentration of specific activity. The maximum value of the absolute relative error of the count rate below the peak NECR(1r) was 13.2%. This value is < 30% as specified by the manufacturer for this test.
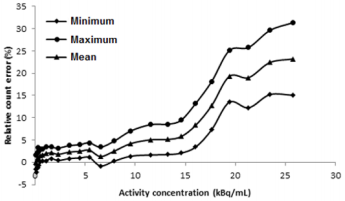
Figure 3: Relative error of count rate vs activity concentration.
Image Quality
Figure 4 shows the reconstructed image of the image quality phantom. As can be seen all the spheres are visible in the reconstructed image and the background region does not show artifacts. The contrast value and the variability of the radioactive background are shown in Table 3 for a 4: 1 concentration ratio. The average value of the residual error in the lung insert was 15.04%. From the results shown in Table 3, it is observed that the contrast and background variability measurements comply with the specifications reported by the manufacturer for this test. Figure 5 shows the images of the image quality phantom reconstructed with TOF and without TOF. As can be seen, a modest increase in the detectability of the spheres is observed for the image reconstructed with TOF.
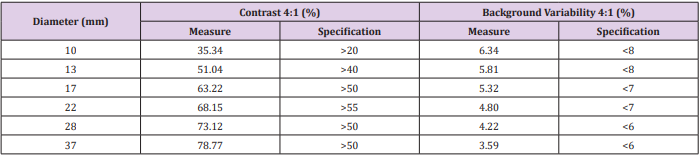
Table 3: Contrast and background variability for spheres of different diameters.
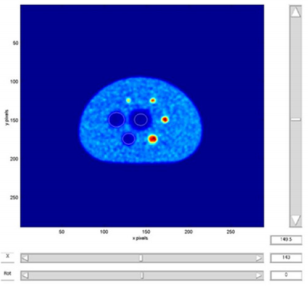
Figure 4: Reconstructed image of quality image phantom.
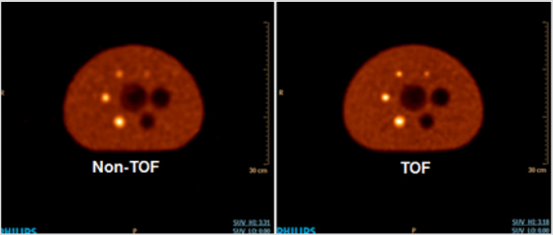
Figure 5: Quality images phantom reconstructed with TOF and without TOF.
Discussion
The Gemini TF64 PET/CT is a scanner designed based on LYSO scintillators that shows a high sensitivity, a reduced dead time and a good spatial resolution, which corresponds to the results obtained. The transverse spatial resolution varies very little with distance, which is very important because the lesions must be identified with the same resolution regardless of their location within the field of view of the scanner. The axial resolution shows values similar to the transverse resolution which guarantees that the tomographic volume can be observed in any direction without loss of resolution. The values obtained for the peak of true coincidence rate and peak NECR (1r) show the high counting capacity of this scanner in 3D mode as expected. The scatter fraction and peak NECR (1r) values were obtained with the NEMA scatter phantom representing a thin patient. For average and obese patients, an increase of the scatter fraction and a fall of the peak NECR should be expected due to the increase of the attenuation, the scatter and random coincidences. However, the concentration of activity at which the peak NECR(1r) is reached in this scanner is equal to 17.64 kBq/mL, which is 3 times higher than the expected average activity concentration under routine clinical conditions (5.3 kBq/mL).
The accuracy of the corrections for dead time and random coincidences showed a relative error of 13.2% below the peak NECR(1r). However, for concentrations of expected activity under clinical conditions (5.3 kBq / mL) the relative error was less than 5%. The measurements made with the image quality phantom show that the use of the time of fight technology modestly improves the detectability of the spheres. Previous studies have shown that the improvement in the detectability of lesions using the time of flight information during tomographic reconstruction is proportional to the size of the object and inversely proportional to the temporal resolution. In clinical studies, the use of time of flight information is more beneficial in corpulent and obese patients [1 4,5].
Conclusion
The measurements of the performance characteristics of the PET component of the Gemini TF64 PET/CT scanner installed in the Institute of Oncology & Radiobiology using the NEMA NU 2-2007 standard complies with the specifications reported by the manufacturer. In addition to the capabilities demonstrated by the tests performed, the results show an improvement in the detectability of the lesions when the time of flight information is used in the tomographic reconstruction.
References
- Surti S, Kuhn A, Werner ME, Perkins AE, Kolthammer J, et al. (2007) Performance of Philips Gemini TF PET/CT scanner with special consideration for its time-of-flight imaging capabilities. J Nucl Med 48(3): 471-480.
- (2009) Gemini Performance Test. Technical Manual for Gemini GXL and TF. NEMA 2001. Philips Medical System.
- (2007) NEMA Standards Publication NU 2-2007 Performance Measurement of Positron Emission Tomographs. Rosselyn VA: National Electrical Manufacturers Association.
- Karp JS, Surti S, Daube Witherspoon ME, Muehllehner G (2008) Benefit of Time-of-Flight in PET: Experimental and clinical results. J Nucl Med 49(3): 462-470.
- Surti S, Karp JS (2009) Experimental evaluation of a simple lesion detection task with time-of-flight PET. Phys Med Biol 54(2): 373-384.
