 Mini-Review
Abstract
Hypofractionated stereotactic radiotherapy (H-SRT) is a protocol of ionizing radiation delivery. It is now very important to characterize biological markers that could be used to determine the early efficiency of this type of treatment. The case reported here is a 53-yearold French male with renal adenocarcinoma treated by H-SRT for 3 sessions of 12 gray and who presents a complete remission with no progressive lesions after one year of follow up. The findings suggest that several biomarkers evaluated in the patient’s blood, such as immune cell frequencies, activation status or cytokine secretion, could be useful as an early predictor of prognosis after H-SRT.
Keywords: Immunology; Clinical Study; High Dose Hypo Fractionated Stereotactic Radiotherapy; Renal Adeno- Carcinoma
Introduction
Radiotherapy is commonly used in oncology to treat primary tumors or metastasis. However, this approach can be very toxic for surrounding healthy cells, which are also affected by the radiation. That is why new protocols of radiotherapy have been developed like high dose hypo fractionated stereotactic radiotherapy (H-SRT). H-SRT results in an improvement in overall survival with a reduced toxicity in healthy cells because it allows precise treatment delivery to the tumor [1]. To target more accurately the tumor site, H-SRT is based on a three-dimensional coordinate system. It allows delivery of the maximum dose of radiation directly to the tumor site, through ionizing radiations from many different angles with a millimeter precision. This system allows an adjustment to patient’s movements (such as breathing) to minimize exposure of healthy organs and tissues to radiation. This approach means that the radiation dose can be increased but also that treatment duration can be shortened [2]. Therefore H-SRT is more beneficial to patients and may also decrease the cost of treatment because of the reduced time and adverse effects [1].
High-dose irradiation is well known for its immunosuppressive effect, such as a substantial destruction of hematopoietic progenitors and lymphocytes [3]. There are potential radiation induced signals between ionized tumor cells and non-ionized healthy cells and vice versa. This phenomenon leads to radiation-related side-effects in cells that were not directly exposed to radiation; this is called the abscopal effect. After H-SRT, the abscopal effect is observed with a response on both targeted areas and non-targeted metastasis.
There is growing evidence showing that exosomes and cytokines secretion could play a key role in this radiation-induced systemic effect [4,5]. Exosomes are Nano-vesicles (30-120nm) actively secreted by various types of cells including healthy cells and tumor cells. Nevertheless, immune cells can secrete exosomes in higher amounts than other healthy cells types. They originate from intraluminal vesicles, formed inside the early multivesicular bodies (MVB) [4]. Exosomes are known for their involvement in intercellular communications and their abilities to transfer complex information to multiple and specific target cells [4].
Unlike exosomes secreted by normal cells, some tumor cells can secrete exosomes that carry an immunosuppressive message [6]. Tumor-secreted exosomes can inhibit the proliferation of natural killer cells (NKs) and CD4+/CD8+ T-cells by inducing their differentiation into immunosuppressive cells like regulatory T-cells (Tregs) or by inducing apoptosis in active effector T cells [4,7,8]. In fact, exosomes secreted by nasopharyngeal carcinoma cells have been shown to induce Treg expansion and to increase their immunosuppressive functions. All these modifications lead to an immunosuppressive microenvironment which plays a key role in the tumor’s escape from immune surveillance [9]. Likewise, exosomes released by human melanoma and colorectal carcinoma cells can promote monocytes’ differentiation into myeloid-derived suppressor cells, which also supports immune escape and, therefore, tumor growth [8]. In the context of this immunosuppressive microenvironment, tumor cells and tumor infiltrated macrophages will also secrete chemokines, known to attract Tregs that later infiltrate the tumor site [4]. Moreover, 24 hours after ionizing radiation in cases of squamous head and neck cancer, secreted exosomes may promote the survival of cancer cells inside and outside the radiation field.
Furthermore, this pro-survival effect is more pronounced with exosomes from irradiated cells compared to exosomes from nonirradiated cells [10]. Additionally, different studies have proven that serum concentration of some cytokines is increased after ionized radiation, like Tumor Necrosis Factor α (TNFα). TNFα is a proinflammatory cytokine known to play a role in tumor regression by enhancing cytolytic activity of NKs [11]. In contrast, levels of Interleukin 2 (IL-2) remain unchanged after radiation [11,12]. It is a key cytokine that primes and maintains Th1 and Th2 differentiation but induces regulatory T cells. IL-2 also allows the secretion of Interferon γ (IFN-γ) by Th1 cells as it plays an important role in anti-tumor immunity [13]. Finally, genomic instability of immune response-related genes might be linked to the abscopal effect. Indeed, studies have shown that mRNA expression of genes can vary after ionizing radiation.
For example, mRNA encoding for IFN-γ and TNFα increased while those for Transforming Growth Factor β (TGFβ) gene decreased [14]. In this study, we investigate the impact of high dose hypo fractionated stereotactic radiotherapy on immune cells and on secreted factors before, during, and after the protocol. The aim of this study is to evaluate, for the first time, different biological markers in order to identify prognostic markers for a patient who respond to H-SRT treatment. To reach this goal, composition and activation of peripheral blood mononuclear cells (PBMCs), as well as the frequency of induced Tregs and natural Tregs in this population will be monitored after ionization. Moreover, exosomes profile and function, cytokines secretion and transcriptional variations will be followed before, during, and after treatment.
Material and Methods
Patient Report
Mr M. R’s case is reported here. He is a 53-year-old man, who was suffering of metastatic renal adenocarcinoma with node metastasis (classification: T1aN1M1). Chemotherapy treatment had failed and Mr M.R was in case of cancer relapse. As a last line of treatment, Mr M.R was included in Early Bio clinical trial in September 2015 (ClinicalTrials.gov Identifier: NCT02439008). As part of this clinical trial, we benefit from all ethical authorizations for the presentation of this case study (informed consent of the patient, authorization of the Patient Protection Committee (PPC) and the National Agency for the Safety of Medicines and health products (ANSM)). Three sessions of high dose hypo fractionated radiotherapy were administered every 4 days during October 2015 (the 19th, 23rd and 27th). At the end of the follow-up protocol, one year after the end of the treatment (November 2016), Mr M.R was in complete response without any progressive lesions and showed evidence of an abscopal effect (both initial and metastatic tumor masses in regression).
Treatment and Samples
Patient’s tumor was precisely irradiated with 12 gray doses, 3 times during 8 days using the Cyberknife (Accuray, Sunnyville, Canada) robot in the Centre Oscar Lambret (Lille). Blood samples (2 dry tubes and 2 EDTA tubes) were collected at inclusion day before any treatment began (T0), 15 min after each irradiation sequences (T1 to T3), one week after the last irradiation (T4), and 3, 6, 9 and 12 months after the last session of H-SRT (T5 to T8).
PBMC Isolation
PBMC isolation was performed from two EDTA tubes of 8mL, just after blood collection by density gradient using lymphocyte separation medium (Eurobio, Les Ulis, France)). After centrifugation, diluted plasma was collected and stored at -80°C for later exosomes isolation and PBMC ring was recovered. Then PBMCs were washed twice in PBS (GIBCO, Life Techlogies, Paisley, UK) before counting. The biggest part of PBMCs were put in TRIzol reagent (Thermofisher, Walthman, USA) and stored at -80°C for later RNA isolation.
Flow Cytometric Analysis
The rest of patient’s PBMCs was analyzed by flow cytometry using FACS Canto II flow cytometer (BD Biosciences, Franklin Lake, USA). PBMCs were marked with four panels of fluochromeconjugated mAbs or appropriate isotype control mAbs (Miltenyi Biotec Bergisch Gladbach, Germany) in order to analyze: Cell types proportions, T-cells activation, natural Treg and induced Treg populations. Data were analyzed using the FlowJo software (ACEA Biosciences, San Diego, USA).
RT-qPCR
Total RNA from patient’s PBMCs were extracted using TRIzol reagent method according to the manufacturer’s instructions. RNA concentrations were measured with Nanodrop (ThermoScientific, Thermosphere, Waltman, USA). Reverse transcription was performed using 2µg of total RNA. Then qPCR reactions were performed according to the manufacturer’s instructions using 2X MESA GREEN qPCR Master Mix Plus for SYBR® 258
Assay (Eurogentech, Liège, Belgium) and the Mx3005PTM sequence detection system (Agilent technologies, Santa Clara, USA). All primers were designed and purchased from MWG-Biotech, Eberslery,Germany). Quantitative analysis was made based on the cycle threshold (CT) value for each well and calculated using MxPro software (Agilent technologies, Santa Clara, USA). To allow comparisons between time points, the relative gene expression was expressed in leading to arbitrary value of 1 for the reference point T0.
Exosomes Isolation and Functionality Assays
Exosomes were isolated from blood plasma using series of differential centrifugations and ultracentrifugations, as described elsewhere [9]. Then exosomes are purified on a sucrose cushion. Once isolated, exosomes are preserved at -80°C until further dosage and experiment. Before functional assays, exosomes were dosed using colorimetric Bradford (BIORAD Laboratories, Hercules, USA) method. Then 3,33µg/mL of exosomes were co-incubated with activated PBMCs from healthy donors. Proliferation was analyzed after 18h of incubation with [3H] thymidine (1µCi/well) (PerkinElmer) by measuring the radioactivity using a βcounter (1450 Trilux, Perkin Elmer, Walthman, USA) (after 72 hours of total incubation with exosomes as described eslwhere [9].
Cytokine Detection (ELISA)
Patient’s sera were collected after coagulation in two dry tube of 8mL. Sera were stored at 80°C until the entire sera collection for one patient was obtained. Enzyme-Linked ImmunoSorbent Assay (ELISA) tested sera for cytokines (IL10, IL12, IFN-γ, TGFβ and TNFα) (BD Pharmingen, Francklin lakes, USA) secretion as described elsewhere [9].
Results
Immuno-Monitoring of PBMCs
To investigate the effect of high dose H-SRT on the immune system, patient’s PBMCs have been tracked by immuno-monitoring. First T cells were distinguished from other cells by CD3+ labelling (Figure 1A). During treatment, the CD3+ marked cell population decreased from 65.2% to 18.5%, until one week after the last tumor radiation (T4). Then, 3 months after the last treatment, the T cell population increased to reach around 40% and stayed stable until the last blood sampling, one year after the last H-SRT (Figure 1A). To go further in cell identification, the other markers were CD4 (helper T cells), CD8 (cytotoxic T cells), CD11c (non-T myeloid cells), CD14 (monocytes), CD19 (B cells), and CD335 (NK cells) (Figure 1B). A general reduction of all these populations is observed all along the treatment until T4. Once the H-SRT was completed, all populations showed an increased frequency, especially the populations marked with CD11c (3,42% to 42,3%) and CD4 (11,4% to 33,7%). Only the frequency of NKs stayed stable during the entire clinical study (between 1,5 and 9,11%) (Figure 1B).
Then, different subpopulations of regulatory T lymphocytes expressing the CD4 marker were studied. First, natural Tregs (nTregs) were followed by CD4+/CD25high/CD127-/low labelling, those cells are known to regulate the immune response. In this case, the frequency of nTregs decreased during the post treatment follow-up: nTregs represent 6,5% of T cells marked with CD4 at T0 and 2.2% at T6. Moreover, one year after the last radiation treatment, this population drops to 0.113 % of CD4+ T cells. Figure 1C Secondly, induced Tregs (iTregs) were studied, they are naive T lymphocytes converted into regulatory T lymphocytes after immune response. Two different panels of markers are used to characterize iTregs: CD4+/CD18+/CD49b+ and CD4+/Lag3+/ Cd49b+. This patient had a population of iTregs relatively stable even if CD4+/CD18+/CD49b+ iTregs are more represented with a maximum frequency of 3.5% compared to a maximum of 0.5% for CD4+/Lag3+/Cd49b+ iTregs (Figure 1C). Finally, the non-T cells populations (CD3-) expressing CD11c were studied more precisely. Dendritic cells (DCs) population, characterized by CD3- CD11c+CD14 low labelling, decreased during treatment: 12% after the first irradiation and 3% one week after the end of the treatment. Then DC population increased around 20% at T5 and T6 and varies before returning at this level at T8 Figure 1D.
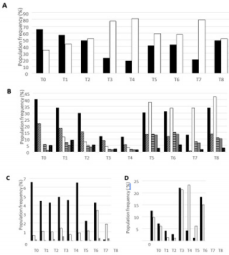
Figure 1: Frequency of different immune cell populations of Mr M. R’s PBMCs during the clinical study.
All these graph results were obtained from flow cytometry assay.
a) Frequency of CD3+ cells (black) and CD3- cells (white) in total PBMCs.
b) Frequency of different cell types in Mr M. R’s PBMCs: CD4 +, CD8 +, CD11c +, CD14+, CD19+ and CD335+.
c) Frequency of nTregs (in black) and iTregs (CD4+CD18+CD49b+ in white and CD4+Lag3+CD49b+ in grey) within CD4+ T lymphocytes. D) Frequency of dendritic cells (in black) and B lymphocytes (in white) in CD3- sub-population.
B cells, marked by CD3-CD11c+CD19+, decreased from 9,7 % at T1 to 1,1% at T4. Afterwards, an increase is observed with around 20% of B lymphocytes at T5 Figure 1D. Furthermore, due to a technical issue with the flow cytometry T0 results are not shown in this figure. Once distinguished, a focus has been made on the activation level of T CD4 and T cytotoxic lymphocytes. Fluorescence median of each marker, correlated with activation states, have been followed. CD4+ T cells marked with CD69 (early activation), CTLA-4 (down regulation of immune system) and HLADR (fluctuates following cell activation) had a peak of expression at the beginning of radiotherapy (T1), and at the end of the treatment (T5 and T8) Figure 2A. CD4+ T lymphocytes marked with CD69 and HLA-DR showed peaks of expression respectively at T5 and T8. In contrary to CD4+ T cells, CTLA4 marker decrease until T5 for CD8+ T cells. Furthermore, CD30 marker (late activation) on CD8+ T cells increased during the treatment and stabilized afterwards Figure 2B. Interestingly, the IL-2 receptor chain alpha, CD25, was relatively stable during all of the study on CD4+ T cells except at the end on the last blood collection with the highest fluorescence median (T8) Figure 2A. Moreover, this profile was also seen on CD8+ T cells Figure 2B.
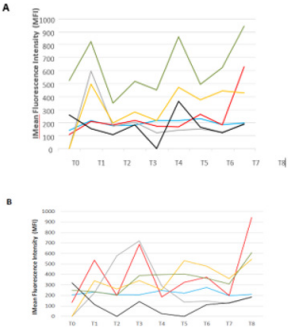
Figure 2: Activation state of immune cells populations during the clinical study.
Activation state of immune cells was measured by median fluorescence intensity (MFI) of
a) CD4+ T cells and
b) CD8+ T cells, CCR7 marker in blue ( ), CD25 in red ( ), CD30 in grey ( ), CD69 in yellow ( ), CTLA4 in black ( ) and HLADR in green ( ).
Secretome Study
Secondly, a focus has been made on secreted factors. The release of different cytokines was followed by ELISA in patient’s sera: IL-10 and TGFβ are immunosuppressive cytokines, and IL-2, INFγ and TNFα are pro-inflammatory cytokines. TNFα serum concentration, from T0 to T5, is between 40 and 53pg/mL. After the fifth blood collection, TNFα levels decreased to 7pg/mL and then lower than the detection threshold. Figure 3A INFγ secretion follows this same pattern between T0 and T3 with a concentration around 40pg/mL. Nevertheless, unlike TNFα, INFγ concentrations in sera decrease to 30pg/mL and stayed stable Figure 3A. IL-2 levels were undetectable during all the clinical study except for T6, where its concentration was about 3pg/mL Figure 3A. Then, the concentration of IL-10 was either very low (0.46 and 0.07pg/mL at T0 and T1) or under the detection threshold at the beginning of this study until T5, then it increased to 3pg/mL at T6 and then to 14.5pg/mL at T7 Figure 3B. Finally, TGFβ concentration in sera was under the detection threshold from T0 to T8 (Data not shown).
Finally, exosomes were extracted from patient’s plasma. They were then co-cultured with PBMCs of a healthy donor to test their ability to induce PBMCs proliferation, and so to activate an immune response. PBMCs proliferation was measured by [H]3Thymidine incorporation, and results are expressed in count per minutes (cpm). As seen in Figure 3C, patient exosomes between T0 and T3 do not have any effects on PBMCs proliferation compared to the positive control (around 110 000cpm). Afterwards, PBMCs’ proliferation increased until T5, where the higher signal was counted at 277 769cpm. Finally, there is a decrease in PBMC proliferation at the end of the clinical study, with a stabilization around 170 000 cpm between T7 and T8 Figure 3C.
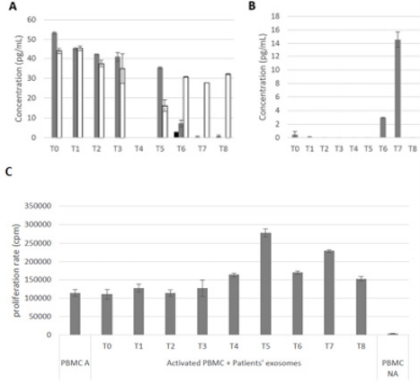
Figure 3: Study of the secreted factors from Mr M. R’s biological collection.
a) Concentration of anti-tumor cytokines: IL-2 (black) TNFα (Grey) and INFγ (White).
b) Concentration of pro-tumor cytokines secretion (IL-10) in patient’s sera. n=2.
c) The impact of exosomes on immune cells. Activated PBMCs (PBMC A) correspond to the positive control and nonactivated PBMCs (PBMC NA) to the negative control. PBMCs were activated by addition of phytohemagglutinin (1µg/mL) in culture medium and cultured with exosomes for 3 days. n = 3.
Gene Transcript Expression
Finally, to go further in the understanding of this mechanism, genes expression was followed by RT-qPCR. All the results were normalized regarding results obtain at T0, so Figure 4A shows all the relative results whereas figure 4B shows a summary, in a more comprehensible representation. Overexpression of almost all genes was observed except for CD25, which is under-expressed for T3, T4, T5 and T8. CD30 and CD80 genes were also under expressed 6 months after the last high dose H-SRT Figure 4A-4B.
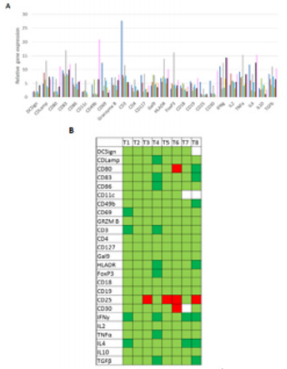
Figure 4: Evolution of patient’s gene relative expression during the clinical study.
a) Histogram representation of the evolution of relative gene expression, T1 is represented in blue ( ), T2 in red ( ), T3 in green ( ), T4 in grey ( ), T5 in light blue ( ), T6 in yellow ( ), T7 in black ( ) and T8 in pink ( ).
b) Squares represented in light green ( ) are for the genes overexpressed regarding their expression at T0, squares in dark green ( ) are for the genes largely overexpressed (10 folds higher compared with T0), squares in red ( ) are for the genes under-expressed and white squares have no data ( ). n = 2.
Discussion
In this case report, analysis by flow cytometry allows to evaluate the evolution of the blood frequency of different immune populations among patient’s PBMCs. This patient had equivalent populations of T cells (CD3+) and non-T cells (CD3-) Figure1A. Moreover, there was a high frequency of the T helper (CD4+) population: between 12 and 40% of PBMCs for this patient Figure 1B, knowing that in healthy individuals the frequency is around 4-20%. [15]. This percentage of CD4+ T lymphocytes can be correlated with the complete response to the high-dose H-SRT. During the study of CD4+ and CD8+ T lymphocytes, HLA-DR was largely expressed Figure 2A-2B. Moreover, HLA-DR expression represents the activation state of the immune system because it is needed in the process of antigen presentation, and thus required to mount an appropriate Th1 immune response. The marker CD30 decreased after T3 in CD4+ and CD8+ T cell populations. CD30 is a late activation maker, so this decrease can be explained by the ending of acute lymphocyte activation. The presence of CD30 during the radiotherapy is generally associated with a good prognostic and is described to stimulate quick apoptosis of cancer cells [16]. Furthermore, prolonged CD30 stimulation can cause cell cycle arrest in cells expressing CD30, in correlation with p21Waf1 expression, which is a cell cycle inhibitor dependent of the canonical NF-κB pathway [16].
The increase of CD69 marker at T1 and after T5 Figure 2A-2B showed the early action of effector T cells and CD8+ T cells, this will lead to protection against tumor growth. Finally, CD25 is largely expressed on T cells, especially on CD8+ cells (Figure 2B). As CD25 is the IL-2 receptor chain alpha and an anti-tumor cytokine, this activation is correlated with the patient’s complete response to the treatment. All these results seem to translate a good immune activation with an improvement of CD4+ and T CD8+ T lymphocyte activation and antigen presentation after treatment with the high dose H-SRT. This immunophenotype profile is well correlated with Mr M. R’s response to the treatment. Regarding nTregs and iTregs populations in this case, both populations stay relatively low, with an important reduction at T6 for nTregs (Figure 1C). This reduction of regulatory T populations can be correlated with the renewal of immune cell activation showed in Figure 3. In fact, the less the Tregs populations are present, the less the immune system is inhibited. This reduction in Tregs frequency is associated with a good prognostic because the anti-tumor immune response can remain active and is correlated with good patient condition at the end of the study.
Additionally, non-T cells seems to also have an important role, in fact, proportions of CD11cmarked cells increase after the treatment (Figure 1D). This population can be identified more accurately by CD3-/CD11C+/CD14low or CD3-/CD11C+/CD19+ labelling. The first population corresponds to dendritic cells and the second one to B cells. During the treatment, as show in Figure 1D, both DCs and B cells populations decrease. This can be explained by the wellknown effect of radiotherapy on hematopoietic cells [3]. Nevertheless, once the treatment by high dose H-SRT is completed this pool of CD11c+ cells rises. This means that high dose HSRT had no effect on hematopoietic progenitors, so the pools of DCs and B cells can be reestablishing. These results suggest that the recovery of CD11c+ subpopulations may translate the patient’s good response to the radiotherapy. Moreover, the increase in the frequency of CD14+ cells reinforces this suggestion if we consider that monocytes are myeloid progenitors. Cytokines secretion is correlated with the phenotypical immune-monitoring. Anti-tumor cytokines IFNγ and TNFα are secreted in important levels in contrary to pro-tumor cytokines such as IL-10, which inhibit the immune response by affecting effector cells. TGFβ remains undetectable and this absence is of good prognostic as TGFβ is known to disrupts antitumoral response by interfering with the activities of DCs, cytotoxic T lymphocytes and NK cells [17]. In addition, considering that TGFβ contributes to the emergence of Tregs, this result correlates well with the absence or low levels of Tregs. Cytokine secretions also match with Mr M. R’s response to the treatment. Indeed, IL-10 and TNFα could be good markers of tumor response to high dose H-SRT.
As seen in Figure 4, there is a general over expression of the genes studied, especially HLADR, IFNγ, IL-4 (induce the differentiation of naive T cells into Th2 lymphocytes). All these genes are associated with anti-tumor activity led by the activation of the immune system. Nevertheless, the CD25 gene is under expressed at T3, T5, T6 and T8, and TGFβ is overexpressed all through the study. These results could be in opposition regarding our other results and patient’s state. However, considering that TGFβ is part of a negative selfregulation loop, it could also be thought that if TGFB is transcribed but not secreted there could be a mechanism that actively blocks its secretion to prevent its immunosuppressive function. Finally, in Figure 3C patient’s exosomes lead to enhanced proliferation of PBMCs during the long-term follow-up when compared to the positive control. Therefore, in this case, patient’s exosomes had the ability to potently activate the immune system. This result is very promising because this patient is in total response so far. Moreover, clinical data exposed an abscopal effect starting from the first week after the end of radiotherapy with a reduction in the number of ganglionic metastasis.
This abscopal effect may be correlated with the immunoactivating abilities of Mr M. R’s exosomes. Additionally, this proliferation of PBMCs can be correlated with the flow cytometry profiles. In fact, the low percentage of Tregs observed in Figure 1C can also be explained by the immune-activation abilities of exosomes. Thus, the stimulatory effect exosomes have on PBMCs can be a very promising marker of early response to high dose H-SRT. In conclusion, data collected from the analysis of Mr M. R’s PBMCs and secreted factor corroborate to his physical and clinical condition. Some potential markers stood out such as: high levels of CD3+ and low levels of regulatory T cells, INFα, INFγ or IL-2 high concentration and IL-10 and TGFβ low concentration in serum. All these could be considered as prognostic factors of a good response to high dose hypo fractionated radiotherapy. Exosomes activity on the immune cells could also be a promising prognostic factor for HSRT patients. We could consider, for example, that a relapsed patient could produce suppressor exosomes or even less activators. To go further, it could be interesting to determine the nature of the exosomes, to know if they come from cancer cells or immune cells. Finally, at the end of the Early Bio clinical trial, all the 30 included patients will be studied to confirm this marker response profile.
References
- Fogh SE, Andrews DW, Glass J, Curran W, Glass C, et al. (2010) Hypofractionated Stereotactic Radiation Therapy: An Effective Therapy for Recurrent High-Grade Gliomas. J Clin Oncol 28(18): 3048-3053.
- Milano MT, Usuki KY, Walter KA, Clark D, Schell MC, et al. (2011) Stereotactic radiosurgery and hypofractionated stereotactic radiotherapy: Normal tissue dose constraints of the central nervous system. Cancer Treat Rev 37(7): 567-578.
- Manda K, Glasow A, Paape D, Hildebrandt G (2012) Effects of ionizing radiation on the immune system with special emphasis on the interaction of dendritic and T cells. Front Oncol 2: 102.
- Jelonek K, Widlak P, Pietrowska M (2016) The Influence of Ionizing Radiation on Exosome Composition, Secretion and Intercellular Communication. Protein Pept Lett 23(7): 656-663.
- Park B, Yee C, Lee KM (2014) The Effect of Radiation on the Immune Response to Cancers. Int J Mol Sci 15(1): 927-943.
- Pitt JM, André F, Amigorena S, Soria JC, Eggermont A, et al. (2016) Dendritic cell–derived exosomes for cancer therapy. J Clin Invest 126(4): 1224-1232.
- Théry C, Ostrowski M, Segura E (2019) Membrane vesicles as conveyors of immune responses. Nat Rev Immunol 9(8): 581-593.
- Valenti R, Huber V, Iero M, Filipazzi P, Parmiani G, et al. (2007) Tumorreleased microvesicles as vehicles of immunosuppression. Cancer Res 67(7): 2912-2915.
- Mrizak D, Martin N, Barjon C, Jimenez Pailhes AS, Mustapha R, et al. (2015) Effect of Nasopharyngeal Carcinoma-Derived Exosomes on Human Regulatory T Cells. JNCI J Natl Cancer Inst [Internet] 51(5): 33.
- Mutschelknaus L, Peters C, Winkler K, Yentrapalli R, Heider T, et al. (2016) Exosomes Derived from Squamous Head and Neck Cancer Promote Cell Survival after Ionizing Radiation. Plos One 11: e0152213.
- Ohba K, Omagari K, Nakamura T, Ikuno N, Saeki S, et al. (1998) Abscopal regression of hepatocellular carcinoma after radiotherapy for bone metastasis. Gut 43(4): 575-577.
- Shan YX, Jin SZ, Liu XD, Liu Y, Liu SZ, et al. (2007) Ionizing radiation stimulates secretion of pro-inflammatory cytokines: dose–response relationship, mechanisms and implications. Radiat Environ Biophys 46(1): 21-29.
- Liao W, Lin JX, Leonard WJ (2011) IL-2 Family Cytokines: New Insights into the Complex Roles of IL-2 as a Broad Regulator of T helper Cell Differentiation. Curr Opin Immunol 23(5): 598-604.
- Hashimoto S, Shirato H, Hosokawa M, Nishioka T, Kuramitsu Y, et al. (1999) The suppression of metastases and the change in host immune response after low-dose totalbody irradiation in tumor-bearing rats. Radiat Res 151(6): 717-724.
- WA10006-Frequencies_Cell_Types_Human_Peripheral_Blood.
- Wright CW, Rumble JM, Duckett CS (2007) CD30 activates both the canonical and alternative NF-kappaB pathways in anaplastic large cell lymphoma cells. J Biol Chem 282(14): 10252-1062.
- Kobie JJ, Akporiaye ET (2003) Immunosuppressive role of transforming growth factor beta in breast cancer. Clin Appl Immunol Rev 3(6): 277- 287.
