 Mini Review


Abstract
Background and Objectives: The questionnaire for the healthy life survey carried out in Berkshire, Buckinghamshire, Northampton shire and Oxford shire health authorities this survey was designed to study the adult population in 4 health authorities. The data is provided from this study in the form of SPSS file. I have to device three research questions or theories from the data provided and these questions should be examined and tested by applying the three statistical techniques a parametric test a non-parametric test and a kind of confidence interval.
Methods: The Two sample T Test is used for the parametric test the Chi Square Test is used for the non-parametric test to find out the association between the variables.
Results and Conclusion: Last Table in Article shows the statistics details and the 95% confidence intervals of the BMI of both males and the female’s i.e.
Standard error for male is = 0.12315
95% confidence interval mean for male is = 25.0753 and the 95% confidence interval for mean for lower bound is 24.833 and for upper bound is 25.317 for males.
Standard error for female is = 0.13679
95% confidence interval mean for female is = 24.4746 and the 95% confidence interval for mean for lower bound is 24.206 and for upper bound is 24.742 for females.
95% confidence interval mean of male and the female are slightly different statistically as proven.
Keywords: SPSS File; Research Question; Chi Square Test; P Value; Sample T Test
Introduction
The questionnaire for the healthy life survey carried out in Berkshire, Buckinghamshire, North amptonshire and Oxford shire health authorities this survey was designed to study the adult population in 4 health authorities. The data is provided from this study in the form of SPSS file. I have to device three research questions or theories from the data provided and these questions should be examined and tested by applying the three statistical techniques a parametric test a non-parametric test and a kind of confidence interval. The Two sample T Test is used for the parametric test the Chi Square Test is used for the non-parametric test to find out the association between the variables.
The Chosen Research Questions are as under
a) Diabetes mellitus in (sex) males and females its interpretation with Chi Square Test.
b) Comparison of weight of (sex) males and females with Two Sample T Test.
c) To find out the confidence interval with BMI and (sex) males and females.
Diabetes Mellitus in Males and Females its Interpretation with Chi Square Test (NON PARAMETERIC TEST): I am going to investigate how many males and the females have diabetes mellitus (diabetes mellitus and sex (male and female). I will use Chi Square Test for further interpretation.
Further we used exploratory analysis to get more information
Table 1 shows how many people have diabetes and what the percentage is and how many people do not have diabetes. Above table shows:
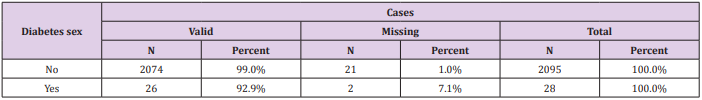
Table 1: Case Processing Summary.
a) 2074 persons do not have diabetes and 21 persons are missing total is 2095 people.
b) 26 persons have diabetes 2 are missing total is 28 people with diabetes.
c) Both the people having diabetes, or no diabetes completes 100% when includes missing persons i.e.
2095 = 100%.
28 = 100%.
Further we used histogram to show that how many male and female have diabetes in the data provided. The first part of histogram shows the frequency of male having diabetes which is more prominent as compare to female diagram and the second part shows the frequency of female having diabetes which shows less as compare to male (Figure 1). I am using the chi square test which is non parametric test in which we can compare two or more independent samples and the variable being compared puts people into categories.
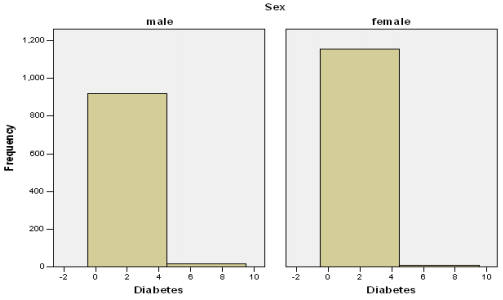
Figure 1:
A. Null Hypothesis (assumed to be true).
There is no any association between gender (sex=male & female) and diabetes mellitus.
B. Alternative Hypothesis
There is association between gender (sex=male & female) and diabetes mellitus.
I think the chi squared test is appropriate for this issue it is done by using descriptive analysis using cross tabs and by chi square test. Table 2 shows the case summary and details and it also shows the numbers of people 2138 in which the data of 38 people are missing, and we have valid data of 2100 people including male and the female Table 3 shows that from 936 males 18 have diabetes and 918 do not have diabetes and from 1164 females 8 have diabetes and 1156 females do not have diabetes and from total 2100 people 26 over all have diabetes which includes males and the females (Table 4) The test statistics shows that number of valid cases are 2100 and the ratio is 6.516 and the linear-by-linear association is 6.477, Pearson Chi-square is 6.480 and continuity correction is 5.508. The degree of freedom is =1 overall.
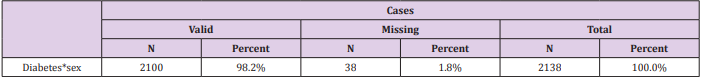
Table 2: Case Processing Summary.
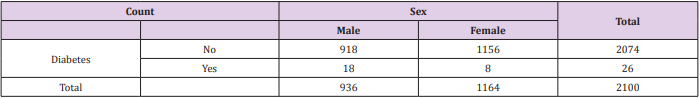
Table 3: Diabetes *sex crosstabulation.
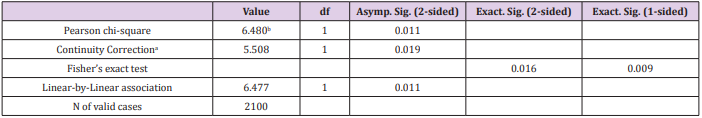
Table 4: chi-square tests.
a=computed only for a 2×2 table.
b=0 cells (.0%) have expected count less than 5. The minimum expected count is 11.59.
P value = < 0.011 overall and .019 for continuity correction.
As p value = <0.05 so it rejects the null hypothesis.
Therefore, it can be assumed that the alternative hypothesis is true as the p value = < 0.001 so it means that there is association between gender (sex=male & female) and diabetes mellitus and this association is proven statistically above. There is statistically significant evidence which demonstrates that the male diagnosed more diabetic as compare to female and there is association between gender (sex=male & female) and diabetes mellitus and this is proven statistically above.
Comparison of Weight of Males and Females with Two Sample T Test (PARAMETERIC TEST)
Here I want to compare the weight of the male and the female (sex) through two sample T test.
We used descriptive analysis to find out the results Table 5 shows total numbers of people are 2115 which are the valid numbers of males and females and the mean for weight in kg is 69.97. The standard deviation for sex is 0.497 and the standard deviation for weight in kg is 19.056. Then we used histogram to compare the weight of male and female as (Figure 2). The x axis shows the weight in kg and the y axis shows the frequency both for male and for the female and it shows that males are heavier than females. I am using the two sample T test a parametric test for the comparison of weights of the (sex) males and the females and our null and alternative hypothesis are as:
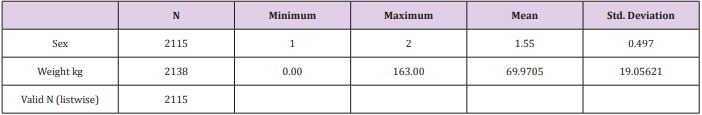
Table 5: Descriptive statistics.
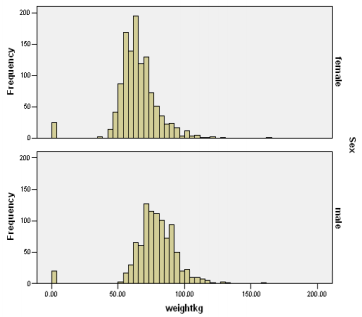
Figure 2:
A. Null Hypothesis: (assume to be true)
Males and the females have the same or equal weight and there is no any difference between their weight.B. Alternative Hypothesis: Males and females do not have the same or equal weight and the males are heavier than the females. There is difference between the weight of male and the female. Then we apply two sample T test to compare the weights of males and the female (sex) Table 6 shows the number of males is 944 and their mean weight are 78.31, standard deviation for males are approximately 17.006 and the standard error for males are 0.5535. Total numbers of females are 1171 and their mean weight are 64.621 and the standard deviation is 15.784 and the standard error is 0.461 for females. Table 7 shows that the t value of the variances assumed is 19.152 and the degree of freedom for this is 2113 and the mean difference is 13.689 with standard error difference of .71479 and the t value of the variances not assumed is 18.999 and the degree of freedom for this is 1949.6 and the mean difference is 13.689 with standard error difference of .72053. 95% confidence interval of the difference of lower of both variances assumed and not assumed are approximately 12.28 % and 95% confidence interval for the upper of variances assumed and not assumed is approximately 15.1 %.

Table 6: Group Statistics.
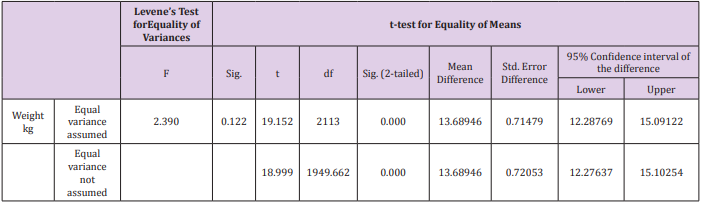
Table 7: Independent Samples test.
P value = 0.000 for both variances assumed and not assumed.
As p value = <0.05 so it rejects the null hypothesis.
Therefore, it can be assumed that alternative hypothesis is true and male and female have different weight and the mean weight of male is 78.31 and the mean weight of female is 64.62 in kgs. There is statistically significant evidence which demonstrates that the Males and females do not have the same or equal weight and males are heavier than the females. Medically males have more food intake as naturally required by the body and females have less food intake and less hunger naturally, males have faster metabolism than females they eat more than females and consume and store more calories than females. So, males are heavier than the females naturally. The height of the males is more than females and the bones of the males are much heavier than females due to more calcium deposition in bones of males than females. The structure of the females is smaller when comparing with male structure.
To find Out the Confidence Interval with BMI of (Sex) Males and Females
To find out the confidence interval with one interval i.e. BMI we use the descriptive statistics and then exploratory analysis to find out 95% confidence interval of BMI of unknown Table 8 shows the BMI of 2138 people in which 71 are missing and the valid numbers of people are 2067. Table 9 shows statistics about BMI of unknown and it is sure that 95% confidence interval for mean is approximately 24.742 and the 95% confidence interval for lower bound is 24.558 and for the upper bound is 24.926 and the standard error is 0.0937. Now I am calculating the 95% confidence interval with BMI of (sex) males and females by using descriptive statistics and by exploratory analysis Table 10 shows the valid number of males (923) and females (1144) and the missing data of 48 people for both males and the females and the total number of males are 944 and the total number of females are 1171. Table 11 shows the statistics details and the 95% confidence intervals of the BMI of both males and the female’s i.e.
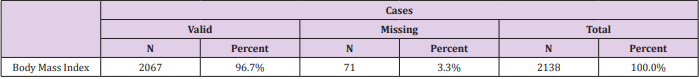
Table 8: Case Processing Summary.
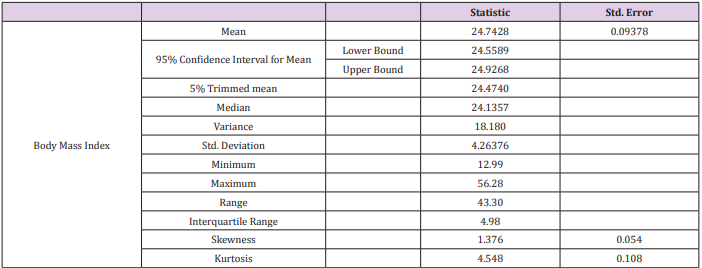
Table 9: Descriptives.
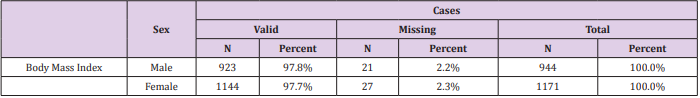
Table 10: Case Processing Summary.
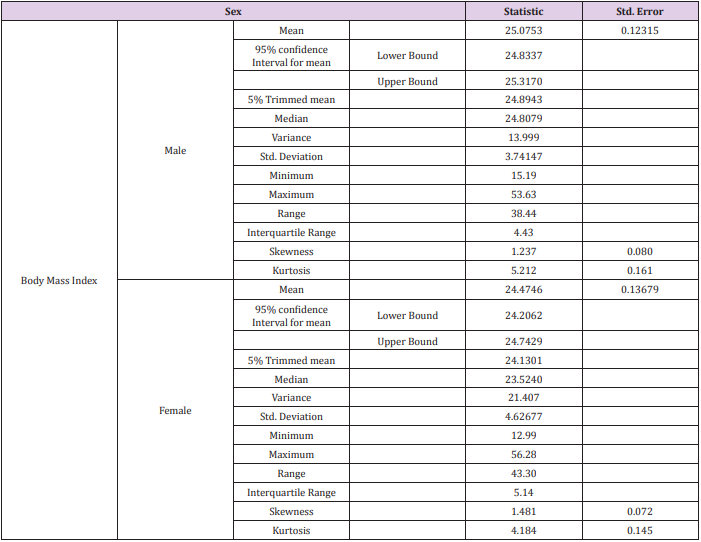
Table 11: Descriptives.
Standard error for male is = 0.12315
95% confidence interval mean for male is = 25.0753 and the 95% confidence interval for mean for lower bound is 24.833 and for upper bound is 25.317 for males.
Standard error for female is = 0.13679
95% confidence interval mean for female is = 24.4746 and the 95% confidence interval for mean for lower bound is 24.206 and for upper bound is 24.742 for females.
95% confidence interval mean of male and the female are slightly different statistically as proven above.
