 Research Article
Abstract
Objective: The value of pulse pressure variation (PPV) and other indexes including stroke volume variation (SVV), inferior vena cava diameter (IVCdmax), the dispensability index of the inferior vena cava (dIVC) measured by ultrasound were utilized to predict the fluid responsiveness in ventilated critically ill patients. In addition, we observed the effects of progressively increased positive end expiratory pressure (PEEP) on respiratory mechanical indexes and fluid responsiveness evaluation.
Methods: Forty-two patients were selected prospectively, and their indexes of mean airway pressure (Pmean), peak inspiratory pressure (PIP), (cardiac output) CO, (central venous pressure) CVP, PPV, ultrasonic measured SVV, IVCdmax and dIVC were recorded during ventilation. After volume expansion experiments, patients were divided into fluid responsiveness positive group and negative group. PEEP set to 5, 10 and 15cmH2O were recorded respectively. ROC curve was used to analyze the threshold of PPV, SVV, IVCdmax and dIVC and further to predict fluid responsiveness with their sensitivity and specificity. Moreover, the effects of increasing PEEP on indexes of Pmean, PIP, CO, CVP, PPV, SVV, IVCdmax and dIVC during ventilation were also observed in fluid responsiveness positive group and negative group.
Results: Among the forty patients, twenty-two patients were fluid responsiveness positive and eighteen patients were fluid responsiveness negative. ROC curve showed that area under the curve (AUC) of SVV was the highest. The figure of AUC was 0.98, other AUC figures were dIVC(0.95), PPV(0.94) and IVCdmax (0.85). Kappa test consistency analysis revealed the cut-off values of SVV, PPV and IVCdmax were 13.2%, 13.5% and 12.4%, which was consistent with the result of fluid responsiveness assessment. In fluid responsiveness positive group, IVCdmax and dIVC showed statistical significance between PEEP15 and PEEP0. However, for CO, SVV and PPV, there was statistical significance among PEEP10 and PEEP15 compared with PEEP0. CVP showed statistical significance among PEEP5 , PEEP10 and PEEP15 compared with PEEP0 . Hence, our data indicated that PEEP showed positive correlation with SVV (r=0.58, P=0.000), PPV (r=0.50, P=0.000, IVCdmax (r=0.35, P=0.001), and negative correlation with dIVC (r=-0.59, P=0.000). Nevertheless, in fluid responsiveness negative group, there was no statistical significance among PEEP5, PEEP10 and PEEP15 compared with PEEP0 in IVCdmax , dIVC and PPV. SVV only had statistical significance between PEEP15 and PEEP0. In addition, there was statistical significance among PEEP10 and PEEP15 compared compare with PEEP0 in CO. CVP showed statistical significance among PEEP, PEEP10 and PEEP15 compared with PEEP0. Therefore, our data suggested that PEEP was positive correlation with SVV (r=0.35, P=0.003), PPV (r=0.40, P=0.000, and no correlation with dIVC (r=-0.04, P=0.771).
Conclusion: Dynamic indexes such as SVV, dIVC and PPV are better than static index like IVCdmax for fluid responsiveness prediction. Moreover, PEEP could influence the measure of indexes during fluid responsiveness assessment, especially on fluid responsiveness positive patients. Trial registration: CHiCTR-OON-15006161
Keywords: Monitoring, Ultrasonic; End-Expiratory Pressure Peep; Fluid Responsiveness
Abbreviations: PPV: Pulse Pressure Variation; SVV: Stroke Volume Variation; IVCdmax: Inferior Vena Cava Diameter; PEEP: Positive End Expiratory Pressure; PIP: Peak Inspiratory Pressure; CO: Cardiac Output; CVP: Central Venous Pressure
Introduction
Previous studies have shown that in the process of fluid resuscitation of septic shock and other critically ill patients, fluid resuscitation deficiency and excess liquid load are related to poor prognosis in patients [1,2]. To improve tissue perfusion, the hemodynamic assessment of critically ill patients is an indispensable treatment step. The factors that decide whether the amount of liquid supplement is appropriate, not only refer to the capacity of blood vessels, but also include the capacity responsiveness. According to Frank-Starling’s law, in the curve ascending branch (preload depending region), load increase will make the stroke volume (stroke volume, SV) rise significantly. In the platform stage (preload independent area), the changes of preload will not affect the SV load and fluid increase will be harmful. Therefore, determining the position of patients in the curve, i.e. determining whether the patient has the capacity responsiveness is crucial. Previous statistics have manifested that in the intensive care unit (intensive care unit, ICU), the patients with sepsis and septic shock showing reactive capacity only account for 43.5%, and blindly expansion does not continuously improve the hemodynamic status of patients [3].
The commonly used indexes such as central venous pressure (central venous pressure, CVP) and other indexes are greatly affected by the static capacity of cardiovascular fitness, myocardial contractility, chest cavity pressure and other factors [4]. The value of volume status assessment is not high [5,6]. And the numerical value of preload cannot represent the capacity responsiveness of the body [4]. Pulse-induced Contour Cardiac Output (Pulseinduced Contour Cardiac Output, PiCCO) can dynamically reflect the changes of cardiac output (cardiac output, CO) and SV. Although PiCCO is regarded as the “gold standard” to assess the capacity responsiveness, the procedure of this method is cumbersome and the materials are expensive [7]. Furthermore, the modern critical care medicine attaches great importance to avoid unnecessary catheter for the reason that it may directly or indirectly increase the mortality through catheter-related bloodstream infection [8]. In the past two decades, critical care medicine has been gradually turning from the traditional high risk of invasive monitoring to the noninvasive monitoring.
Therefore, bedside ultrasound is well received by clinicians [9]. Another advantage of ultrasound is that, in a relatively short period (usually less than 30 min), it can provide complete information about blood vessels and hemodynamics. The index that bedside ultrasound evaluates the capacity status of patients includes static index and dynamic index. Many studies have confirmed that ultrasound static index not only has the advantages of convenient, noninvasive, but also can completely replace the invasive traditional index. It has been reported that the aspect ratio of internal jugular vein measured by ultrasound was less than 0.83 could predict CVP < 8cmH2 O [10]. Other reports suggested that the diameter of IVC was less than 2 cm could predict CVP < 10mmHg, and the sensitivity and specificity reached 85% and 81% respectively [11]. Additionally, for the patients whose breath were controlled by mechanical ventilation, the IVC diameter of end expiratory which was measured under short axis of the right atrium (The crosssectional view) using M model (M mode) of TTE and the right atrial pressure measured by SVC catheter were linear correlation [12].
However, using the effect of static ECHO parameters to predict fluid responsiveness in critically ill patients is poor unless the patients obviously show hypovolemia [13]. But in the modern ICU care level, patients with obvious hypovolemia are not common [14,15]. In the current clinic, using heart’s reaction to mechanical ventilation or spontaneous breathing cycle and the degree of variation of respiratory under intrathoracic pressure change, i.e. using “heart lung interaction” to observe SV changes of patients after cardiac preload affected by pleural pressure, could determine the capacity responsiveness of patients. These indexes include SVV (Stroke Volume Variation, SVV) [16], PPV (Pulse Pressure Variation, PPV) [3], artery VTI (velocity-time integral, VTI) [14], the variation of SVC [17] and IVC [13,18] and other indexes. The treatment process of the critically ill patients with respiratory failure hemodynamics instability, is always needed to apply noninvasive positive pressure mechanical ventilation. And positive end expiratory pressure (positive end expiratory pressure, PEEP) is a commonly used function in mechanical ventilation settings. But the existence of PEEP can reduce the pressure gradient to decrease venous reflux by increasing intrathoracic pressure and lung volume, which would cause hemodynamic changes [19].
However, the effect of PEEP on the dispensability index of the inferior vena cava (the dispensability index of the inferior vena cava, dIVC), inferior vena cava diameter (IVCdmax) and other respiratory variability indexes of patients measured by ultrasound has not been reported until now. In this study, SVV, dIVC dynamic indexes and IVCdmax static index of the same group of critically ill patients were measured by monitoring the PPV and ultrasound, to further explore the application value of the above indexes in the capacity responsiveness evaluation of patients with mechanical ventilation, and to analyse the effect of PEEP on the mechanical ventilation index and common clinical capacity evaluation index including the above indexes.
Materials
The Research Object
The Research Object: 42 patients needed mechanical ventilation in department of ICU of the Second Affiliated Hospital of Anhui Medical University from February to November in 2014 (20 male and 22 female aged from 22 to 72 years, average age: 47.45±13.28). Acute physiology and chronic health evaluationⅡ(APACHⅡ): 13.48±3.53. The 42 patients are including 17 septic shock patients with perforation of colon resulting in diffuse peritonitis, 10 severe pneumonia patients, 6 severe acute pancreatitis patients, 6 liver and spleen rupture complicated hemorrhagic shock, and 3 upper gastrointestinal hemorrhage.
Inclusion Criteria:
a) Patients had invasive mechanical ventilation; vasoactive agent wasn’t used or had been evacuate
b) sinus rhythm.
Exclusion Criteria:
a. Existing fluid infusion test contraindication (acute coronary syndrome, cardiogenic shock and evidence showing overload fluid)
b. being obvious right ventricular dysfunction, right heart failure and tricuspid regurgitation
c. being younger than 18 years of age
d. being gestation
e. being intra-abdominal hypertension, bladder pressure measured by catheter >16cmH2O
f. existing pneumothorax or pulmonary bulla Without drainage.
Conforming to the standards of medical ethics, this study was approved by hospital ethics committees. All treatments and inspections had informed consent of the patients or their families.
Research Methods
Mechanical Ventilation Mode and Parameter Setting: Using midazolam and/or propofol gave patients sedation. Breathing machine (PB840) of Nellcor Puritan Bennett (America) was used in invasive mechanical ventilation, Assist/Control mode, VT: 6~8ml/ Kg, keeping breathing frequency: PaCO2 =35~45mmHg. From right subclavian or jugular vein into central venous catheters, imbedding arterial puncture tube from radial artery puncture, all connecting Intellivue MP60 monitor (Phillips, Germany) monitoring HR, ABP, CVP, ECG and SpO2 . Initial setting PEEP=0, recording PIP and Pmean; ultrasonic measured and recorded each index in the meantime. Then fluid responsiveness test was conducted, after which each index was recorded again. Hereafter PEEP was increased to 5, 10, 15 cmH2 O respectively for 5min, then PIP and Pmean were recorded again, with each indexes being measured and recorded by ultrasound. During the above steps, test would be stopped if the indexes showed Pmean>35mmHg or PIP> 45mmHg.
Ultrasonic Testing and PPV Monitoring Method: In complete mechanical ventilation control mode, below indexes were measured by M-Turbo bedside portable ultrasonic apparatus of SonoSite (America): ①CO (cardiac output) ②measuring SV and recording SVV %=(SVmax﹣Svmin)/SVmean, SVmax and SVmin being the mean value of 4 values in 30s, SVmean being the mean value of all values. ③Measurements of IVCdmax , IVCdmin and dIVC were performed from long-axis 2-dimensional subxiphoid views using M mode (Figure1), All measurements were made within 2 cm of the RA origin of the IVC(Figure2), dIVC= (IVCdmax − IVCdmin)/0.5(IVCdmax + IVCdmin) [13]. Ultrasonic testing were respectively conducted by an experienced ultrasound diagnostics doctor and a trained ICU doctor. Each observation indicator was took the average after being measured three times. During mechanical ventilation, the arterial pressure waveform was drawn from invasive arterial pressure monitor, recording PPmax and PPmin, PPV(%)=( PPmax-PPmin) /[(PPmax+PPmin)/2]×100%[20].
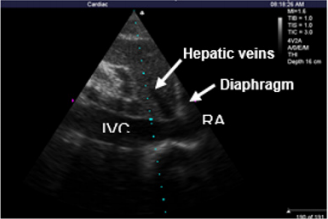
Figure 1: The IVC diameter can be measured at 1 to 2 cm caudal to the hepatic vein–IVC junction.
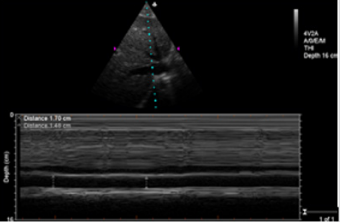
Figure 2: Respiratory variations in IVC.
The Positive Criteria of Volume Expansion Test: After intravenous drip 500ml normal saline (NS) in 20min, Patients were classified as responders to fluid loading if their CO increased under TTE by at least 15%[4]. The test would be stopped if patients had overload clinical manifestations (shortness of breath obviously, lung moist rale increasing or aggravated myocardial ischemia indicated by electrocardiogram).
Main Outcome Measures: ①The threshold value, sensitivity and specificity of PPV, SVV, IVCdmax and dIVC to predict fluid responsiveness in ventilated critically ill patients; ②The effects of increasing PEEP on indexes of Pmean, PIP, CO, CVP, PPV, SVV, IVCdmax and dIVC during ventilation in fluid responsiveness positive and negative groups separately.
Statistic: By SPSS 17.0, Measurement data being recorded in ( ±s), pair T test, independent-samples T test; Receiver operator characteristic curve (ROC) was be used in analyzing the value of SVV, PPV, IVCdmax and dIVC predicting fluid responsiveness showed by area under the curve (AUC) (95%CI); Kappa consistency check the consistency of SVV, PPV and dIVC predicting fluid responsiveness; Between-Subjects factors were compared by variance analysis and linear trend test; pairwise comparison was conducted by dunnet-t; variable correlation was analyzed by spearman correlation analysis; P<0.05 was regarded as statistical significance.
Results
Basic Information
In the 42 Volume Expansion Tests, 2 Cases were Stopped because of Volume Overload: As a result, 22 of the finally volume load tests were positive and 18 were negative. With PEEP increasing, pneumothorax and other complications didn’t happen. There were no statistically differences of PIP, Pmean, CVP, SVV, PPV, IVCdmax and dIVC between before and after volume expansion tests. However, CO increased significantly (P=0.00). With different PEEP, TTE indexes of positive group and negative group were showed in Table 1 and Table 2.
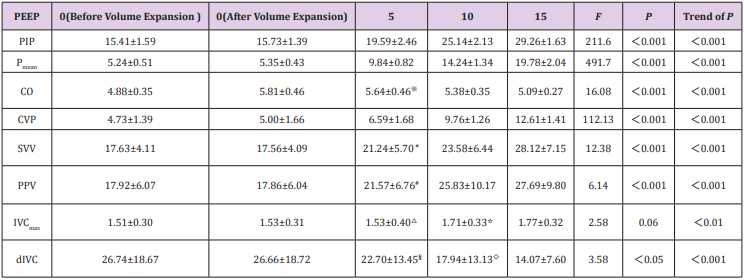
Table 1: TTE indicators of different PEEP in fluid responsiveness positive group.
Note:1. Comparison between before volume expansion test and after:PIP(P=0.48)、Pmean(P=0.44)、、CO(P=0.00) 、CVP(P=0.56)、SVV(P=0.96)、PPV(P=0.97)、IVCdmax(P=0.83)、dIVC(P=0.99); 2. Comparison with PEEP0 cmH2 O(after volume expansion test):※:P=0.29;*:P=0.11;﹟: P=0.33; △:P=0.63;☆ :P=0.14;§: P=0.66;◇: P=0.10;all of others :P<0.05.
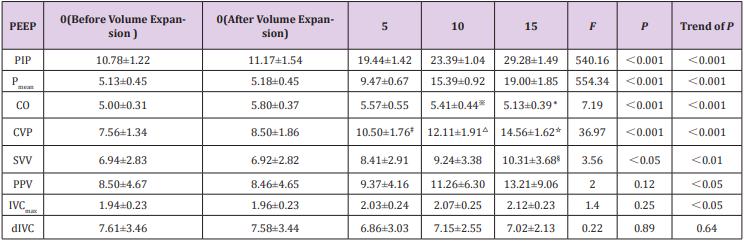
Table 2: TTE indicators of different PEEP in fluid responsiveness negative group.
Note:1. Comparison between before volume expansion test and after::PIP(P=0.41)、Pmean (P=0.74)、CO(P=0.00) ;CVP(P=0.09);SVV(P=0.98);PPV(P=0.98);IVCdmax(P=0.80)、dIVC(P=0.98); 2. Comparison with PEEP0 cmH2 O(volume expansion test):※:P=0.03;*:P=0.00;﹟: P=0.00; △:P=0.00;☆:P=0.00 ;§: P=0.01;all of others :P<0.05.
SVV, PPV, IVCdmax and dIVC Predicting Fluid Responsiveness Analyzed by ROC Curve: The area under ROC curve (AUC) for PPV predicting fluid responsiveness was 0.94 (95%CI: 0.89~0.98, P<0.001). The PPV threshold value of 13.5% before volume expansion had the sensitivity of 94.3% and the specificity was 84.7 % for prediction of fluid responsiveness. The AUC for SVV predicting fluid responsiveness was 0.98 (95%CI: 0.97~1.00, P<0.001). The SVV threshold value of 13.2% before volume expansion had the sensitivity of 98.9% and specificity of 88.9% for prediction of fluid responsiveness. The AUC for dIVC predicting fluid responsiveness was 0.95(95%CI: 0.91~0.98,P<0.001). The dIVC threshold value of 12.40% before volume expansion had the sensitivity of 80.7% and specificity of 98.6% for prediction of fluid responsiveness. (Figure 3). The AUC for IVCdmax predicting fluid responsiveness was 0.85(95%CI: 0.79~0.91,P<0.001), the IVCdmax threshold value of 2.03 before volume expansion had the sensitivity of 68.1% and specificity of 94. 3% for prediction of fluid responsiveness (Figure 4).
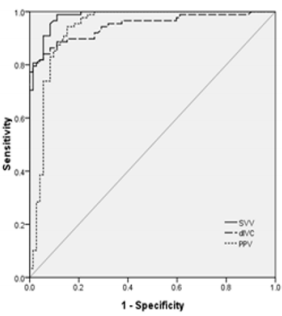
Figure 3: ROC curve of SVV, dIVC, PPV predicting fluid responsiveness.
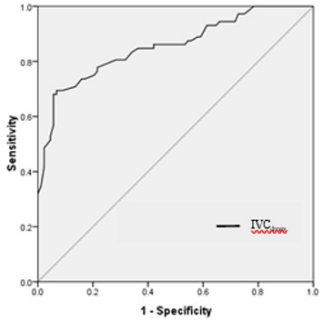
Figure 4: ROC curve of IVCdmax predicting fluid responsiveness.
Kappa Test Consistency Analysis of SVV, PPV and dIVC Predicting Fluid Responsiveness: According to ROC results, taking SVV > 13.2, PPV>13.5 and dIVC>12.4 as the cutoff value of fluid responsiveness to consistently analyze the results, showing that the Kappa coefficient of SVV and PPV was 0.729,P<0.001; The Kappa coefficient of SVV and dIVC was 0.607, P<0.001; The Kappa coefficient of PPV and dIVC was 0.607, P<0.001.
The influence of PEEP on airway pressure and TTE indices
a) In fluid responsiveness positive group, with PEEP increasing, there are overall differences among groups about PIP, Pmean, CVP, CO, SVV, PPV and dIVC (P<0.05). IVCdmax increased with PEEP, there are no significant differences in comparison among groups (P>0.05), while there are significant differences in linear trend (P<0.01). After pairwise comparison between PEEP5 , PEEP10, PEEP15 and PEEP0 (after volume expansion test, the following are the same) respectively by Dunnet-t, there were significant differences of IVCdmax and dIVC between PEEP15 and PEEP0 , while there were significant differences of CO, SVV and PPV between PEEP10, 15 and PEEP0 . There were significant differences of CVP between PEEP5 , 10, 15 and PEEP0 (Table 1).
b) In fluid responsiveness negative group, with PEEP increasing, there are overall differences among groups about PIP, Pmean, CVP, CO and SVV(P<0.05). PPV and IVCdmax increased with PEEP, there are no significant differences in comparison among groups (P>0.05), while there are no significant differences linear trend (P<0.05). dIVC increased with PEEP, there are no significant differences in comparison among groups and linear trend (P>0.05). After between PEEP5 , PEEP10, PEEP15 and PEEP0 respectively by Dunnet-t, there were no significant differences between PEEP5 , 10, 15 and PEEP0 respectively about IVCdmax, dIVC and PPV; there were significant differences between PEEP15 and PEEP0 about SVV. There were significant differences between of PEEP10, 15 and PEEP0 respectively about CO. There were significant differences between PEEP5 , 10, 15 and PEEP0 respectively about CVP (Table 2).
c) Spearman Variable Correlation Analysis: In fluid responsiveness positive group, There are positive correlation between the SVV(r=0.58,P=0.000), PPV(r=0.50,P=0.000 ), IVCdmax(r=0.35,P=0.001)and PEEP respectively. There are negative correlation between the CO(r=-0.60,P=0.000 ), dIVC(r=-0.59,P=0.000)and PEEP respectively. In fluid responsiveness negative group, there are positive correlation between the SVV(r=0.35,P=0.003)、PPV(r=0.40,P=0.000 ), IVCmax (r=0.28,P=0.019)and PEEP respectively. There are negative correlation between the CO and PEEP(r=-0.54,P=0.000 ); it had no correlation between dIVC and PEEP (r=-0.04 ,P=0.771).
Discussion
The Value of SVV, PPV, dIVC and IVCdmax Evaluating Fluid Responsiveness
Using three dynamic indicators (SVV, PPV and dIVC) in our study, we selected 13.2%, 13.5% and 12.4% as cut-off values respectively to evaluate fluid responsiveness. They all have sensibility and specificity. Kappa consistency test analysis suggested that the results had consistency. When positive pressure ventilation patients are in inspiratory phase, many factors lead to the increase of SV and PV, including transpulmonary pressure increase compresses the pulmonary vasculature, left ventricular preload increase and pleural pressure increase., aortic vascular transmural pressure decrease, left ventricular afterload decrease, right atrial filling decrease, ventricular septal shift right inducing left ventricular filling increase, while the right ventricular RV pressure decrease reducing the pericardium, left ventricular to pulmonary venous factors venous return. Whereas exhale opposite [21]. Therefore, the sensitivity of the two indicators is very high, reaching 98.9% and 94.3% respectively. Researches by the Feissel [13] have indicated that the sensitivity and specificity are 93% and 92% respectively when 12% as a cut-off value to predict the volume responsiveness.
It is similar to the results of this study. The sensitivity of dIVC is 80.7%, lower than the other two. Considering that IVC locates in the abdominal cavity, the diameter of the respiratory variability is not only affected by the heart-lung interaction, but also relevant to the venous external pressure produced by the movement of diaphragmatic with the respiratory changes of thoracic abdominal cavity and right atrial pressure (RAP) gradient. Nevertheless, the sensitivity of dIVC is still much lower than previous report (93%) [13]. It considers that many patients after abdominal operation in this group influence the measurement of IVC by TTE. IVCdmax is a static volume indicator. When positive pressure ventilation patients are in inspiratory phase, the diaphragm decrease, intraabdominal pressure increase, RAP gradient increase, the inferior vena cava filling and the effect is largest to end inspiration [22]. The ROC curve analysis results by TTE to measure IVCdmax to evaluate capacity responsiveness in this study show that using IVCdmax 2.03 as the threshold value before fluid load to predict the sensiti fluid responsiveness is 68.1%, the specificity is 94.3%.
By comparing IVC diameter, CVP [4,11,23] and RAP [12] through the TTE, previous research considers that it has a good correlation between them. This study also suggests that although IVCdmax is a static volume indicator, it still shows the value of better prediction of fluid responsiveness to a certain degree. This may be related to these reasons such as there are mostly surgical patients in this group, the average age is less than 50 years, previous heart-lung function better, less complication, less factors effect on static volume indicator. But the area under ROC curve of IVCdmax is significantly lower than SVV, PPV and dIVC, suggesting that the value of dynamic volume indicator is better than the static volume indicator.
The Effect of PIP, Pmean, CO and CVP on PEEP
The optimal PEEP can dilate small airway throughout the respiratory cycle and maintain the end expiratory alveolar open, increase functional residual capacity (FRC), improve the chest wall compliance, reduce the elasticity resistance of respiratory system. The setting of PEEP increases transpulmonary pressure and pleural cavity pressure, thereby increasing the airway pressure when positive pressure ventilation. This study finds that the values of PIP and Pmean in all patients of the volume expansion test (+) and (-) group significantly rise with the increase of PEEP, P value and P value trend are both less than 0.001 between groups. This result indirectly suggests that high PEEP setting may lead to excessive overexpansion of the lungs and produce lung injury. With the increase of PEEP, CO of both groups decreases. This is also related to the decline of cavity venous return induced by intrathoracic pressure increase caused by PEEP, the reduction of right ventricular preload, eventually the decline of left ventricular stroke volume. But there are no statistical differences comparing PEEP5 and PEEP0 of CO in two groups, suggesting that the body can play a compensatory function to a certain extent to offset the adverse effects on the circulation after a slight increase in PEEP. As a traditional volume evaluation indicator, CVP has extensive application in clinic. But as a static pressure marker, it is influenced by cardiac function of patients, compliance of thorax and many other factors. The changes of pleural pressure that caused by PEEP becomes the important factor of the pressure changes of the superior venous located at thorax. The data also indicates when PEEP reaches 5 cmH2 O, volume expansion test (+) and (-) group show statistical difference comparing with PEEP0 .
The Effect of PEEP on SVV, PPV, dIVC and IVCdmax of Volume Expansion Test (+) Group
This research discuses that the effect of PEEP on the dynamic capacity indicators such as SVV, PPV and dIVC in volume expansion test (+) and (-) group. The results show when PEEP reaches 10 cmH2 O, SVV and PPV both have statistical differences comparing with PEEP0 in volume expansion test (+) group. However, dIVC shows statistical difference comparing with PEEP0 when PEEP reaches 15 cmH2 O, suggesting that dIVC is slight affected by PEEP in a certain range. This is consistent with the result of the high specificity of evaluation capacity reaction of dIVC as stated above. Spearman variate relativity analysis shows that SVV and PPV are positive correlation with PEEP, as confirmed by previous researchers [24]. In positive pressure ventilation patients on the basis of LVSV increase with inspiratory phase, PEEP may make the lung expansion and left ventricle extrusion, and further intensify SV of the inspiratory phase. However, PEEP increases intrathoracic pressure, leads to further decrease LVSV with expiratory phase, and make SVV and PPV increase. With the increase of PEEP, intraabdominal pressure further increases, and RAP gradient increases [25]. This study shows that IVCdmax gradually increases in the volume expansion test (+) group and P value between groups is less than 0.01. The IVCdmax values of PEEP15 and PEEP0 have statistical differences.
This result is consistent with the research by Schefold [23]. With the increase of PEEP, dIVC of the volume expansion test (+) group gradually decreases, P value between groups is less than 0.05, and the trend of P value is less than 0.001. The dIVC values of PEEP15 and PEEP0 have statistical differences. Spearman variate relativity analysis shows that dIVC is negative correlation with PEEP. The reason of above results may be that the setting of PEEP leads to IVC diameter increases in end inspiration, IVC diameter increases in end expiration and increases more than end inspiration, thus make dIVC decrease. Kircher [26] thinks that collapsibility index less than 50% is effective indicator to evaluate right atrium more than 10 mmHg, using inferior vena cava collapsibility index (IVCCI) to evaluate right atrium pressure of autonomous respiration patients. It also suggests that higher right atrium pressure, less breath variety of IVC. The animal model test of Duperret S1 [27] demonstrates that abdominal cavity pressure increasing leads to breath variety of IVC decrease, especially hypovolemia. These results indirectly verify our conclusion.
The effect of PEEP on SVV, PPV, dIVC and IVCdmax of Volume Expansion Test (-) Group
In volume expansion test (-) group, SVV and PPV are positive correlation with PEEP increase. SVV shows statistical difference comparing with PEEP0 when PEEP reaches 15 cmH2 O. With the increase of PEEP, the trend of P value of IVCdmax is less than 0.001. But there are no statistical differences between increase groups and PEEP0 . P value the trend of P value of dIVC between groups is more than 0.05. Spearman variate relativity analysis shows that PEEP has no correlation with dIVC. The research about SVV by Michard et al. [19] reports that the positive correlation between PEEP and SVV is related to preload state. Our study about volume expansion test (+) and (-) group comparison indicates that the effect of PEEP on dynamic capacity responsiveness evaluation indicator is related to the location at starling curve of patients. This effect is more significant when locating on the steep rather than on the flat portion of the Frank-Starling curve. In the condition of full preload, the self-regulating mechanism of patients work, dynamic capacity responsiveness evaluation indicator is less influenced by PEEP.
This study selects various cases including many related diseases and the different pathophysiological states may affect the results. For example, although the IAP > 16 cmH2O intraabdominal hypertension patients have been ruled out in this group, but some patients experienced abdominal operation, abdominal wall compliance decrease causing by abdominal postoperative may influence the results of this study [28]. The effect of PEEP settings on respiratory mechanics in patients not only reflects on the changes of the intrathoracic pressure and transpulmonary pressure, but also the increase functional residual capacity and/ or a decrease pulmonary vasoconstriction induced by hypoxia to change the heart load [19]. Thus, it has an impact on the dynamic volume responsiveness evaluation. This study is according to the classic volume load test standard [4], using 500 ml saline to carry out volume load test (+). Although there are no significant differences between parameters of the (+) groups before and after the load test, but it cannot avoid the interference of observing PEEP influence caused by preload increase. These need to design more strict animal experiments and clinical studies in the future to further elucidate the internal relationship.
Acknowledgement
This work was supported by the Scientific and technological project of Anhui Province (Grant No. 1301042206). Anhui Provincial Natural Science Foundation (Grant No. 1508085QC49), and the doctoral research fund project of the Second Affiliated Hospital of Anhui Medical University (Grant No.2014BKJ034).
References
- Marik PE, Levitov A, Young A, Andrews L (2013) The use of Bioreactance and Carotid Doppler to determine volume responsiveness and blood flow redistribution following passive leg raising in hemodynamically unstable patients. Chest 143(2): 364-70.
- Machare Delgado E, Decaro M, Marik PE (2011) Inferior vena cava variation compared to pulse contour analysis as predictors of fluid responsiveness: a prospective cohort study. J Intensive Care Med 26(2): 116-124.
- Préau S, Saulnier F, Dewavrin F, Durocher A, Chagnon JL (2010) Passive leg raising is predictive of fluid responsiveness in spontaneously breathing patients with severe sepsis or acute pancreatitis. Crit Care Med 38(3): 819-825.
- Levitov A, Marik PE (2012) Echocardiographic assessment of preload responsiveness in critically ill patients. Cardiol Res Pract, pp. 819696.
- Marik PE, Baram M, Vahid B (2008) Does central venous pressure predict fluid responsiveness? A systematic review of the literature and the tale of sevenmares. Chest 134(1): 172-178.
- Kumar A, Anel R, Bunnell E, Habet K, Zanotti S, et al. (2004) Pulmonary artery occlusion pressure and central venous pressure fail to predict ventricular filling volume, cardiac performance, or the response to volume infusion in normal subjects. Criti Care Med 32(3): 69-69.
- Wetterslev M, Haase N, Johansen RR, Perner A (2013) Predicting fluid responsiveness with transthoracic echocardiography is not yet evidence based. Acta Anaesthesiol Scand 57(6): 692-697.
- Pronovost P, Needham D, Berenholtz S, David Sinopoli, Haitao Chu, et al. (2006) An intervention to decrease catheter-related bloodstream infections in the ICU. N Engl J Med 355(26): 2725-2732.
- Huang SJ, Mc Lean AS (2010) Do we need a critical care ultrasound certification program? Implications from an Australian medical-legal perspective. Crit Care 14(3): 313.
- Keller AS, Melamed R, Malinchoc M, John R, Tierney DM, et al. (2009) Diagnostic accuracy of a simple ultrasound measurement to estimate central venous pressure in spontaneously breathing, critically ill patients. J Hosp Med 4(6): 350-355.
- Prekker ME, Scott NL, Hart D, Sprenkle MD, Leatherman JW, et al. (2013) Point-of-Care Ultrasound to Estimate Central Venous Pressure: A Comparison of Three Techniques. Crit Care Med 41(3): 833-841.
- Bendjelid K, Romand JA, Walder B, Suter PM, Fournier G (2002) Correlation between measured inferior vena cava diameter and right atrial pressure depends on the echocardiographic method used in patients who are mechanically ventilated. J Am Soc Echocardiogr 15(9): 944-949.
- Feissel M, Michard F, Faller JP, Teboul JL (2004) The respiratory variation in inferior vena cava diameter as a guide to fluid therapy. Intensive Care Med 30(9): 1834-1837.
- Feissel M, Michard F, Mangin I, Ruyer O, Faller JP, et al. (2001) Respiratory changes in aortic blood velocity as an indicator of fluid responsiveness in ventilated patients with septic shock. Chest 119(3): 867-873.
- Marik PE, Cavallazzi R, Vasu T, Hirani A (2009) Dynamic changes in arterial waveform derived variables and fluid responsiveness in mechanically ventilated patients: a systematic review of the literature. Crit Care Med 37(9): 2642-2647.
- Michard F, Teboul JL (2000) Using heart-lung interactions to assess fluid responsiveness during mechanical ventilation. Crit Care 4(5): 282-289.
- Vieillard-Baron A, Chergui K, Rabiller A, Peyrouset O, Page B, et al. (2004) Superior vena caval collapsibility as a gauge of volume status in ventilated septic patients. Intensive Care Med 30(9): 1734-1739.
- Barbier C, Loubières Y, Schmit C, Hayon J, Ricôme JL, et al. (2004) Respiratory changes in inferior vena cava diameter are helpful in predicting fluid responsiveness in ventilated septic patients. Intensive Care Med 30(9): 1740-1746.
- Michard F, Chemla D, Richard C, Wysocki M, Pinsky MR, et al. (1999) Clinical use of respiratory changes in arterial pulse pressure to monitor the hemodynamic effects of PEEP. Am J Respir Crit Care Med 159(3): 935-939.
- Westphal G, Garrido Adel P, de Almeida DP, Rocha e Silva M, Poli-deFigueiredo LF (2007) Pulse pressure respiratory variation as an early marker of cardiac output fall in experimental hemorrhagic shock. Artif Organs 31(4): 284-289.
- Cavallaro F, Sandroni C, Antonelli M (2008) Functional hemodynamic monitoring and dynamic indices of fluid respon siveness. Minerva Anestesiol 74(4): 123-125.
- Mandeville JC, Colebourn CL (2012) Can transthoracic echocardiography be used to predict fluid responsiveness in the critically ill patient? A systematic review. Crit Care Res Pract 2012: 513480.
- Schefold JC, Storm C, Bercker S, Pschowski R, Oppert M, et al. (2010) Inferior vena cava diameter correlates with invasive hemodynamic measures in mechanically ventilated intensive care unit patients with sepsis. J Emerg Med 38(5): 632-637.
- Pizov R, Cohen M, Weiss Y, Segal E, Cotev S, et al. (1996) Positive endexpiratory pressure-induced hemodynamic changes are reflected in the arterial pressure waveform. Crit Care Med 24(8): 1381-1387.
- Jakob SM, Knuesel R, Tenhunen JJ, Pradl R, Takala J (2010) Increasing abdominal pressure with and without PEEP: effects on intra-peritoneal, intraorgan and intra-vascular pressures. BMC Gastroenterology 10(4): 70.
- Kircher BJ, Himelman RB, Schiller NB (1990) Noninvasive estimation of right atrial pressure from the inspiratory collapse of the inferior vena cava. Am J Cardiol 66(4): 493-496.
- Duperret S, Lhuillier F, Piriou V, Vivier E, Metton O, et al. (2007) Increased intra-abdominal pressure affects respiratory variations in arterial pressure in normovolaemic and hypovolaemic mechanically ventilated healthy pigs. Intensive Care Med 33(1): 163-171.
- Bendjelid K, Viale JP, Duperret S, Colling J, Piriou V, et al. (2012) Impact of intra-abdominal pressure on retrohepatic vena cava shape and flow in mechanically ventilated pigs. Physiol Meas 33(4): 615-627.
