 Research Article
Abstract
The objective of this study was to evaluate the quality of water and the polluting load generated by two commercial trout farms (A e B) in a raceway system during the years of 2013, 2014 and 2015 in the rainy season (October to March) and dry season (April to September). Six collection points demarcated in the trout farm A, with total 84 samples and 9 collection points in trout farm B, with total 126 samples. The collection points defined as follows: tributary, effluent, upstream and downstream in the two trout farms. Biochemical oxygen demand (BOD), dissolved oxygen (OD), ammoniacal nitrogen (NH3 +NH4+ ), nitrite (NO2- ), nitrate (NO3- ), phosphate (PO43-), alkalinity, turbidity and thermotolerant coliforms were determined according to the protocol described in Standard Methods Water and Wastewater (APHA, 2008). Analyzes of temperature, pH, electrical conductivity (EC), total dissolved solids (TDS) and salinity performed in situ. The Physiochemical variables evaluated between the rainy and dry seasons, in the A and B trout farms, differed for EC, BOD, NH3 +NH4+ , PO43-, TDS, temperature and turbidity. In trout farm B, chloride and pH levels also showed significant differences. About the collection points, the two trout farms presented differences for TDS.
The trout farm A showed difference for BOD and trout farm B, for alkalinity and EC. There was an interaction effect between collection points and rainfall and dry seasons as a source of variation in the two trout farms, with differences observed for the variables EC, TDS and temperature, but there were also differences in trout farm A for BOD and NH3 +NH4+ , in the trout farm B, the alkalinity presented significant differences (p<0.05). In the study with thermotolerant coliforms in the trout farm A differences were observed between rainy and dry seasons, but without differences between the collection points. In trout farm B there was no difference between rainy and dry seasons. Regarding the presence of Escherichia coli bacteria, no difference observed in trout farm A, only in trout farm B there was difference. It was demonstrated in this study that the physicochemical and microbiological alterations evaluated are within the standards of comfort for the cultivated species and in accordance with the effluent release standard of the Brazilian legislation, showing minimal impact to the receiving water bodies.
Keywords: Stream; Management; Nutrients; Oncorhynchus Mykiss; Trout Farm
Introduction
Water quality and the quantification of the pollutant load generated in systems for aquaculture production are essential for the sustainable management of aquatic ecosystems and for the adoption of measures that may mitigate possible environmental impacts [1], (Period) Trout is a salmonid very sensitive to pollution, temperature increases and low amount of dissolved oxygen, being a very exigent fish with regard to the physicochemical and microbiological variables of the water [2]. However, its cultivation can generate residues related to the increase of suspended solids, phosphorus, unconsumed foods, faeces and nitrogen excreta [1], which generate enriched effluents being disposed downstream of the trout farm. The impact of intensive trout farm on downstream rivers also depends on the size of the enterprise, production practices, nature, volume of residues and also on its own self-purification capacity [3], since related activities to the use of the river basin can cause changes in water resources. According to [4], the waste load received by the body water will be proportional to the density of the fish production, which may also be influenced mainly by the quality of the feed that is used, which will determine the amount of nitrogen compounds excreted by the fish [3].
In addition, effluents generated by aquaculture activity may produce food waste and fish feces, but may also contain pathogenic bacteria, viruses, parasites and veterinary drugs [3,5]. Therefore, the contribution of contaminants in the water bodies can cause changes in their chemical and biological composition [6], and its effects depend on the quality of the effluent, which can cause eutrophication downstream of the trout farm. Periodic water samplings for raceway system evaluation are required during rainbow trout cultivation and should be performed frequently. These analyzes, in addition to providing data on water quality [7], may indicate the level of pollution of rivers and streams [8]. They are essential to predict the impacts generated by trout farm, since the discharge of water to its receiving beds must be done with a quality at least equal to that captured, according to the current brazilian legislation (CONAMA Resolution No. 357/2005 and COPAM/CERH -MG Nº1-2008) and despite continuous flow systems with high water recirculation, it can show differences between the physicochemical and microbiological characteristics of the water during the production cycle, besides being able to affect the physiological state of the trout and the water quality of the sources that receive their effluents.
In this sense, to ensure adequate fish production and environmental protection, it is necessary to keep the water quality variables within the established limits [9] for the cultivated species and also to comply with environmental legislation when it comes to the launch of effluents in the body water downstream of aquaculture activities. In view of the above, the objective was to evaluate the water quality and the polluting load generated by two commercial trout farm in a raceway system.
Material and Methods
Area of Study and Collections
Two commercial trout farms were selected for this study with the following locations: A (22°33’16.32” S and 45°19’44.46” W) and B (22°29’25.44” S and 45°14’15.66” W) , in the city of Delfim Moreira, with an average altitude of 1,260 m, in the Mantiqueira mountain range in the state of Minas Gerais, Brazil. Both use the raceway system for the production of rainbow trout (Oncorhynchus mykiss Walbaum, 1792), in a region that combines climatic conditions ideal for the cultivation of the species. In addition to the high altitude, it has lower temperatures, more rugged land, quality and quantity of water compatible with trout farm, making the municipality of Delfim Moreira one of the largest trout producers in Brazil. The main characteristics of the two trout farms are shown in the Table 1. For the collection of water in the trout farm A were chosen 6 points, being: A1 (water inlet, tributary), A2, A3 and A4 (outlet of tanks, effluent), A5 (upstream) and A6 (downstream). Trout with slaughter weight around 300 to 500 g were kept in tanks A3 and A4, in the exit of these tanks there was a decantation tank. Point A2 (with juveniles fish) receives the effluents and did not pass through the decantation tank, flowing directly into the river.
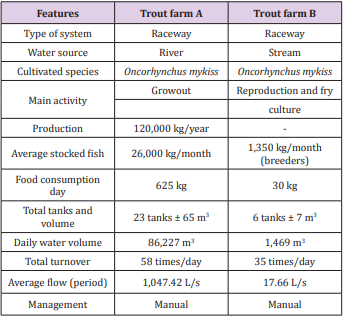
Table 1: Characteristics of the two commercial trout farms A and B.
The trout farm A showed lower variation in flow during the year due to a derivation of a dam with floodgates that controlled the levels of water entry (more or less 200 m upstream of point A1). In the trout farm B nine collection points were demarcated, being: B1 (source, inflow), B2, B3, B4, B5, B6 and B7 (outflow of tanks, effluents), B8 (upstream) and B9 (downstream). Although the purpose of trout farm B was for the production of juveniles, there was a fish stock for growout, used for consumption on the property with a tank that could also be used as a fish and pay (B12). In this trout farm, broodstocks were kept in tanks (B5, B6 and B7) and point B2 had not been populated with fish during the experimental period. For microbiological analyzes, 4 points were chosen in the two trout farms: A1 (tributary), A4 (effluent), A5 (upstream) and A6 (downstream) and in trout farm B, the points B1 (tributary), B7 (effluent), B8 (upstream) and B9 (downstream). The samples were collected monthly from September, 2013 to August, 2015.
Among the physicochemical variables analyzed, the temperature, electric condutivity (EC), total dissolved solids, were measured with portable conductivity meter (RS-2328306), pH with portable pH meter (PH- 221 Lutron) and turbidimeter turbidity (Wv - DelLab), these parameters being measured in situ. For the other physicochemical variables, the methodologies described in the Standard Methods Water and Wastewater (APHA, 2008) were used, namely: biochemical oxygen demand (BOD, analysis 5210 B); dissolved oxygen (DO, analysis 4500 OC); NH3+NH4+ (analysis 4500 NH3); NO2- (analysis 4500 NO2 A); NO3- (Rodier, 1981); PO43- (analysis 4500 PE), alkalinity (analysis 2320 B), thermotolerant coliform group and Escherichia coli (analysis 9223 B - Colilert kit method). For the related physicochemical analyzes, polyethylene bottles (1.5 L) and sterile flasks were used for coliform analyzes. After collection, the samples were preserved on ice, transported and evaluated in the Laboratory of Environmental Sanitation of the Veterinary School of UFMG, Brazil. For the calculation of pollutant load and population equivalent, the physicochemical parameter BOD was considered, since it is the most used form for the quantification of organic matter. The calculation of the pollutant load was carried out through the product of the pollutant concentration by the flow of the lotic body and was given in kilogram per day. The pollutant potential produced by a population can be calculated by dividing the pollutant load by 0.054 and is used by the international literature to characterize the per capita contribution of BOD (Kg/inhab/day).
Experimental Design and Statistical Analysis
The experimental design was completely randomized with a 2x6 factorial arrangement, considering two treatments (rain and drought) and six months of collection in each season, to verify the influence of rainy periods (October to March) and dry periods (April to September), in the sampling points. The data were submitted to analysis of variance (ANOVA) and the parameters that presented significant difference (p<0.05) were submitted to Tukey’s test and Kruskal-Wallis for comparison of means. InfoStat version 2012 software was used.
Results and Discussion
Evaluations of the Physicochemical Parameters of the Trout Farms
The geological history of the region, type of soil in the basins, climate, geomorphology, vegetation cover and anthropic action can influence the water quality for fish production, but changes related to the periods are also relevant. In addition to water characteristics during fish culture, considerable changes in effluent quality can occur due to the characteristics of the water supply of each trout farm and the management adopted during the production cycle. In this sense, for the production of trout in a raceway system, the effluent must follow the standards required by the brazilian legislation (CONAMA Resolution No. 357/2005 and Joint Normative Resolution COPAM/CERH-MG No.1/2008), aiming at the minimum possible impact to the sources located downstream of the trout farms. The main parameters of water quality aiming at the comfort for fish in general and for rainbow trout, as well as the classification of water bodies and the discharge pattern for effluents are described in Table 2.
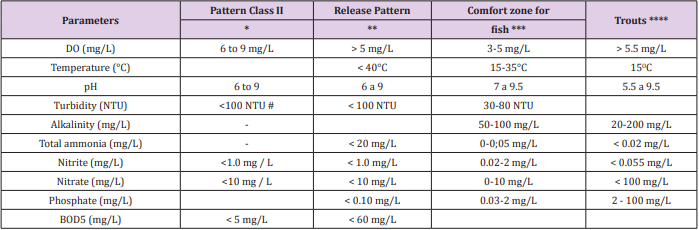
Table 2: Parameters for evaluation of Class II water bodies classification, launch pattern, comfort standards in the production of rainbow trout and other fish.
Note: * CONAMA Resolution No.357/2005; ** COPAM/CERH- MG 1/2008; *** Bhatnagar and Devi (2013); **** White Cachafeiro (1995); BOD5: biochemical oxygen demand; #NTU (nephelometric turbidity unit).
The data on the physicochemical variables of the water samples for trout farm A and B obtained during the rainy and dry periods are shown in Tables 3 and 4 and in relation to the sampling points shown in Tables 5 and 6. Results of the microbiological analyzes for the group thermotolerant coliforms are described in graphs 1 and 2, for trout farm A, and graphs 3 and 4 for trout farm B. The presence of E. coli for trout farms A and B can be observed in graphs 5 and 6. The polluting load and its population equivalent of the two trout farms are expressed in Table 6. In relation to the rainy and dry seasons there was a significant difference for the NH3+NH4+ variable in the trout farm A, however, the two trout farms presented significant differences (p<0.05) between the seasons for the variables EC, BOD, PO43-, TDS, temperature and turbidity. Specifically for trout farm B, pH and chloride levels also showed significant differences (p<0.05) (Table 3 and 4). Regarding the relation between the collection points, the two trout farms presented significant differences (p<0.05) for TDS and still the trout farm A showed significant difference (p<0.05) for BOD. For all parameters evaluated, it was possible to demonstrate the influence of the seasons on water quality, where data may have been influenced by flow, tank washing and surface runoff.
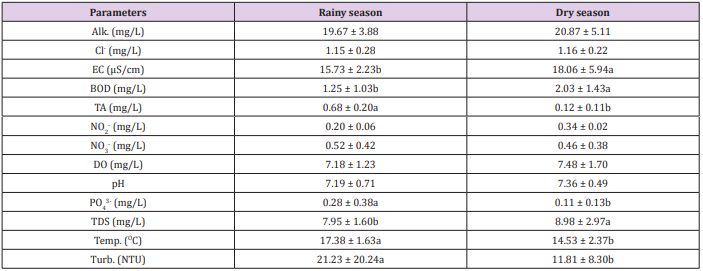
Table 3: Physicochemical parameters of water quality in trout farm A during rainy and dry seasons.
Note: Alk: Alkalinity; Cl: chlorides; EC: electrical conductivity; BOD: biochemical oxygen demand;TA: total ammonia; NO2- : nitrite; NO3-: nitrate; DO: dissolved oxygen; pH: hydrogenation potential; PO4 3-: phosphate; TSD: total dissolved solids; Temp.: temperature; Turb.: turbidity. Means followed by different letters in the line differ from each other at 5% significance.

Table 4: Physicochemical parameters of water quality in trout farm B during rainy and dry seasons.
Note: Alk: Alkalinity; Cl: chlorides; EC: electrical conductivity; BOD: biochemical oxygen demand; TA: total ammonia; NO2- : nitrite; NO3-: nitrate; DO: dissolved oxygen; pH: hydrogenation potential; PO43-: phosphate; TSD: total dissolved solids; Temp.: temperature; Turb.: turbidity. Means followed by different letters in the line differ from each other at 5% significance.
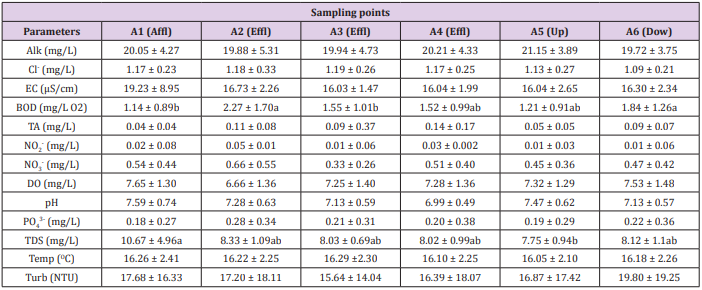
Table 5: Physicochemical parameters of water quality in relation to sampling points in trout farm A.
Note: Affl: affluent; Effl: effluent; Dow: downstream; Up: upstream; Alk: Alkalinity; Cl: chlorides; EC: electrical conductivity; BOD: biochemical oxygen demand; TA: total ammonia; NO2-: nitrite; NO3-: nitrate; DO: dissolved oxygen; pH: hydrogenation potential; PO43-: phosphate; TDS: total dissolved solids; Temp: temperature; Turb: turbidity. Means followed by different letters in the line differ from each other at 5% significance.
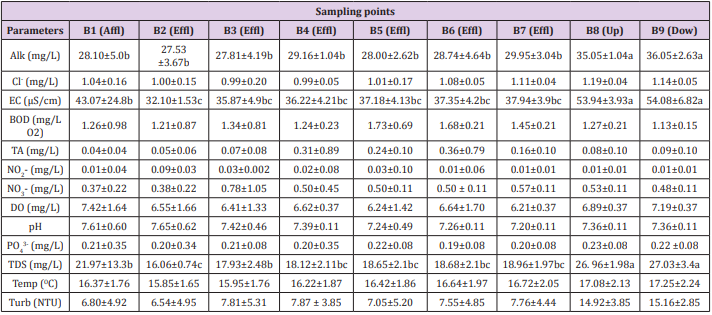
Table 6: Physicochemical parameters of water quality in relation to sampling points in trout farm B.
Note: Affl: affluent; Effl: effluent; Dow: downstream; Up: upstream; Alk: Alkalinity; Cl: chlorides; EC: electrical conductivity; BOD: biochemical oxygen demand; 3-TA: total ammonia; NO2-: nitrite; NO3-: nitrate; DO: dissolved oxygen; pH: hydrogenation potential; PO43- : phosphate; TDS: total dissolved solids; Temp: temperature; Turb: turbidity. Means followed by different letters in the line differ from each other at 5% significance.
The supply of the raceways of the trout farm A was carried out by a river and its flow remained more stable during the rainy periods (1,053,18 L/s) and dry (931,88 L/s), due to a derivation in the channel. The trout farm B was supplied by a stream where there was a reduction of approximately 50% of the flow, influenced by the difference between the precipitation data, being the averages for the dry and rainy period of 122.82 mm and 43.86 mm, respectively. The characteristics of the tributaries to supply the two trout farms had influence on the alkalinity, although the alkalinity did not present significant differences (p>0.05) in trout farm A. In the trout farm B significant differences were observed (p<0.05) in relation to the collection points (Table 6). Thus, alkalinity can maintain pH balance [10], providing greater comfort to the fish and in both trout farms it remained within the standards for intensive breeding of trout (>20 mg/L) because if the alkalinity remains below 20 mg/L CaCO3 it can cause stress in the fish [10]. When evaluating the alkalinity of the trout farm effluents [3] observed that the value in the tributary was 4.4 mg/L CaCO3 and there was an increase to 7.6 mg/L CaCO3 in its effluent.
In the present study there was a balance in the alkalinity between affluent and effluent in the two trout farms. However, some changes in alkalinity were verified at the upstream and downstream points of trout farm B, possibly because of the higher amount of bicarbonates and carbonates dissolved in the water. These compounds may originate in water due to soil type, geological formation of the river and erosive processes but differences in alkalinity may also be related to the entry of acids by leaching or surface runoff [8]. Nitrification may also be responsible for the decrease in alkalinity.
Chloride is found in salt form in water, being common in this environment and is useful for fish acting to maintain their osmotic equilibrium [10]. The concentration of chlorides around 20 mg/L is considered normal in salmon farming and above 50 mg/L is considered a concern (Blanco-Chachafeiro 1995), because if chloride levels rise above 100 mg/L may cause branchial lesions. Chloride content is dependent on the salinity level [10] but may also have anthropogenic and geological origin (USEPA, 2015) and on the management of feeding done in fish culture.
Only trout farm B presented a significant difference (p <0.05) for chloride between rainy and dry seasons. What could have influenced the results in trout farm B was the greater capacity of dilution of dissolved salts in the raceway system in the rainy season. In the trout farm A, the chloride contents remained constant due to the high daily exchanges of water during the year thus diluting the salts of the culture water.
The electrical conductivity (EC) is directly related to the ionic dissociation of salts dissolved in the water. It can be influenced by the variations in TDS [31], temperature [11] and dissolved ions [12]. There was a significant difference (p<0.05) in EC, between rainfall and dry seasons and at sampling points evaluated in trout farm B. These results can demonstrate the influence of the geochemical characteristics of the region and periodicity of the precipitations on the electrical conductivity [13], that can provide the dilution of ions in the water. In addition, high feed rates with possible feed leftovers can lead to increased organic matter decomposition and influence on conductivity.
In additon, it was observed that the conductivity was higher in the sampling points in relation to the tributaries and remained more stable in the effluents in the two trout farms. These data do not agree with the data obtained by other authors, such as [3,8,14,15], which found an increase in conductivity of the effluents from trout farms (39 to 83 μS/cm, 637.9 to 722.7 μS/cm, 267 to 375 μS/cm and 10.5 to 12.93 μS/cm, respectively) [16] also reported a significant increase in EC in effluent from trout production systems, being influenced by the increase of organic matter due to higher fish density. In the trout farm B, values of EC = 43.07 μS/cm were observed in the affluent, with a lower value at point B2 (always without fish), but without significant differences (p>0.05) between points B8 (upstream) and B9 (downstream). There was also an extreme point in B1 (tributary) with 108.5 μS/cm, which coincided with a rainy period in the night before the sampling, providing the largest entrance of residues in the stream.
BOD is related to total oxygen uptake by microorganisms to degrade organic matter (Bhatnagar and Devi, 2013) [10]. In both trout farms there were significant differences (p<0.05) for BOD between the seasons and between the sampling points. Although the two trout farms comply with the legislation regarding BOD levels during the study period, we noted the increase in BOD concentrations in the trout farms during the dry period, indicating the higher concentration of organic matter in the raceway system due to the decrease flow rate. In the farm A, high BOD occurred during the tank washing and especially at the point A2, where the effluent is discharged directly into the receiving stream without passing in the decantation tank, also occurring the increase in the downstream point (A6). In Trout farm B, BOD was low since there are no populations above it and in points B5 and B6, there is an increase in BOD, since the effluent came from the tanks where the biggest trout were kept, including breeding animals. It should be noted that the upstream and downstream points in this trout farm correspond to points that also has low BOD. The data obtained for the increase in BOD are in agreement with Camargo (1994) [8], from 3.0 to 4.2 mg/L O2; [3], from 0.9 to 14 mg/L O2; [17], from 0.5 to 1.3 mg/L O2; [18], from 1.4 to 4.7 mg/L O2; and Koçer and Sevgili (2014), from 4.6 to 6.2 mg/L O2, due to the increase of the organic matter in the system.
During the summer, changes in BOD may occur due to the higher production of organic matter, related to temperature and high feed rates, corroborated by [19]in the Karasu stream in Turkey where the BOD was estimated to be 3.16 ± 1.23 mg/L O2 . Aiming to reduce the organic matter load from the two trout farms, some mitigation measures could be applied, such as phytoremediation, which could efficiently remove several types of pollutants [20,21]. As an example, we highlight the use of wetlands that have the capacity to reduce BOD by up to 48.8% [22]; up to 88.7% [23] and up to 82.8% [24].
The increase of TA can occur in the production systems associated with stocking density, fish size and excess feed. Excretion raises the contribution of this nitrogen compound in the water, as well as the degradation of the feed not consumed by heterotrophic bacteria. However, the values evaluated for TA showed significant differences (p<0.05) only in trout farm A, between rainy and dry seasons. In the rainy season, changes in water bodies are common, influenced by the surface runoff, which may cause an increase in sediment transport to the water body.
According to [1], the enrichment of the effluent with TA is related to the high fish biomass and the annual means of waterflow from the rivers. Thus, the elevation of the TA load is greater with increased fish production and lower discharge (flow) of the river. In both trout farms, TA exceeded the limit of <0.02 mg/L TA for trout production, recommended by [2] and despite changes in the two trout farms, was below the standard recommended by the brazilian legislation, which is 20 mg/L TA. The increase in the level of TA in the effluents was demonstrated in trout farms [3], finding 1.46 mg/L TA; 0.5 mg/L TA recorded [17]; 0.36 mg/L TA [18]; 0.74 mg/L TA [8]; 0.60 mg/L TA [1], due to fish excretion and degradation of the nitrogen compounds of the unconsumed feed.
NO2 - is the result of the oxidation of ammonia found in the aquatic environment by nitrifying bacteria. The levels of NO2 - found at the collection points in the two trout farms did not show significant differences in this study (p> 0.05), however, the concentrations may be toxic to aquatic organisms because in high concentrations, NO2 - makes it impossible to transport oxygen to the body tissues as a function of oxidation of hemoglobin in methaemoglobin. The maximum nitrite limit recommended [2] is 0.055 mg/L NO2 - for the cultivation of trout and <1.0 mg/L NO2 - for water bodies according to the current brazilian legislation.
Some changes occurred in the concentrations of NO2 - recorded in trout farm B at points B4, B5, B6 and B7, where the largest fish were found. At the other points lower concentrations of NO2 - were observed, providing ideal conditions for trout cultivation in the period. According to [8], increased NO2 - concentrations were observed in trout farm effluents (0.08 mg/L NO2 -), similar to what occurred in trout farm B at point B2. In trout farm A, NO2 - values were low for most points as reported by [14], which was 0.022 mg/L NO2 -. On the other hand, [3] and [8] found no differences in NO2 - levels between the affluent and the effluent, probably due to the high-water changes in the system that reduce oxidation processes. In aquaculture production systems, the use of wetlands for treatment of effluents can reduce the level of NO2 - by about 35% by sequestration of this nutrient by higher plants [22].
NO3- is a nitrogen compound considered less toxic than ammonia and nitrite, but may be a problem in closed culture systems. In the case of trout breeding, NO3- is not a problem, since it is an open system with constant water renewal. Thus, in the two trout farms, no significant differences were observed (p>0.05) and NO3- levels did not exceed the recommended limits for trout production ~100 mg/L NO3- . However, high levels of NO3- may cause depression of the fish’s immune system, as observed by [25].
It is suggested to maintain levels up to 10 mg/L NO3- to avoid toxic effects. Washing the tanks can contribute to the enrichment and elevation of the NO3- in some points, as demonstrated in the trout farm A in points A2 (2,5 mg/L NO3- ) and A4 (1,4 mg/L NO3- ). However, the values found were below the effluent release standards with limits of 10 mg/L NO3- being within the comfort for fish culture. NO3- values between 1.0 to 2.2; 0.9; and 2.1 mg/L NO3- , were found in both the tributaries and effluents of other trout farms by [3,8,9] reported even higher values, ranging from 2.38 to 3.76 mg/L NO3- in the effluent from trout culture. The high levels of NO3-- in raceways are related to the oxidative nitrification process that can occur even in high hydrodynamic environments [14]. This fact is corroborated [26] in raceway of O. mykiss. However, in general it was possible to observe that the nitrogen residues of the two trout farms contained low concentration of dissolved compounds, attributed to the high dilution of the culture media.
DO is the main variable for assessing water quality, as it directly interferes with fish metabolism and survival. DO can be related to diffusive processes at the air-water interface and by phytoplanktonic activity [27] or artificially by means of aerators and by the renewal of water from aquaculture farms. The content of oxygen in natural waters may vary with temperature [11], salinity, turbulence, photosynthetic activity, atmospheric pressure and may decrease as temperature and salinity increase [11]. There were no significant differences between the two treatments (p>0.05) in all evaluations, but the mean values observed in the two trout farms were lower (in the effluents) than in the affluents, being influenced by the fish biomass and oxidation of organic matter, but remaining at the recommended concentrations for the cultivation of trout that is >5.5 mg/L DO [2] and above 6 mg/L DO, maintaining the DO required by brazilian legislation.
The low DO level (3.7 mg/L) in trout farm A at point A2 occurred during fish sampling and tank cleaning while the aerators were off. Reduction in DO concentration during rainbow trout farm may also be related to biomass and feeding levels [19] and similar results were obtained in trout farms [3] =2.4 mg/L DO; [18]= 1.26 mg/L DO; [8]= 4.4 mg/L DO and [15], who reported a decrease in saturation percentage from 125.89 to 106.16%. These results contrast with those obtained [14], who reported that DO levels did not change between affluent and effluent in the trout farms, and an increase from 11.4 to 12.7 mg/L DO in the effluents [8].
The pH is directly related to the acidity, neutrality or alkalinity of water bodies and has an influence on the metabolism of aquatic organisms. There was only significant difference (p<0.05) for pH in the trout farm B, during rainy and dry seasons, with increase of pH in the dry season probably related to changes in alkalinity in the period, possibly influenced by bicarbonate and carbonate concentrations. In the two trout farms, pH became slightly above neutrality, but remained at the level of comfort variation for trout between pH 5.5 and 9.5 [2]. However, for trout, the same author recommends a slightly acidic pH, but all samples collected were within the required standards by brazilian legislation.
Some authors [14,15,17,24] also did not find significant differences in pH between the tributaries and effluents of trout farm as occurred in trout farm A. Additionally, [28] worked with effluents from the cultivation of three species of fish, and did not find significant differences between the treatments. This pH stability probably must have occurred due to the higher alkalinity buffering effect.
Phosphorus is an essential component for the biological cycles of water bodies. It occurs in natural waters and effluents (domestic and industrial), in the form of phosphate and the increase of its concentration can lead to the increase in primary production with the consequent eutrophication, which may indicate the pollution of the water body [11].The two trout farms presented significant differences (p<0.05) for phosphorus in rainy and dry seasons. The analyzed data resulted in a low concentration of phosphates at the points evaluated, both in the affluent and in the effluents, meaning no influence of the fish culture on the phosphate concentration, but during the tank washing, the greater dilution of the residues solids in the water resulted in increased phosphate levels in the culture medium.
In the trout farm B, in the rainy season, phosphate concentration was up to 0.89 mg/L PO43-, which can be explained by the presence of cultures maintained with phosphate-based fertilizers and carried to the body of water. Consequently, levels above the limits allowed by brazilian legislation were observed (Table 2). Regarding the COPAM/CERH-MG Deliberation No.1/2008, the mean values of the two trout farms in the rainy seasons and sampling points were above the limits indicated for Class III classification of water bodies (0.15 mg/L phosphorus). The phosphorus levels indicated for Class II, class where Aquaculture fits into lotic environments, as being 0.10 mg/L. In the same way, the contribution of these residues in both trout farms was verified in relation to the phosphate levels in the effluents (Tables 5 and 6). The phosphate increase in the commercial trout farm effluents was also observed by several authors [1,3,8];[14,15]. They observed rates of 0.06 to 0.579 mg/L; 0.05 to 0.41 mg/L; 0.02 to 0.57 mg/L; 0.011 to 0.060 mg/L and 0.072 to 0.088 mg/L PO43-, respectively.
The increase in phosphate level also occurred even with treatment using wetlands, from 0.046 to 0.057 mg/L PO43- and 0.041 to 0.127 mg/L PO43-, as observed [22,23]. Pulatsu (2004) [19] also found high concentrations of phosphate being associated to the higher content of this compound in the rations used in the trout farms. Therefore, it was suggested a better control in the feeding rates in order to avoid the contribution of phosphorus in the aquatic environment. Lower concentrations of PO43- were found at the effluent point in comparison with points in the trout farm itself [8]. [29] described that the transport of water that occurs in raceway systems is responsible for the residence time of residues. The authors mentioned that in all raceways evaluated there was deposition of solids representing a significant mass of PO43- in the system. The behavior of solid particles in rainbow trout raceways by three-dimensional velocity method based on the Doppler principle, highlights zones of quiescence in the system, implying the deposition of these residues in this system [18].
Such reports may explain the higher levels of PO43- in the trout farm during tank washing, with increased levels in the aquatic environment. In the mid-1980s, [30] reported concern about raceway washes and considered that this activity accounted for the main contribution of solid waste and PO43- to the water bodies.
The TDS are related to the occurrence of organic matter and mineral salts, and these values will reflect on the EC of the aquatic environment [31]. For TDS, there was a significant difference (p<0.05) in the two trout farms in relation to the rainy and dry seasons and between the sampling points. During the study period, point A1 (tributary) had the highest level of TDS, but there was a decrease in the other points, including points A5 (upstream) and A6 (downstream). During the rainy season (June 2014), there was a rise in TDS in A1, with 27.7 mg/L being recorded, showing the relationship of the presence of organic matter, minerals and other dissolved materials found in water, also influencing the EC of the water due to slope of the terrain and transport of materials by the surface runoff.
In the two trout farms there were significant variations (p<0.05) in water temperature during rainy and dry seasons and led to differences during the period, since the interaction between the seasons and sampling points also showed significant differences (p<0.05). Thus, the strong influence of the seasons was demonstrated, due to the changes of the solar radiation on the water temperature of the springs, reflecting on the higher values in the summer. In relation to the temperature in the two trout farms, the values found are in accordance with the indicated for the comfort of fish. Temperature increases were also observed by [14,15], changes between 13.0 and 18.5°C; 16.64 and 17.60°C, respectively, between the tributary point and the points subject to release of various types of effluents. However, both trout farms have complied with the brazilian legislation regarding the effluent release conditions in the receiving body (<40OC). The concentration of suspended matter controls water turbidity, which may be related to the presence of silt, clay, fine particles of inorganic matter, soluble organic compounds, plankton and other microorganisms [11,27].
In the present study, turbidity was significantly different (p<0.05) in the two trout farms, for the rainy and dry seasons. The rainy periods in the trout farm A presented the highest value in relation to the drought and greater turbidity in the downstream point due to the reception of the effluents. However, the same did not occur in trout farm B, where higher values of turbidity were observed during the dry season, possibly influenced by the periods of animal handling. In both trout farms, both tributaries and effluents, turbidity levels were below the limit indicated by brazilian legislation, for water bodies classified as Class I (up to 40 NTU). The analyzes performed with Imhoff cone did not show the presence of sedimentable solids during all the collections, apart from collections made on rainy days. The turbidity is related to the decrease in the passage of light, which restricts photosynthesis. With the reduction of light input, there is a decrease in oxygen production and losses in fish production [33]. The extremes of turbidity found at all points analyzed coincided with the collection having been performed the morning after rainfall occurred throughout the night. All authors who evaluated this parameter showed increased turbidity, in most cases associated with biometrics and harvesting. A fact also observed in trout farm effluents [3](1.3 to 9.6 NTU), [8] (0.71 to 4.67 NTU) (1 for 149 NTU) [14].
The presence of pathogenic bacteria in water can be a threat, especially if it is of fecal origin. These bacteria can cause, besides water contamination, the appearance of diseases in fish and even the mortality of these organisms. In addition, contamination of food for human consumption may occur [34]. For the samples evaluated in trout farm A, the group of thermotolerant coliforms showed significant differences (p<0.05) between rainy and dry seasons (Figure 1). However, there was no difference (p>0.05) in relation to sampling points (Figure 2). These data demonstrate the influence of the rainy season on the dispersion of bacteria by surface runoff. Similar fact was reported [35-40], who found higher values for the thermotolerant coliform group during the rainy season, which was also related to the action of the surface runoff of agricultural areas and pastures, due to the higher precipitation in the rainy season that contrasts with the dry season. During the same period, the presence in the group of thermotolerant coliforms was evaluated in trout farm B and there was no significant difference between the rainy and dry seasons (p>0.05) (Figure 3) and these values may have been influenced by the samplings made in days after off-season rains, but the fact that the B1 tributary comes from a source with little anthropogenic action, may have influenced the significant difference (p<0.05) between the sampling points in this trout farm (Figure 4), having an increase in the presence of thermotolerant coliforms at points B7, B8 and B9, when occasional rainfall occurred in the days prior to collection.
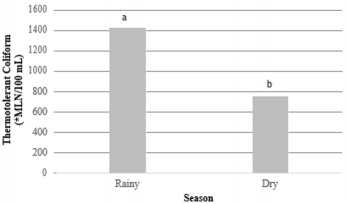
Figure 1: Thermotolerant coliforms counted in Trout farm A with means and standard deviation between rainfall season (1,425.20±1,049.81) and dry season (751.74±598.00). Means followed by different letters in the column differ from each other at 5% significance *MLN: most likely number.
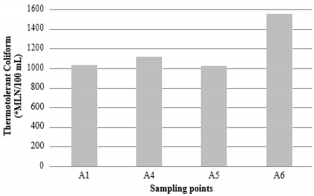
Figure 2: Presence of thermotolerant coliforms in Trout farm A at the collection points A1-affluent (1,034.34±997.43), A4- effluent (1,115.44±989.67), A5-upstream (1,020.28±922.16) and A6-downstream (1,421.17±875.06). There was no statistical difference between the sampling points at 5% significance. *MLN: most likely number.
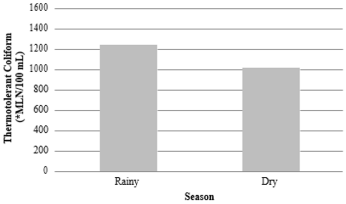
Figure 3: Thermotolerant coliforms counted in Trout farm B with means and standard deviation between rainfall stations (1,237.20±998.46) and dry (1,014.03±758.53). There was no statistical difference between the seasons at 5% significance. *MLN: most likely number.
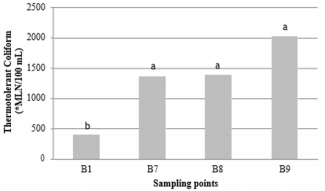
Figure 4: Presence of thermotolerant coliforms in Trout farm B, at collection points B1- tributary (398.99±325.00), B7-effluent (1,359.93±942.63), B8-upright (1,383.57±779.48) and B9-downstream (2,031.17±719.22). Means followed by different letters in the column differ from each other at 5% significance. *MLN: most likely number.
The presence of thermotolerant coliforms may increase after rainy periods and leads to avoid handling, such as biometrics, which could cause injury in fish. The values of the coliform group in the two trout farms are in accordance with the classification in Class II of the COPAM/CERH-MG Decision No.1/2008, that is, six annual analyzes of water bodies must present 80% counts below 1,000 CFU (colony forming units) per 100 mL. The increase of coliforms can occur from one trout farm to another through the discharge of effluents into the source of supply. This fact was observed [14], when studying several trout farms that used the same river. In this case, the elevation in CFU values (340 up to 22,508/100 mL) was observed. According to brazilian Resolution No.357/2005 of CONAMA, E. coli can be determined in substitution of the group of coliforms according to the limits established by the environmental agency, because this bacterium represents the most recent contamination of the environment. For this reason, in this study, water samples were collected in the two trout farms to evaluate the presence of E. coli; however, most of the samples were collected during the rainy season (year 2014) [41-43], and it was not possible to verify if there were differences between rainy and dry seasons, because of the reduced number of samples collected during the dry season.
Therefore, the presence of E. coli was evaluated only at sampling points, with no significant differences (p>0.05) in trout farm A (Figure 5), only with changes in the number of E. coli for samplings that preceded rainy days, due to the greater entrance of residues in the water body by surface runoff that can carry several types of pollutants including bacteria. In the trout farm B, significant differences (p<0.05) were recorded for the presence of E. coli, in the sampling points (Figure 6), with an increase in the average of the dry period for the upstream points (B8 ) and downstream (B9), being defined by the end of the drought period with the incidence of some rains in the region. It can be emphasized that the analyzes performed for turbidity and the values found in the group thermotolerant coliforms may be related to the inadequate discharge of effluents or their higher concentration present in the river [7].

Figure 5: Presence of E. coli in Trout farm A, at collection sites A1-affluent (623.60±441.09), A4-effluent (641.17±445.69), A5- upstream (309.46±255.06) and A6- downstream (426.76±349.43). There was no statistical difference between the sampling points at 5% significance. *MLN: most likely number.
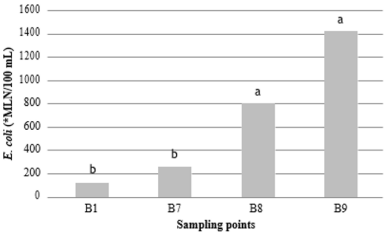
Figure 6: Presence of E. coli in Trout farm B, at collection sites B1-tributary (118.13±89.20), B7-effluent (253.12±161.71), B8- upstream (801.78±548.75), and B9- downstream (1,421.10±1,111.29). Means followed by different letters in the column differ from each other at 5% significance. *MLN: most likely number.
Assessment of Pollution Load and Population Equivalent
The assessment of the pollutant load aims to improve management during the trout cultivation in order to contribute to the conservation of the aquatic ecosystem. According to [7], the evaluation of the pollution impact of these effluents is necessary to avoid that the residues accumulation and nutrient contribution interfere in the sources downstream of the trout farms, causing the eutrophication of the medium. The pollutant load and the population equivalent in the three effluents monitored in Trout farm A and B are listed in Table 7. The increase in the load, from point A2 to points A3 and A4, was observed in trout farm A due to the higher BOD average for this point in relation to the others (Table 4). In the trout farm B, the pollutant load and the population equivalent in the seven monitored effluents were verified and it increased in the points where there were more fish (breeding) allocated, due to the higher stocking density and excretion of the animals (B5, B6 and B7). However, in relation to assessments of the pollutant load, the two trout farms studied represented a low risk of eutrophication to the bodies of water downstream, but it is still necessary to make a constant evaluation of water quality to ensure that these characteristics are maintained and that comply with environmental legislation.
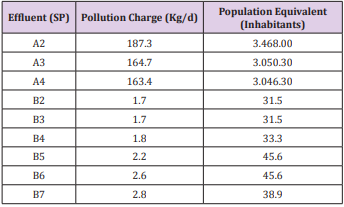
Table 7: Pollution load of effluents and population equivalent of trout farm A and B.
SP = sampling points
Conclusion
The two trout farms are in accordance with brazilian legislation, which defines the effluent release standard through the COPAM/ CERH-MG Decision No.1/2008, regarding the physicochemical and microbiological parameters evaluated and meets the standards of comfort for the species cultivation. The changes occurring between the tributaries and effluents are related to the stocking density, the amount of feed and the excretion of the fish. The process of washing the tanks had an influence on the evaluated parameters, mainly during episodes of rainfall for prolonged periods of time generating large volumes of water. In addition to the evaluated parameters, more research is needed to evaluate the changes caused by effluents in the biological communities (mainly the benthic macroinvertebrates) and to extend the study to the downstream areas of these effluents to better evaluate their impacts on the environment. Special attention should be given to the time of washing of the tanks by removing the sediment and generating a more enriched effluent which can lead to the modification of the water quality of the receiving body and to generate eutrophication of the same.
References
- Guilpart A, Roussel JM, Aubin J, Caquet T, Marle M, et al. (2012) The use of benthic invertebrate community and water quality analyses to assess ecological consequences of fish farm effluents in rivers. Ecological Indicators 23: 356-365.
- Blanco-Cachafeiro MC (1995) La Trucha - Cria Industrial. Edicones Mundi-Prensa, pp. 503.
- Boaventura R, Pedro AM, Coimbra J (1997) Trout farm effluents: characterization and impact on the receiving streams. Environmental Pollution 95(3): 379-387.
- Turcios AE, Papenbrock J (2014) Sustainable treatment of aquaculture effluents - What can we learn from the past for the future? Sustainability 6(2): 836-856.
- Jones JG (1990) Pollution from fish farms. Journal Institute Water Environmental Management 4: 14-18.
- Mirrasooli E, Nezami S, Ghorbani R, Khara H, Talebi M (2012) The Impact of Rainbow Trout (Oncorhynchus mykiss) Farm Effluents on Water Quality. World Journal of Fish and Marine Sciences 4(4): 330-334.
- Umbuzeiro GA, Kummrow F, Rei FFC (2010) Toxicologia, padrões de qualidade de água e legislação. INTERFACEHS - Revista de Gestão Integrada em Saúde do Trabalho e Meio Ambiente 5(1).
- Von Sperling M (2014) Introduction to water quality and sewage treatment. 4. ed. Editora UFMG: Belo Horizonte, pp. 472.
- Camargo JA (1994) The importance of biological monitoring for ecological risk assessment of freshwater pollution: a case study. Environmental International 20(2): 229-238.
- Karimi JM, Takami GA, Khara H, Abbaspour R (2016) Influence of trout farm effluents on water quality parameters and benthic macroinvertebrates. Iranian Journal of Fisheries Sciences 15(1): 133- 143.
- Dellamatrice PM, Monteiro RT (2014) Principais aspectos da poluição de rios brasileiros por pesticidas. Revista Brasileira de Engenharia Agrícola e Ambienta 8(12): 1296-1301.
- Bhatnagar A, Devi P (2013) Water quality guidelines for the management of pond fish culture. International Journal of Environmental Sciences 3(6).
- Chapman D, Kimstach V (1996) Selection of water quality variables. In: Chapman, D. Water quality assessment: a guide to the use of biota, sediments and water in environmental monitoring. Londres, p. 60.
- Tundisi JG, Matsumura Tundisi T, Limnologia (2008) São Paulo: Oficina de Textos 632.
- Piratoba ARA, Ribeiro HMC, Morales GP, Gonçalves WG (2017) Characterization of water quality parameters in the port area of Barbacena, PA, Brazil. Environment and Water 12(3).
- Koçer MAT, Sevgili H (2014) Parameters selection for water quality index in the assessment of the environmental impacts of land-based trout farms. Ecological Indicators 36: 672-681.
- Koçer MAY, Kanyılmaz M, Yılayaz A, Sevgili H (2013) Waste loading into a regulated stream from land-based trout farms. Aquaculture Environment Interactions 3: 187-195.
- Caramel BP, Moraes MAB, Carmo CF, Vaz Dos Santos AM, Tabata YA, et al. (2014) Water quality assessment of a trout farming effluent, Bocaina, Brazil. Journal of Water Resource and Protection 6: 909-915.
- Maillard VM, Boardman GD, Nyland JE, Kuhn DD (2005) Water quality and sludge characterization at raceway-system trout farms. Aquacultural Engineering 33(4): 271-284.
- Viadero RC, Cunningham JH, Semmens KJ, Tierney AE (2005) Effluent and production impacts of flow-through aquaculture operations in West Virginia. Aquacultural Engineering 33: 258-270.
- Pulatsu S, Rad F, Köksal G, Aydın F, Benli AÇK, et al. (2004) The Impact of Rainbow Trout Farm Effluents on Water Quality of Karasu Stream, Turkey. Turkish Journal of Fisheries and Aquatic Sciences 4: 09-15.
- Materac M, Wyrwicka A, Sobiecka E (2015) Phytoremediation techniques in wastewater treatment. Environmental Biotechnology 11(1): 10-13.
- Gherib A, Boufendi M, Temime A, Bedouh Y (2016) Applications of phytoremediation in wastewater treatment in Algeria. Larhyss Journal 26: 99-11.
- Sindilariu PD, Brinker A, Reiter R (2009) Factors influencing the efficiency of constructed wetlands used for the treatment of intensive trout farm effluent. Ecological Engineering 35(5): 711-722.
- Sindilariu PD, Schulz C, Reiter R (2007) Treatment of flow-through trout aquaculture effluents in a constructed wetland. Aquaculture 270(1-4): 92-107.
- Sindilariu PD, Wolter C, Reiter R (2008) Constructed wetlands as a treatment method for effluents from intensive trout farms. Aquaculture 277(3-4): 179-184.
- Plumb JA (1997) Infectious diseases of tilapia. In: Costa Pierce BA, Rakocy JE (Eds.,). Tilapia aquaculture in the Americas. Baton Rouge: World Aquaculture Society 1: 212-228.
- USEPA - United States (2015) Environmental Protection Agency - Secundary maximum contaminant levels: a strategy for drinking water quality and consumer acceptability
- Boersen G Westers H (1986) Waste solids control in hatchery raceways. The Progressive Fish Culturist 48: 151-154.
- Esteves FA, Figueiredo Barros MP, Petrucio MM (2011) Principais cations e ânions. In: Esteves, F.A. Fundamentos de Limnologia Rio de Janeiro: Interciência 17: 300-321.
- True B, Johnson W, Chen S (2004) Reducing phosphorus discharge from flow-through aquaculture I: facility and effluent characterization. Aquacultural Engineering (32)129-144.
- Wedemeyer GA (1997) Effects of rearing conditions on the health and physiological quality of fish in intensive culture. In: Iwama GK, Pickering AD, Sumpter JP, Schreck CB (Eds.), Fish and stress and health in aquaculture. United Kingdom: Cambridge University Press, p. 35-71.
- Amirkolaie AK (2008) Environmental impact of nutrient discharged by aquaculture waste water on the Haraz river. Journal of Fisheries and Aquatic Science 3(5): 275- 279.
- Andrietti G, Freire R, Amaral AG, Almeida FT, Bongiovani MC, et al. (2016) Water quality and trophic status indices of Caiabi river, MT. Environment and Water 11(1).
- APHA - American Public Health Association (2008) Standard methods for examination of water and wastewater. USA.
- Baccarin AE, Camargo AFM (2005) Characterization and evaluation of impact of feed management on the effluents of Nile tilapia (Oreochromis niloticus) culture. Brazilian Archives of Biology and Technology 48(1): 81-90.
- Boyd CE (1979) Water Quality in Warm Water Fish Ponds, Agriculture Experiment Station, Auburn, Alabama, pp. 359.
- Ministério do Meio Ambiente, Conselho nacional de meio ambiente – CONAMA (1985) Resolução CONAMA nº 357 de 17 de março de 2005. Diário Oficial da União 53: 58-63.
- Camargo JA, Gonzalo C, Alonzo A (2011) Assessing trout farm pollution by biological metrics and indices based on aquatic macrophytes and benthic macroinvertebrates: A case study. Ecological Indicators 11: 911-917.
- Obasohan EE, Agbonlahor DE, Obano EE (2010) Water pollution: A review of microbial quality and health concerns of water, sediment and fish in the aquatic ecosystem. African Journal of Biotechnology 9(4): 423-427.
- Percebom SC, Bittencourt AVL, Rosa Filho EF (2005) diagnóstico da temperatura das águas dos principais rios de Blumenau, SC. Boletim Paranaense de Geociências 56: 7-19.
- Rosa RS, Aguiar ACF, Boechat IG, Gücker B (2013) Impacts of fish farm pollution on ecosystem structure and function of tropical headwater streams. Environmental Pollution 174: 204-213.
- Stroshchoen AAG, Périco E, Lima DFB, Rempel C (2009) Estudo preliminar da qualidade da água dos rios Forqueta e Forquetinha, Rio Grande do Sul. Revista Brasileira de Biociências 7(4): 372-375.
