 Research Article
Abstract
Farming of sturgeon in worldwide has increased in recent years. The use of antibiotics to minimize the impact of disease outbreak in sturgeon aquaculture becomes very important. Florfenicol (FFC) is the only available antibiotic authorized for application in sturgeon aquaculture in Taiwan, but its residue and metabolism during breeding period are lacking. To determine the presence and distribution of FFC residue in Bester sturgeon after treatment and to obtain information about FFC withdrawal period for sturgeon culturing, a simple, rapid, and reliable technique was developed to detect the pharmacokinetics and the residual of FFC. Using high performance liquid chromatography method with ultraviolet detector, we showed the FFC concentration in serum and its residue in muscle and liver overtime following oral administration. This paper details sampling and assay validation methods to demonstrate the application of the simple and reliable technique for FFC detection. Taken together, the protocol provides valuable insight that can be used to design optimal dosage regiments for aquatic veterinary applications.
Keywords: Bester Sturgeon; Florfenicol; High Performance Liquid Chromatography; Pharmacokinetics; Ultraviolet Detection; Taiwan
Abbreviations: Half-Lives (t1/2); Time to Maximum Concentration (Tmax); Maximum Concentration (Cmax); Mean Residence Time (MRT); Clearance (CL); Area Under the Concentration-Time Curve from 0 h to Infinity (AUC0-Inf)); Apparent Volume of Distribution (V/F); Ultraviolet (UV); High Performance Liquid Chromatography (HPLC); Florfenicol (FFC); Limit of Detection (LOD); Relative Standard Deviation (RSD); Standard Error of the Mean (SEM); Limit of Quantification (LOQ)
Introduction
The hybrid Bester sturgeon (Huso huso × Acipenser ruthenus) is one of the most important commercial fish species in the world. Farming of sturgeon in worldwide has increased in recent years and becomes an important issue in the wider context of global food supplies [1]. In Taiwan, the techniques for sturgeon culturing have been established in several fish farms. However, the high density of animals grown in agricultural facilities and fish hatcheries in either large- or small-scale fish farms increases the potential for disease outbreak. To minimize the impact of an outbreak spreading across an animal population, the use of drugs, especially antibiotics, in sturgeon aquaculture becomes very important [2]. Florfenicol (FFC), a fluorinated analogue of thiamphenicol and chloramphenicol, has a synthetically produced broad antibacterial spectrum similar to chloramphenicol and stronger than thiamphenicol [3]. It has been widely used in veterinary as well as in aquaculture.
Among 14 antibiotics authorized for application in Taiwan aquaculture, FFC is only available for sturgeon aquaculture. Nevertheless, there is a lack of understanding regarding FFC metabolism kinetics during breeding period. The overall goal is to determine the presence and distribution of FFC residue in Bester sturgeon after treatment to obtain information about FFC withdrawal period for sturgeon culturing. This paper and video describe the stepwise development of a simple, rapid, and reliable method for detecting the pharmacokinetics of FFC in serum, muscle and liver of Bester sturgeon. The details of sampling and assay validation methods as well as the representative results are shown to demonstrate the application of high-performance liquid chromatography (HPLC) method with ultraviolet (UV) detector. The simple and reliable technique can be utilized to design optimal dosage regiments for aquatic veterinary applications.
Materials and Methods
NOTE: All animal experiments were approved by the Institutional Animal Care and Utilization Committee (IACUC) of National Chung-Hsing University, Taichung, Taiwan (approval ID: 98-61). Animal care was performed in compliance with the guidelines of IACUC and the United States National Institutes of Health Guidelines for the Care and Use of Laboratory Animals. All efforts were exerted to minimize the number of animals used and their discomfort.
For the source and sample collection of experimental Bester Sturgeon-There is one session 4:46 min long, divided into the source of experimental Bester sturgeon (the first 2:16 min) and the sample collection of experimental Bester sturgeon (the last 2:30 min)
Experimental ± Fishes
a. Healthy Bester sturgeon, a cultured hybrid of Huso huso × Acipenser ruthenus (1,000 100 g) were obtained from a commercial farm (Han Si Fish Farm, Yilan County, Taiwan).
b. Fish were fed a standard laboratory diet and kept on a 12-h light/dark cycle at 23 ± 1°C in the Central Fish Disease Center, National Chung-Hsing University, Taichung, Taiwan.
c. Animals were randomly assigned to treatment groups and housed in 300 L aquaria with a continuous flow of pH 6.8 ± 0.4 aerated freshwater in the density of 6 fish / 91 cm × 51 cm [the bottom area (length × width) of the experimental cylinder] (Figure 1).
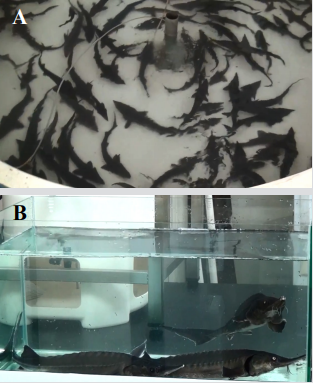
Figure 1: Experimental Bester sturgeon. SS
(A) Healthy Bester sturgeon (1,000 ± 100 g) were obtained from a commercial farm in Yilan County, Taiwan.
(B) Experimental Bester sturgeons were housed in 300 L aquaria with a continuous flow of aerated freshwater in the Central Fish Disease Center, National Chung-Hsing University, Taichung, Taiwan.
Sample Collection
a. After an acclimatization period of at least 1 week, FFC (Sigma-Aldrich) were fed to 42 fish per group daily at dose of 10 mg kg-1 or 20 mg kg-1 via disposable feeding needles (FN-9921, 20G × 1.5”; Kent Scientific, San Diego, CA, USA).
b. Age matched control fishes (n = 42) were administrated with an equal volume of normal saline instead of FFC (Figure 2).
c. At day 3, day 5, day 7, day 10, day 14, day 21, and day 28 after the p.o. FFC administration, fishes were deeply anesthetized with tricaine methane sulphonate (MS222, Sigma-Aldrich).
d. Approximately 0.5 mL of blood samples were obtained from the caudal artery of each fish (Figure 3).
e. Blood samples were allowed to clot at room temperature for 30 min then the coagulated blood samples were centrifuged at 1,300 ×g for 10 min.
f. Sera were collected and stored at -80˚C.
g. The muscle and liver samples were excised and snapfrozen at -80˚C (Figure 4).
h. Frozen muscle and liver samples were homogenized in buffer.
i. The tissue slurry was then centrifuged at 5,000 rpm for 30 min at 4°C, the supernatants were collected and kept at -80˚C for subsequent analysis.

Figure 2: Oral administration with FFC to Bester sturgeon by gavage. Animals were given single oral FFC administration at doses of 10 and 20 mg kg-1 BW per day via disposable feeding needles.

Figure 3: Blood collection from Bester sturgeon. Approximately 0.5 mL of blood samples were obtained from the deeply anaesthetized fish via their caudal artery.
For the assay by using HPLC equipped with UV detector - There is one session 0:54 min long
Apparatus
a. The HPLC system equipped with a quaternary solvent delivery system (model 600e) (Waters, Milford, MA, USA), an autosampler (model 717, Waters), a photodiode array detector (model 996, Waters), and a Cosmosil 5C18-MS column (5 µm, 4.6 × 150 mm i.d.; Nacalai, Kyoto, Japan) (Figure 5).
b. The chromatograms were detected via UV detector with the screening wavelength of 210 to 290 nm and the excitation wavelength of 223 nm.
c. HPLC data were analyzed by Waters Millennium 32 software (Version 4.0, Waters).
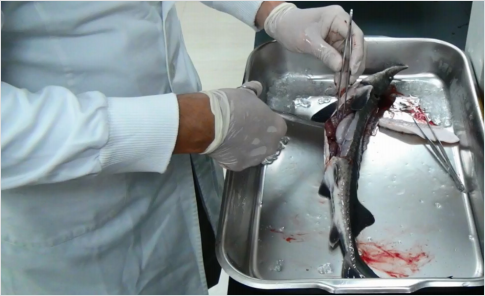
Figure 4: Sacrifice, anatomy and tissue/organs collection from Bester sturgeon. At each time point of the experiment (6 fish per time point/group at day 3, day 5, day 7, day 10, day 14, day 21, and day 28 after the p.o. administration), fish were sacrificed, and muscle and liver samples were collected. The supernatant of homogenized muscle and liver were immediately decanted and frozen at -80°C and stored until assay.
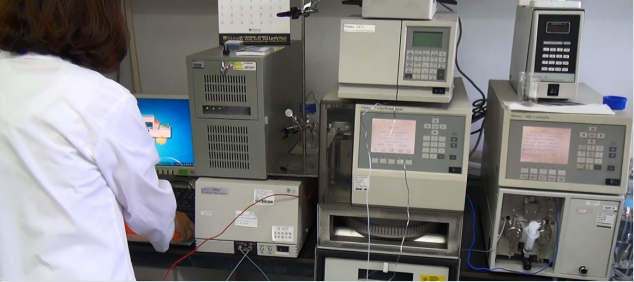
Figure 5: Pharmacokinetic study of FFC in cultured Bester sturgeon by HPLC equipped with UV detector. The HPLC system equipped with a Waters model 600e quaternary solvent delivery system, a Waters model 717 autosampler, a Waters model 996 photodiode array detector, and a 5 μm, 4.6 × 150 mm i.d. Cosmosil 5C18-MS column. The chromatograms were detected via UV detector with the screening wavelength of 210 to 290 nm and the excitation wavelength of 223 nm. HPLC data were analyzed by Waters Millennium 32 software version 4.0.
Method Validation [4]
a. Linearity was assayed according to the slopes, intercepts.
b. Correlation coefficients of the calibration curves were calculated by linear regression analysis.
c. The quantitative recovery of FFC was determined by repetitively analysing blank sera, muscle and liver with known amounts of FFC (0.1, 0.2, 0.5, 1, 2, 5, and 10 μg mL-1).
d. After reconstituting the residue with 0.05 M ammonium acetate-acetonitrile-tetrahydrofuran (76: 23: 1, v/v; pH 7.2), added the internal standard at the end.
e. Calibration curve was constructed by extracts of sera, muscle, or liver added to FFC immediately prior to injection, corresponding to 100% recovery.
f. The working standard calibration curve was drawn by plotting the known FFC concentrations against the average peak area.
Quantification [4]
a. Ten mg mL-1 FFC stock solution in methanol was diluted into working solutions of 100, 10, and 1 μg mL-1 with distilled water.
b. Standardization was performed by a high-concentration and a low-concentration range.
c. Blank sera, muscle and liver extract samples were exposed to known amounts of FFC (0.1, 0.2, 0.5, 1, 2, 5, and 10 μg mL-1) and were transferred to autosampler tubes for direct application to the HPLC column.
d. The presence of FFC in serum and tissue samples was screened by HPLC method with ultraviolet photodiode array detection.
e. The internal standard was analyzed as the unknown samples.
f. The FFC concentrations in unknown samples were read from the standard curve.
g. Accuracy was evaluated indirectly because of the lack of certified samples or reference methods.
h. Comparing with the resulting peak area ratios of blank sera, muscle and liver extract samples with known amounts of FFC (0.1, 0.2, 0.5, 1, 2, 5, and 10 μg mL-1) and water samples containing equivalent concentrations of FFC, the difference between these two sets of data was the bias of the method.
i. The limit of detection (LOD) and limit of quantification (LOQ) for FFC were estimated from the size of the FFC peak in spiked samples of blank sera, muscle and liver extract samples. They were defined as the concentrations that resulted in a detectable peak of approximately 4 and 10 times of the noise level, respectively.
Assay Validation [5]
a. FFC concentration in samples was determined using the linear regression line (unweighted) of the concentration standard versus peak area (r2 > 0.995).
b. The precision of the method was expressed as the intra-day and inter-day coefficients of variation (%). FFC at concentrations of 0.1, 1, and 10 μg mL-1 were assayed (three replicates) on the same day and on three sequential days, respectively.
c. The accuracy (% bias) was calculated from the nominal concentrations (Cnom) and the mean value of the observed concentrations (Cobs) as follows: bias (%) = [(Cobs - Cnom) / (Cnom)] × 100.
d. Accuracy and precision values within ± 20% covering the actual range of experimental concentrations were considered acceptable.
e. The relative standard deviation (RSD) was calculated from the observed concentrations as follows: precision (% RSD) = [standard deviation (SD) / Cobs] × 100.
Pharmacokinetic Analysis [4,6,7]
a. Pharmacokinetic parameters were calculated with WiNonlin professional software version 1.0 (Pharsight Coporation, NY, USA) according to a non-compartmental 202 model.
b. Model discrimination was based on the correlation coefficient of the curve fit, and the absolute error was independent of the concentration (weighted regression).
c. The parameters evaluated for serum were half-lives (t1/2, h) at each phase, time to maximum concentration ( Tmax, h), maximum concentration (Cmax, μg mL-1), mean residence time (MRT, h), clearance (L kg-1 h-1), area under the concentrationtime curve from 0 h to infinity (AUC0-inf, h × mg L-1), and the apparent volume of distribution (V/F, L kg-1).
d. Sera FFC concentration vs. time was analyzed using model-independent standard methods (n = 6 per time point).
e. The terminal elimination rate constant (λ) was derived by the unweighted least square regression analysis of at least last four time points of the semilogarithmic sera concentrationtime curves.
Statistical Analysis
Data are shown as mean ± the standard error of the mean (SEM). Student’s t-test was used for statistical analyses. Differences between groups were considered statistically significant at *p < 0.05.
For the Results Presentation- There is One Session 2:40 min Long
Relevant results were adapted from [Aquaculture 495: 558-567] [8].
a. Table 1. Pharmacokinetic parameters of FFC in serum of Bester sturgeon following single oral FFC administration at dose of 10 mg kg-1 BW.
b. Figure 6. Serum FFC concentrations after single oral FFC administration.
i) (A) Serum semilogarithmic concentrations of FFC.
ii) HPLC chromatographs for FFC residue (arrow) in the serum of sturgeon fed with FFC for (B) 48 h and for (C) 72 h.
c. Figure 7. FFC concentration time curve in liver and muscle following single oral FFC administration at doses of (A) 10 mg kg-1 BW and (B) 20 mg kg-1 BW.
d. Table 2. Mean muscle and liver FFC concentrations over time in Bester sturgeon following p.o. administration with FFC at a dose of 10 or 20 mg kg-1 BW, respectively.
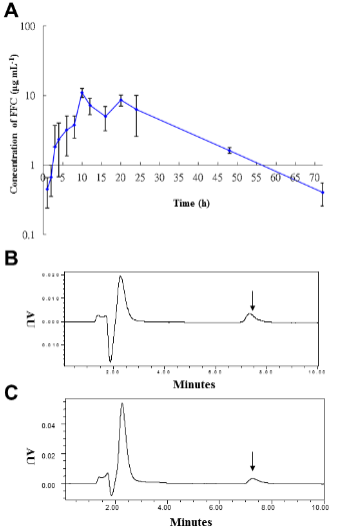
Figure 6: Serum FFC concentrations following single oral administration.
(A) Semi-logarithmical serum FFC concentrations against time (1, 2, 3, 4, 6, 8, 10, 12, 16, 18, 20, 24, 48, 72 h) after 10 mg kg-1 BW FFC oral administration.
(B) HPLC chromatographs for FFC residue (arrow) in the serum of sturgeon fed with FFC for 48 h.
(C) HPLC chromatographs for FFC residue (arrow) in the serum of sturgeon fed with FFC for 72 h. This figure has been modified from [Aquaculture 495: 558-567] [8].
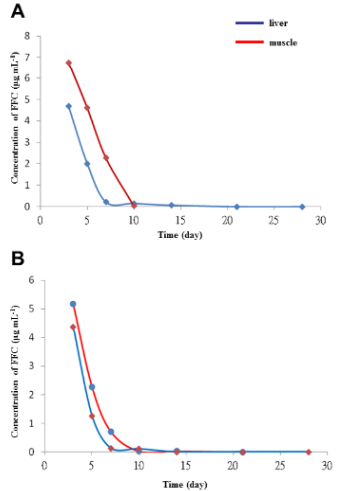
Figure 7: FFC concentrations in liver and muscle following single oral administration.
(A) The concentration time curve of FFC in the liver and muscle of sturgeon after single oral administration at a dose of 10 mg kg‐1 BW.
(B) The concentration time curve of FFC in the liver and muscle of sturgeon after single oral administration at a dose of 20 mg kg-1 BW. This figure has been modified from [Aquaculture 495: 558-567] [8].
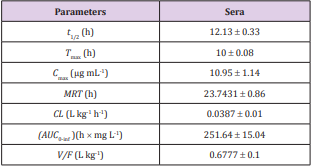
Table 1: Pharmacokinetic parameters for Bester sturgeon after 10 mg kg-1 BW p.o. administration of FFC.

Table 2: Mean FFC concentrations in muscle and liver of Bester sturgeon over time following p.o. administration of FFC at a dose of 10 or 20 mg kg-1 BW, respectively.
N = 6 per groups; “-” indicated that lower than the lowest concentration of detection; units: μg mg-1.
For the Highlights- There is one session 1:33 min long
a. Using of the accurate HPLC method with UV detection for FFC pharmacokinetics in Bester sturgeon.
b. The developed method technique may be a valuable tool was efficient in detecting the pharmacokinetics of FFC in Bester sturgeon.
c. According to Taiwan law in the allowed amount of FFC residue in the fish meat must be ≤ 1 µg mL-1.
d. The recommended withdrawal period of FFC in sturgeon was suggested for 15 days.
Representative Results
As shown in Table 1, the estimated pharmacokinetic parameters of FFC in serum were calculated according to a non-compartmental 202 model, including half-lives (t1/2, h) at each phase, time to maximum concentration ( Tmax, h), maximum concentration (Cmax, μg mL-1), mean residence time (MRT, h), clearance (CL, L kg-1), area under the concentration-time curve from 0 h to infinity (AUC0-Inf, h × mg L-1), and the apparent volume of distribution (V/F, L kg-1). Following single oral administration with FFC at dose of 10 mg kg-1 BW, estimated serum FFC t1/2 was 12.13 ± 0.33 h, the observed Tmax occurred at 10 ± 0.08 h, the Cmax was 10.95 ± 1.14 μg mL-1 for 24 h, the MRT was 23.7431 ± 0.86 h, CL was 0.0387 ± 0.01 L kg-1 h-1, the AUC0-Inf was 251.64 ± 15.04 h × mg L-1, and V/F was 0.6777 ± 0.1 L kg-1. The mean FFC concentrations in sera were plotted against time (1, 2, 3, 4, 6, 8, 10, 12, 16, 18, 20, 24, 48, 72 h) semi-logarithmically (Figure 6A).
Following FFC administration, the mean concentrations in sera were gradually increased at 1 to 8 hours as 0.45 μg mL-1 (1 h-FFC p.o.), 0.67 μg mL-1 (2 h-FFC p.o.), 1.82 μg mL-1 (3 h-FFC p.o.), 2.35 μg mL-1 (4 h-FFC p.o.), 3.2 μg mL-1 (6 h-FFC p.o.), and 4.33 μg mL-1 (8 h-FFC p.o.) and peaked at 10 hours (10.95 ± 0.58 μg mL-1), followed by a gradual decrease thereafter. In sera collected at 48 h and 72 h after oral administration, an obvious peak (223 nm) of FFC residue was detected at 7.3 min (Figures 6B and C). The concentration time curve in liver and muscle showed the changes in concentration overtime after single oral administration of FFC at doses of 10 and 20 mg kg-1 of BW (Figure 7). FFC concentrations in muscle and liver decreased slowly with time and were below the limit of detection at 10 and 14 days after oral administration, respectively (Table 1).
Discussion
The present work demonstrated a method for determining FFC retention and elimination in sturgeon culturing. The use of HPLC with UV detector successfully detected FFC pharmacokinetics and residual in sera and tissue of Bester sturgeon and developed an efficient tool to understand its metabolism. We demonstrated that FFC in sturgeon was rapidly absorbed in serum with time to maximum concentration value of 10 hrs and slowly eliminated in liver and muscle. In line with our findings, Gaunt et al. indicated a good absorption, distribution, bioavailability, and plasma concentration of FFC via the pharmacokinetic studies of FFC in channel catfish following either intravenous or oral administration of a single dose of FFC [9]. From a therapeutic point of view, the higher oral bioavailability and slower elimination of FFC than that in most antibiotics (amoxicillin, erythromycin, flumequine, lincomycin, oxalinic acid, oxytetracycline, and spiramycin) are important properties for treating with bacterial infections in aquaculture. However, antibiotic residues in animal-derived food stuffs cause multi-drug resistance of pathogens for antibiotics used in human medicine and bear a risk for the food-productionindustry [10].
As a result, the concerns over veterinary drug residues in food are increased globally. Various methods have been described for identifying FFC in animal tissues, including HPLC [11], liquid chromatography-mass spectrometry [12,13], gas chromatography [14], gas chromatography-mass spectrometry [15], and enzymelinked immunosorbent assay [16]. The HPLC and LC-MS/MS methods are widely analytical tools in pharmacokinetic study in several fish species. FFC residues in fish muscle have been monitored by HPLC-UV method, and results were close with those obtained using liquid chromatography-tandem quadrupole mass spectrometry. HPLC-UV method can be employed for the analysis of FFC metabolic kinetics simply and reliably regardless of different species and environmental condition [17]. The total concentration of residues of FFC and FFC amine in fish accepted by European Union were not exceeding 1,000 µg kg-1 [18]. In Taiwan, maximum residue limits for veterinary drugs allowed in fish is 1 μg mL-1. Our results showed that FFC concentrations in muscle and liver decreased slowly with time and were below the limit of detection at 10 and 14 days after oral administration, respectively. Accordingly, withdrawal periods of 15 days after oral administration of FFC in sturgeon are recommended for fish farm. These findings can provide valuable insight for designing optimal dosage regimens for FFC in aquatic agricultural system.
Acknowledgment
Authors wish to thank the Council of Agriculture in Taiwan (Executive Yuan) for supporting this study [93AS-1.8.1-BQ-B1 (3); 94AS-13.2.1-BQ-B1; 98AS-9.2. 4-BQ-B1(21); 99AS-9.2.2- BQ-B1(28)]. Drs. Yu-Wen Hung, Hsuan-Wen Chiu, Ching-Feng Chiu, Chien-Chao Chiu, Shao-WenHung, and Mr. You-Zhou Jiang, the employee of Han Si Fish Farm (Datong Township, Yi Lan County, Taiwan) participated in filming on Sep. 8, 2018. All healthy Bester sturgeon were provided from Han Si Fish Farm. We also thank the permission of Aquaculture to share partly data to Biomedical Journal of Scientific & Technical Research (BJSTR).
References
- FAO Fishstat Database (2007) FAO, Rome, Italy.
- Buschmann AH, Tomova A, López A, Maldonado MA, Henríquez LA, et al. (2012) Salmon aquaculture and antimicrobial resistance in the marine environment. PLoS One 7(8): e42724.
- Feng JB, Jia XP (2009) Single dose pharmacokinetic study of flofenicol in tilapia (Oreochromis niloticus × O. aureus) held in freshwater at 22°C. Aquaculture 289(1-2): 129-133.
- Wang W, Dai X, Li Z, Meng Q (2009) Tissue distribution and elimination of florfenicol in topmouth culter (Culter alburnus) after oral administration. Czech J Food Sci 27(3): 216-221.
- Ramos M, Muňoz P, Aranda A, Rodriguez I, Diaz R, et al. (2003) Determination of the chloramphenicol residues in shrimps by liquid chromatography-mass spectrometry. J Chromatogr B 791(1-2): 31-38.
- Fang W, Li G, Zhou S, Li X, Hu L, et al. (2013) Pharmacokinetics and tissue distribution of thiamphenicol and florfenicol in Pacific white shrimp Litopenaeus vannamei in freshwater following oral administration. J Aquat Anim Health 25(2): 83-89.
- Hung YW, Lin YH, Chan CY, Wang WS, Chiu CF, et al. (2019) Pharmacokinetic study of amoxicillin in Japanese eel, Anguilla japonica by high performance liquid chromatography with fluorescence detection. Aquac Rep 13: 100184.
- Hung YW, Lin YH, Chen MH, Wang WS, Chiu CF, et al. (2018) Pharmacokinetic study of florfenicol in Bester sturgeon, a cultured hybrid of Huso huso × Acipenser ruthenus by high performance liquid chromatography equipped with UV detector. Aquaculture 495: 558-567.
- Gaunt PS, McGinnis AL, Santucci TD, Cao J, Waeger P, et al. (2006) Field efficacy of florfenicol for control of mortality in channel catfish, Ictalurus punctatus (Rafinesque), caused by infection with Edwardsiella ictaluri. J World Aquacult Soc 37(1): 1-11.
- Azzouz A, Jurado Sánchez B, Souhail B, Ballesteros E (2011) Simultaneous determination of 20 pharmacologically active substances in cow’s milk, goat’s milk, and human breast milk by gas chromatography-mass spectrometry. J Agric Food Chem 59(9): 5125-5132.
- Lewbart GA, Papich MG, Whitt-Smith D (2005) Pharmacokinetics of florfenicol in the red pacu (Piaractus brachypomus) after single dose intramuscular administration. J Vet Pharmacol Ther 28(3): 317-319.
- Park BK, Lim JH, Kim MS, Yun HI (2006) Pharmacokinetics of florfenicol and its metabolite, florfenicol amine, in the Korean catfish (Silurus asotus). J Vet Pharmacol Ther 29(1): 37-40.
- Takino M, Daishima S, Nakahara T (2003) Determination of chloramphenicol residues in fish meats by liquid chromatographyatmospheric pressure photoionization mass spectrometry. J Chromatogr A 1011(1-2): 67-75.
- Zhang SX, Sun FY, Li JC, Cheng LL, Shen JZ (2006) Simultaneous determination of florfenicol and florfenicol amine in fish, shrimp, and swine muscle by gas chromatography with a microcell electron capture detector. J AOAC Int 89(5): 1437-1441.
- Shen JZ, Xia X, Jiang HY, Li C, Li JC, et al. (2009) Determination of chloramphenicol, thiamphenicol, florfenicol, and florfenicol amine in poultry and porcine muscle and liver by gas chromatography-negative chemical ionization mass spectrometry. J Chromatogr B Analyt Technol Biomed Life Sci 877(14-15): 1523-1529.
- Wu JE, Chang C, Ding WP, He DP (2008) Determination of florfenicol amine residues in animal edible tissues by an indirect competitive ELISA. J Agric Food Chem 56(18): 8261-8267.
- Granja RH, de Lima AC, Patel RK, Salerno AG, Wanschel AC (2012) Monitoring of florfenicol residues in fish muscle by HPLC‐UV with confirmation of suspect results by LC‐MS/MS. Drug Testing Anal 4(Supply1): 125-129.
- Fadaeifard F, Rahimi E, Raissy M, Faghani M (2015) Determination of florfenicol residues in the muscle and liver of cultured rainbow trout in Iran by ELISA. J Chem Health Risks 5(4): 267-272.
