 Research Article
Abstract
Considering the high cost and time-consuming of biomedical experiments, people are increasingly paying attention to computational methods to solve biomedical problem. In this paper, the multi-view clustering method is used to classify breast cancer. Unlike the previous machine learning method which assign weights to each attribute. In this paper, a multi-view clustering method is proposed to predict the category of Breast Cancer. Here ten attributes of breast cancer are regarded as ten different views. But in ten different views, they have a common consensus. We learn a consensus graph with minimizing disagreement between different views. Then we analyzed the attributes which affected the performance and analyzed the effect of parameters. Research shows that our algorithm can achieve good performance which reached about 96.88% accuracy.
Keywords: Breast cancer category; Unsupervised learning; Multi-view clustering; Graph learning/p>
Introduction
In recent years, cancer has become a major disease endangering human health, lots of data show that about 9.6 [1] million people die of cancer every year. Among them, about 630 [1] thousand people died of Breast cancer. It has become an important issue to distinguish benign cancer from malignant cancer. There are many evaluation indicators affecting the classification of cancer such as clump Thickness, Uniformity of Cell Size, Uniformity of Cell Shape, Marginal Adhesion, Single Epithelial Cell Size, Bare Nuclei, Bland Chromatin, Normal Nucleoli, Mitoses and etc. In-depth study of them is of great significance.
Machine learning and deep learning have become the hottest AI learning nowadays [2]. Clustering algorithm is widely used in machine learning [3-5]. Traditional clustering algorithms have to set the weight for different attributes and then fit it, in order to get more accurate conclusions and deeper characteristics of the data. They need to define a scale to measure similarity. There are many methods to measure the similarity between two notes. The first way is to define the distance between data, and the second way is to directly define the similarity between data. One of the most common methods is the Euclidean distance. K-means algorithm is the most commonly clustering algorithm which takes K as parameter and divides n nodes into k clusters. It is very important to exploit the mutual agreement of diverse views information to obtain better clustering performance than using any single data view [6].
Multi-view data are existing everywhere [7,8]. For example, a new can be reported by multiple articles in different languages; A person can be identified by fingerprint, signature, face, and voice. A paragraph of text can be expressed in a variety of fonts. An image can be represented by different types of descriptors. With the increasing number of multi-view data, people pay more attention to multi-view methods, people find that it is more and more widely used. In this paper, a multi-view clustering method is proposed to predict the category of Breast Cancer. The author’s opinion is that, each attribute of Breast cancer can form a graph. Each graph reflects the association between Breast cancer from a different view. There exists a common consensus between different views. We learn a consensus graph with minimizing disagreement between different views. Then we can find deeper connections between Breast cancer through so many different graph views. This article is organized as following section. In section 2, we introduce the data materials. In section 3, we show the multi-view method in detail. Then we can see the good performance in section 4 and the parameter sensitivity in section 5. In section 6, it is the evaluation index. Finally, it is the conclusion section.
Data Materials
The data materials in this paper come from the famous UCI machine learning database, which has a large number of AI mining data. The database is constantly updated. The types of databases cover all fields, such as life, engineering and science. The data set selected in this paper is Breast Cancer Wisconsin (Original) Data Set. These data were collected from clinical case reports of the University of Wisconsin Hospital in the United States. There were 569 data records. The class distribution was 357 benign (value= 2), accounting for 63%, and 212 malignant (value= 1), accounting for 37%. Each record has 12 attributes. Following Table 1 shows the 12 attribute names and descriptions of the data set (Table 1).
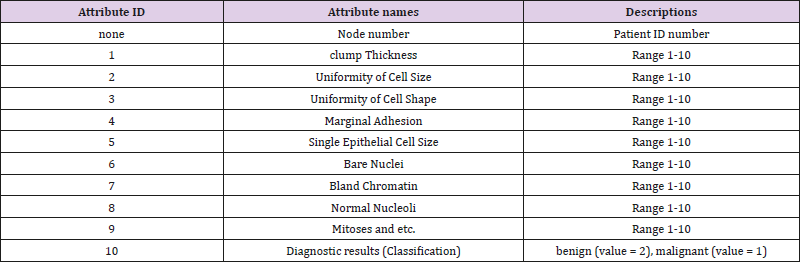
Table 1: Descriptions of the data set.
The attribute of Patient ID number and Diagnostic results have only one real value. The other 10 attributes have 3 real value separately, which express mean, standard error, and “worst” or largest (mean of the three largest values) of these features were computed for each image, resulting in 30 features. For instance, field 3 is Mean Radius, field 13 is Radius SE, field 23 is Worst Radius. We can think of these 10 real-value attributes as 10 views. Each view has 3 features.
Model Formulation
The Breast Cancer data set will be denoted by X = {X1, X2,......, X10}
and it has 10-attribute views. Each view of Xi ∈Rd×n has d
dimension and n data points. Here, d=3 and n=569. All of the data
points have 2 clusters. The goal of spectral clustering is to partition
data points into k clusters [6, 9, 10]. Firstly, we use the Euclidean
metric to compute the distance between the notes pairwise i x
and xj. Then we can construct the similarity matrix W= [wij] ∈ Rn×n.
Secondly, we normalize the W matrix to the Laplacian matrix L [11].
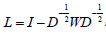 , where I is an identity matrix, and D is a diagonal matrix with each diagonal element
 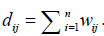 Then the
eigenvectors H of the normalized Laplacian matrix L are regarded
as the low dimensional embedding of the raw data X. Finally, the
objective function is given by,
Then the
eigenvectors H of the normalized Laplacian matrix L are regarded
as the low dimensional embedding of the raw data X. Finally, the
objective function is given by,
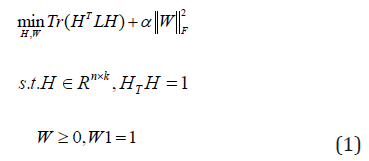
Where α is a regularization parameter, and W is constrained by W1 =1so that a normalized Laplacian matrix L=I-W will be obtained. For view number i=1 to v, each view of graph W(i) are learned by the Eq. (1). Firstly, we use the graphs W(i) to learn the different embedding matrices H(i). Secondly, we use a global graph S to minimize the disagreement between each view H(i), where H(i) (H(i) )T=I. Then, we optimize the overall objective function.
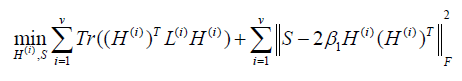
where LS is the normalized Laplacian matrix since S is constrained by S1 =1.
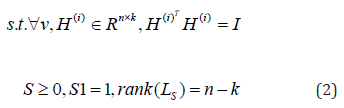
Firstly, we are updating H(i) to fix S, β1 > 0 , then let β1 = 2β. Then Eq. (2) becomes
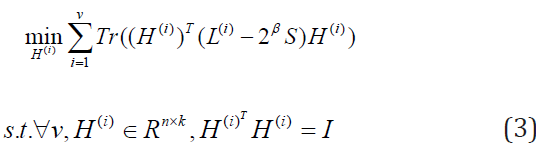
Secondly, we are updating S to fix H(i), Then Eq. (2) becomes
We repeat the above two steps until S has 2 connected components.
Experimental Results
There are only two types of data set results, so we test it in two categories. We can see that different colors denote different cluster labels. We have ten views so corresponding to 10 figures. To be more intuitive, we visualize the data points and the clustering results with t-distributed stochastic neighbor embedding (t-SNE) [12] in different views as shown in Figure 1. If we take all 10 views into account, the overall accuracy rate is 93.69%. It will be better than consider only one view. In terms of classification accuracy and results, this algorithm can make accurate judgments on breast cancer data sets. However, in order to improve the accuracy, some attributes may interfere with the classification results. We analyzed that if we drop some attribute views from our data and only considers the combination of the other attributes view, will the accuracy be improved? (Figure 1).
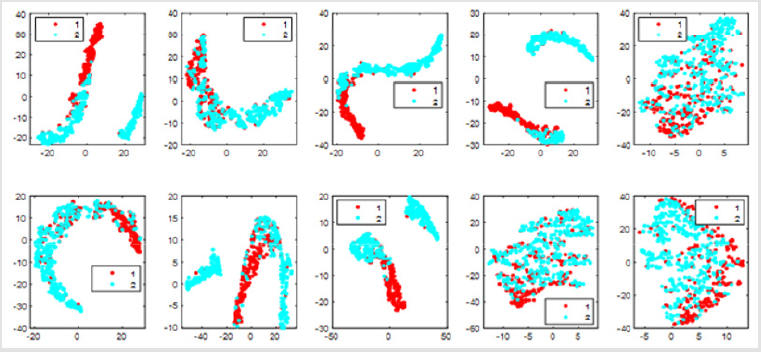
Figure 1: Visualization of the clustering results of UCI Breast Cancer data with t-SNE in different views.
Experiments show that our thinking is right. When we drop one of the views and only use nine of them, the accuracy will be improved. The results are shown in the following Figure 2. The accuracy will variety between 0.913 to 0.947. If we drop the number 6 attribute the accuracy will be improved to 0.947 (Figure 2).
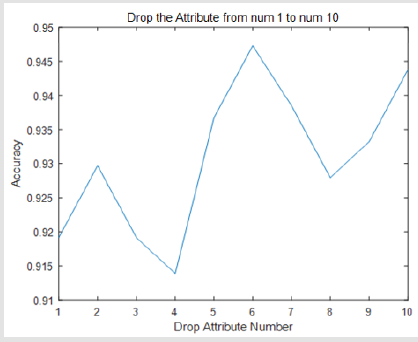
Figure 2: The accuracy verified if we drop one attribute view from 10 attribute views.
When we drop two of these views and using only eight views of them. We can see that the accuracy will variety between 0.9 to 0.96. It can be shown in the following Figure 3.
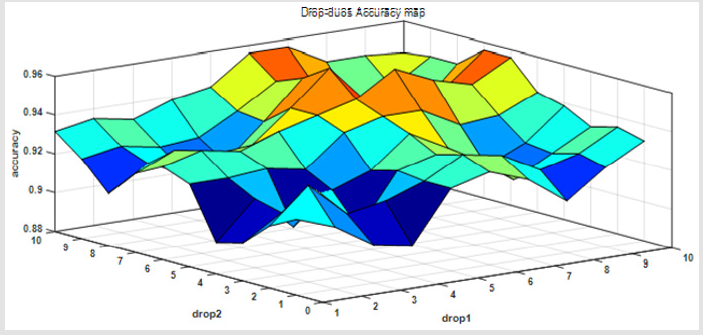
Figure 3: The accuracy verified if we drop two attribute views from 10 attribute views.
When we drop three of these views and using only seven of them, our results are as follows (Figure 4).
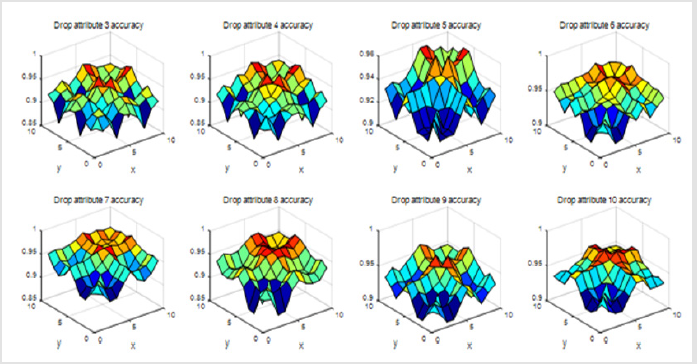
Figure 4: The accuracy verified if we drop three attribute views from 10 attribute views.
Finally, we found that if we drop attribute 6, attribute 7, attribute 10, and only keep the combination of the other 7 attribute views, our classification results of accuracy will be best. This shows that whether the Breast cancer is benign or malignant have little relevance to attribute 6, attribute 7, attribute 10. There is only one parameter β in the objective function Eq (2). If we drop attribute 6, 7, 10, the accuracy varies with β on our dataset. It can be seen from Figure 4 that the performance is stable when it varies in a range of [0.958, 0.968] (Figure 5). We can get the conclusion from Table 2 that if β=0 we can get the highest accuracy and the best performance of all the other evaluate metrics (Figure 6).
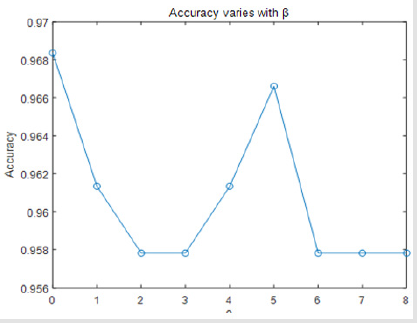
Figure 5: The accuracy verified if we verify the parameter β.
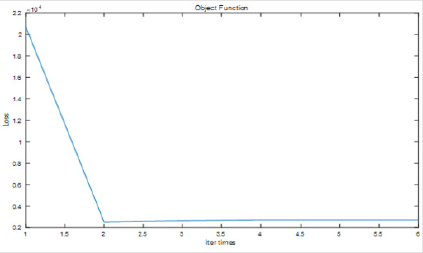
Figure 6: The object function performance if we increase the iterating times.

Table 2: Drop attribute 6,7,10, and verify the parameter β, the performance of six metrics values.
As we can see from the figure above, the iterations only need to be iterated twice, and our object function has been optimized to the minimum loss. If the number of iterations increasing, the objective of the optimization results will not be lower.
Evaluation
Six metrics are used to evaluate the performance: clustering accuracy (ACC), Purity, Precision, Recall, F-score [13], and adjusted rand index(ARI). For these widely used metrics, the larger value indicates the better clustering performance. These metrics are calculated by comparing the obtained label of each sample with the ground-truth labels provided in datasets.
ACC measures clustering accuracy and is defined by
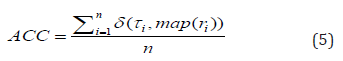
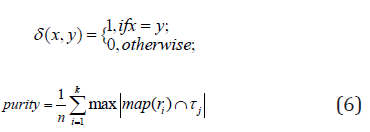
where n data points are belonging to k clusters, τi denotes the ground-truth label of the ith sample, ri denotes the corresponding learned clustering label, and δ(·,·) denotes the Dirac delta function:
and map(ri) is the optimal mapping function that permutes the obtained labels to match the ground-truth labels. The best mapping is found by the Kuhn-Munkres algorithm [14].
Purity is the percentage of correct labels and is defined by:
Precision and Recall [3] are defined by:
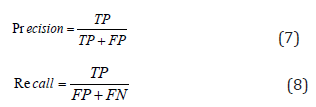
where TP, FP, and FN denote the number of items correctly labeled as belonging to the positive cluster, wrongly labeled as belonging to positive cluster, and wrongly labeled as belonging to negative cluster, respectively
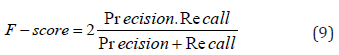
F-score is then defined by calculating the harmonic mean of Precision and Recall.
ARI is defined by:
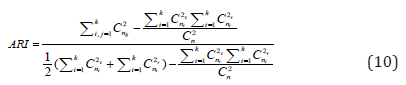
where combination operation Cnm is defined as a selection of m items from a collection n.
Conclusion
Unlike previous machine learning clustering methods, previous clustering algorithms assign a weight to each feature and adjust the weight parameters of each feature to fit the results. This approach may result in better fitting. As long as a set of most suitable weights is obtained, a suitable function can be obtained to fit the desired results, but there is no doubt that there is cheating. From the medical point of view, we construct 10 views according to 10 different attributes of breast cancer. There is a common consensus between different views. With each case as the vertex, the number of vertices in 10 views is fixed. The distance between each two points constitutes a similarity matrix. Each view is relatively correlated and independent, and only a single weight β parameter is used to fit the experiment. Although we have only one parameter, the experiment proves that we have achieved good experimental results, and multi-view fusion should be a trend in the future. Our disadvantage is that all edges and nodes in the graph have only one type. In the future, we intend to extend our algorithm to heterogeneous network graphs.
Acknowledgement
This work was supported in part by the National Natural Science Foundation of China under Grant 61703196, in part by the Natural Science Foundation of Fujian Province under Grant 2018J01549, and in part by “intelligent mine construction and industrialization based on Internet of things and virtual reality” project of Fujian industrial field regional development under grant number 2019H4021.
References
- Mccarthy D, M Apidianaki, K JCL Erk (2018) Word sense clustering and clusterability. Computational Linguistics 42(2): 245-275.
- Yaram S (2017) Machine learning algorithms for document clustering and fraud detection. International Conference on Data Science & Engineering.
- Graham ED, JF Heidelberg, BJJP Tully (2017) BinSanity: unsupervised clustering of environmental microbial assemblies using coverage and affinity propagation. Peer J 5: e3035.
- Xu L, Wensheng Dou, Chushu Gao, Jie Wang, Jun Wei, et al. (2017) SpreadCluster: Recovering Versioned Spreadsheets through Similarity- Based Clustering. Mining Software Repositories pp. 158-169.
- Yu X, G Yu, Jun Wang (2017) Clustering cancer gene expression data by projective clustering ensemble. PLOS ONE 12(2): e0171429.
- Ng AY, MI Jordan, Y Weiss (2001) On spectral clustering: analysis and an algorithm. in Adv Neural Inf Proc Syst.
- Sungheetha A, R Sujitha, V Arthi, R Rajesh Sharma (2017) Data analysis of multiobjective density based spatial clustering schemes in gene selection process for cancer diagnosis. International Conference on Electronics & Communication Systems.
- Zong L, Xianchao Zhang, Long Zhao, Hong Yu, Qianli Zhao (2017) Multiview clustering via multi-manifold regularized non-negative matrix factorization. Neural Networks 88(88): 74-89.
- Luxburg UVJS (2007) A tutorial on spectral clustering. Statistics and Computing 17(4): 395-416.
- Shi J, JJITp, Ami Malik (2000) Normalized cuts and image segmentation. IEEE Transactions on Pattern Analysis and Machine Intelligenc 22(8): p. 888-905.
- Belkin M, P Niyogi (2001) Laplacian Eigenmaps and Spectral Techniques for Embedding and Clustering. neural information processing systems.
- Der Maaten LV, GEJJo, MLR Hinton (2008) Visualizing Data using t-SNE. 9: 2579-2605.
- Ding, S (2009) Feature Selection Based F-Score and ACO Algorithm in Support Vector Machine. IEEE international symposium on knowledge acquisition and modeling workshop.
- Zhu H, Dongning Liu, Siqin Zhang, Yu Zhu, Luyao Teng, et al. (2016) Solving the Many to Many assignment problems by improving the Kuhn- Munkres algorithm with backtracking. Theoretical Computer Science 618: 30-41.
