 Research Article


Abstract
Pig heart muscle (Myocardial) Degeneration (MyCD) was efficiently treated since the 1960’s with Selenium (Se), but there are scanty published data on human MyCD. Mineral Fertilization (fm) Parameters, including (P/Mg).fm, have often explained less CHD (Coronary Heart Disease) than Non-CHD (others than CHD), but about similarly CVD (Cardiovascular Diseases) and Non-CVD (others than CVD). This study is treating (mortality from) MyCD, CVD and its subtypes: CHD, “cardiac diseases others than CHD” ([Card.oth]), Cerebrovascular (CbrVasc) and other Vascular Diseases ([Vasc.oth]) of Whole Population (WP) and aged 15-64 (15_64), as well as their associations with (P/ Mg).fm, (CaMgNPK).fm, silage production (availability of vitamin E) and human sugar consumption, based on old data. Associations, as concerning Se, are mainly represented by figures, but [Card.oth] and its subtype MyCD are represented by regressions, too. Fertilizer data are slightly smoothened.
Results: CHD. (WP) deviated positively from CVD for the whole period, CHD. (15- 64) positively before 1993 and after 1996 negatively. Others deviated mainly negatively. [Card.oth]’s (and [Vasc.oth]’s to a lesser amount) behaved like mirror-images to CHD. [CbrVasc] behaved like CVD. Non-CVD. (15_64) epidemic (1984-94) associated with peak of CaMgNPK with a small delay. Non-CVD. (WP) caused ca 41,000 extraordinary deaths in 1982-2000. MyCD and [Card.oth] were explained (54.8 – 90.7 %) (p < 0.001) by [P/Mg], [P/Mg;CaMgNPK], [Sugar] and [Silage]. Suspected Se changes are seen after 1985-86.
Conclusion: Fertilization parameters, sugar consumption and silage production explained changes in MyCD and [Card.oth].(15_64) by 55-91 % (p< 0.001). Reduction in [Card.oth], CbrVasc and [Vasc.oth] was faster than in CHD before 1991. Epidemic of Non-CVD associated with maximal total/carbonate fertilization.
Keywords: CVD; Non-CVD; CHD; Other Cardiac mortality (than CHD); Myocardial Degeneration; Sugar; Selenium; Fertilizers; Silage
Abbreviations: 3ym: 3-Year Sliding Mean, i.e. X.3ym.i = 1/3*[(X.(i-1) + X.i + X.(i+1)]; 3ymw: 3-yr Mean Weighted Mean; i.e. X.3ymw.i = ¼*[(X.(i-1) + 2*X.i + X.(i+1)]; (Acc.&.Viol): Accidents and Violence; [Card.oth]: Other (than CHD) Heart Diseases excl. Rheumatic and Alcohol-Related (I30-I425, I427-I52); CbrVasc: Cerebrovascular diseases (I60-I69); CVD: Diseases of the Circulatory System Excl. alcohol-related (I00-I425, I427-I99); CHD (as in referred papers): Ischaemic heart diseases (I20-I25); FM: Human (Females and Males); [Vasc.oth]: “Other Diseases of the Circulatory System (I00-I15, I26-I28, I70-I99); WP: Whole Population; (15_64): Population Aged 15-64 (modified abbreviation for ruling spelling in Exel)
Introduction
Heart muscle (Myocardial) degeneration (MyCD) was efficiently treated by pigs since the 1960’s, but little or nothing has been published on human MyCD [1], if surgical treatments (on an average 16 transplantations annually to adult patients in 1985-2012) [2] are excluded. K/Mg and P/Mg fertilization ratios have associated differently with (mortality from) CHD and Non-CHD [3,4]. Available linear regression (numerical) analyses by fertilizer factors have not anyhow satisfactorily explained mortality difference between CVD and Non-CVD [5].
Historical data shows that fatal pig MyCD was practically ceased before 1971 through improved grain harvesting and postharvesting methods and fodder Se supplementation [6]. Anyhow Se content of human diet was unsatisfactory (29 mcg/d) still at the mid 1970´s [7]. Se fertilization since autumn 1984 elevated Finnish dietary and body content to satisfactory level [8]. 1986 was the first year, when domestic food and fodder were Se enriched from January to December. It was suspected that the changes in cattle fodder could have had effects on human mortality.
The aim of this study is to clarify associations of selected fertilization factors, sugar consumption and silage production with mortality groups Tot, CVD, Non-CVD and its subtypes of CVD (CHD, [Card.oth], CbrVasc, [Vasc.oth] and the subtype of [Card.oth], MyCD, in the whole population (MyCD.WP) and aged 15-64 (MyCD. (15_64).
Materials and Methods
Mineral fertilization (fm) factors (P/Mg) and approximate total fertilizer consumption (CaMgNPK), NPK (Eq/ha) and carbonate Liming agents (Lim.ag) (kg/ha) are the same (and from the same sources) as in [5]. Annual mortality data (1/100,000) are from Statistics Finland, as mortality from MyCD [9], (Tabl.1). Data on total mortality (Tot), CVD and its subtypes {1. CHD, 2. “cardiac diseases other than CHD” [Card.oth], 3. cerebrovascular [CbrVasc] and 4. other vascular diseases [Vasc.oth]} of whole population (WP) and aged 15-64 (15_64) [10] are from Statistics Finland in free access. Data on silage production, i.e utilization, are from Statistical Yearbooks of Finland [11]. Human sugar consumption data (as an dilution indicator of protective nutrients) are provided by Food Balance Sheets of FAOSTAT [12]. Se associations are represented as vertical lines on year 1985 or 1986 on several figures. Population data for calculating the excess Non-CVD mortality for the epidemics is provided by Statistics Finland [13].
Non-CVD has been attained by subtracting CVD from Tot and Non-CHD by subtracting CHD from Tot, which includes Accidents and Violence – (Acc.&.Viol), too. To avoid the potential risk to mix Non-CVD with pure “disease-Non-CVD” (Tot.nat – CVD), in figures, its label has been kept as (Tot – CVD), in order to keep the database intact. So Non-CVD has been used as synonym for (Tot-CVD) and respectively Non-CHD for (Tot-CHD).
Associations are mainly represented by figures, but [Card.oth]. (15_64) and its subtype MyCD.(35_64), as well as MyCD(65_74) are represented by regressions, too.
Fertilizer data are slightly smoothened, i.e. utilized as 3-yr mean weighted means (3ymw). X.3ymw.i = ¼*[(X.(i-1) + 2*X.i + X.(i+1)], in order to reduce the lateral shift of oblique parts of curves. Mortality curves are not smoothened with one excetion: Non-CVD. (15_64) is given additionally in form of 3-year sliding mean: X.3ym.i = 1/3*[(X.(i-1) + X.i + X.(i+1)] (Fig. 8).
Figure 1 represents consumption of Total and NPK fertilizers (kiloequivalents/ha), as well as carbonate liming agents (kg/ha) , i.e. CO3-fertilizers (3ymw-softened, as represented in Materials and Methods). (Ca and Mg are included in other fertilizers than carbonates, too). In Finland Mg-% has varied between 2 and 7 % in 1950 – 2000). Amounts of Lim.ag can be changed from kg’s to approximate CO3 equivalents (CO3.appr) by multiplying the amounts by selected fixed coefficient, which is increasing from 20.24 to 20.89, depending on Mg-% (from 2.0 to 7.0 %). 1.5 % change in Mg-% selection changes CO3.appr value only by 1 % .In order to avoid new calculations for different periods Lim.ag’s have been used as such, because variation in it is the same as in CO3.appr. For Fig. 1. has been selected period 1971-2000, with biggest changes in fertilization. CaMgNPK and Lim.ag had two elevation periods: in1977-92 and in 1992-2000. Elevation periods of NPK were in 1969-77 and in 1977-92. CaMgNPK and Lim.ag had highest peaks in 1984, NPK in 1977 (and nearly as high in 1988). By approximated Mg-%’s [2] and of amount of Lim. ag’s [5] calculated CO3 composed in the 1970’s 28 % and in 1980-99 45 % of total fertilization.
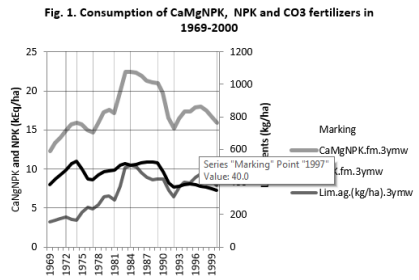
Figure 1:
Figure 2 presents changes in P/Mg and K/Mg fertilization ratios in 1971-2000, the period with biggest changes in fertilization. P/ Mg and K/Mg decreased between 1970-84, made upward deviation between 1984 and 1990-91. After that they were mainly declining until 1996-97 and increasing after that.
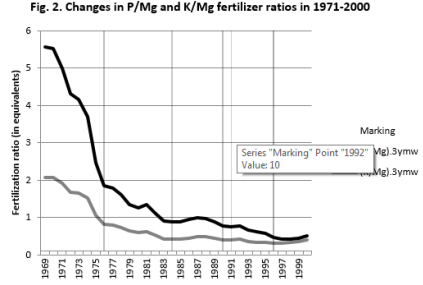
Figure 2:
Figure 3 shows changes in Total (Tot), Tot natural (Tot.nat), CVD and CHD mortality and mortality caused by Accidents and Violence (Acc.&.Viol) in whole Finnish population in 1971-2017. Between 1984 and 1994 is to be seen elevations in all causes of mortality groups. Difference between Tot and Tot.nat (caused by Accidents and Violence) is rather small.
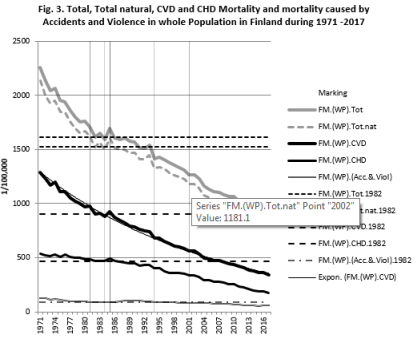
Figure 3:
Figure 4 shows Tot, Tot.nat, CVD, CHD and (Acc.&.Viol) mortality, aged 15-64, in Finland during 1971 -2017. Between 1984 and 1994 is to be seen elevations in all mortality groups, stagnation in CVD and CHD begun in 1983. Difference between Tot and Tot.nat, caused by (Acc.&.Viol) is proportionally higher than in (WP).
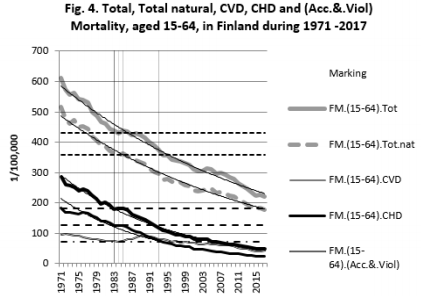
Figure 4:
Figure 5 shows changes in CVD, Non-CVD, CHD and [Card. oth] mortality of the whole population relative to 1971. [Card.oth] deviated negatively and CHD positively to CVD for the whole period. [CHD] deviation from CVD increased to 1994 (up to 23 %-units) and decreased after that. [CVD] deviation from CVD increased to 1996 (up to 30 %-units) and decreased after that. (Tot-CVD) exceeded its level of 1982 in 1983-2000. Between 1982 and 2001 Non-CVD caused 41,046 extraordinary deaths.
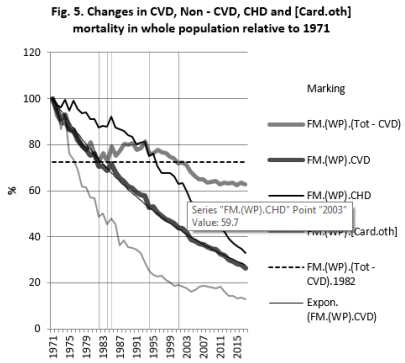
Figure 5:
Figure 6 represents changes in original and (3ym) smoothened Non-CVD, CHD, CVD and [Card.oth] mortality, aged 15-64, relative to 1971. Until 1990 [Card.oth] reduction was faster to CHD and slower after 1994 (even stagnation in 1994-2012. [Card.oth] deviated strongly (to negative direction) from CVD in 1971-1978. After that [Card.oth] came horizontally closer and reached CVD in 1986. In 1986-94 it declined alongside to CVD and deviated horizontally from it in 1996-2012. Non-CVD exceeded its 1984 value between 1984 and 1994 and caused 4,688 extraordinary deaths (calculated by original values). CHD deviated positively to CVD before 1993 and negatively after 1996. Smoothened Non-CVD.3ym determines the start point for Non-CVD epidemic to 1983 (the same as the beginning of CHD and CVD stagnation).
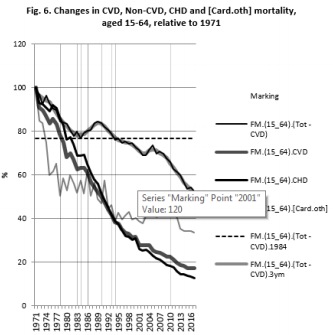
Figure 6:
Figure 7 shows CVD, Non-CVD, Non-CHD, CbrVasc and [Vasc. oth] mortality relative to 1971 in the whole population. Generally CbrVasc and [Vasc.oth] deviated negatively from CVD, but less than [Card.oth] (in Fig. 5). [Vasc.oth] is increasing after 2006. CbrVasc and as well as [Vasc.oth] are treated only superficially in this article. 1985 has been marked as year before the whole-year-Seenrichment.
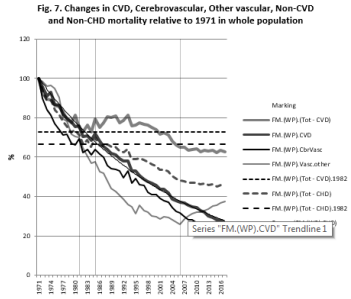
Figure 7:
Figure 8 represents CVD, Non-CVD (original and smoothened), Non-CHD, CbrVasc and [Vasc.oth] mortality, aged 15-64, relative to 1971.
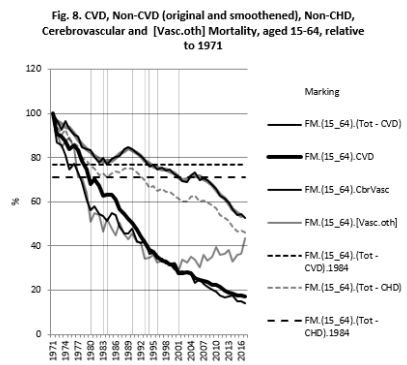
Figure 8:
Non-CVD deviation from its 1984 level is lower and shorter than by (Tot-CVD). [Vasc.oth] is seen to deviate negatively to CVD in 1971-1996 and after 2001 positively. Its downward deviation from CVD decreased remarkably between 1980 and 1990. During 1990- 2001 [Vasc.oth] declined alongside to CVD and deviated upwards from it after 2001. CbrVasc declined similarly in 1971-2001, but after that alongside to CVD.
Figure 9 shows relative proportions of CVD.(WP) subtypes in CVD mortality during 1971-2017. CHD (42-60 %) forms a downwards opening curve with top in 1999, [Vasc.oth] (8-18 %) and [Card.oth] (8-20 %) are like mirror-images of CHD. CbrVasc has been rather stable (mean 23 %).
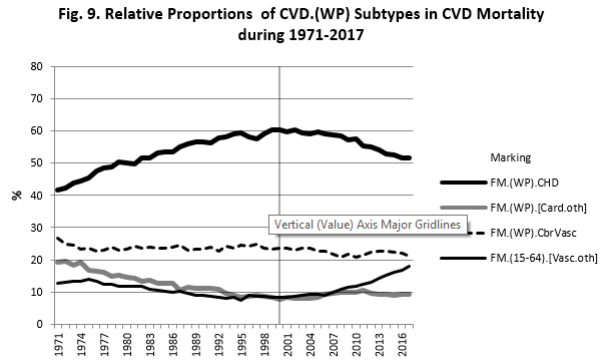
Figure 9:
Figure 10 shows relative proportions of CVD.(15_64) subtypes in CVD mortality during 1971-2017 (together 100 %). CHD (47- 71 %) forms a downwards opening curve with top in 1980. [Vasc. oth] (6-19 %) and [Card.oth] (6-18 %) are like mirror-images of CHD. CbrVasc stayed rather stable (16-21 %). Proportional CHD reduction seems to accelerate since 1985. Mortality from CVD subtype, in age group 15-64, indicates obviously more closely their incidence than mortality in whole population.
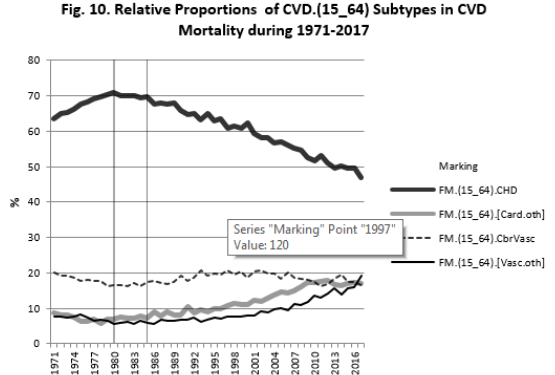
Figure 10:
Regressions
Regressions are calculated for the period, when [Card.oth. (15_64)] (since 1971) and MyCD.(35_64) (up to 2007), fertilization and sugar data were available Table 2. Regressions for silage are concerning period 1971-2000.
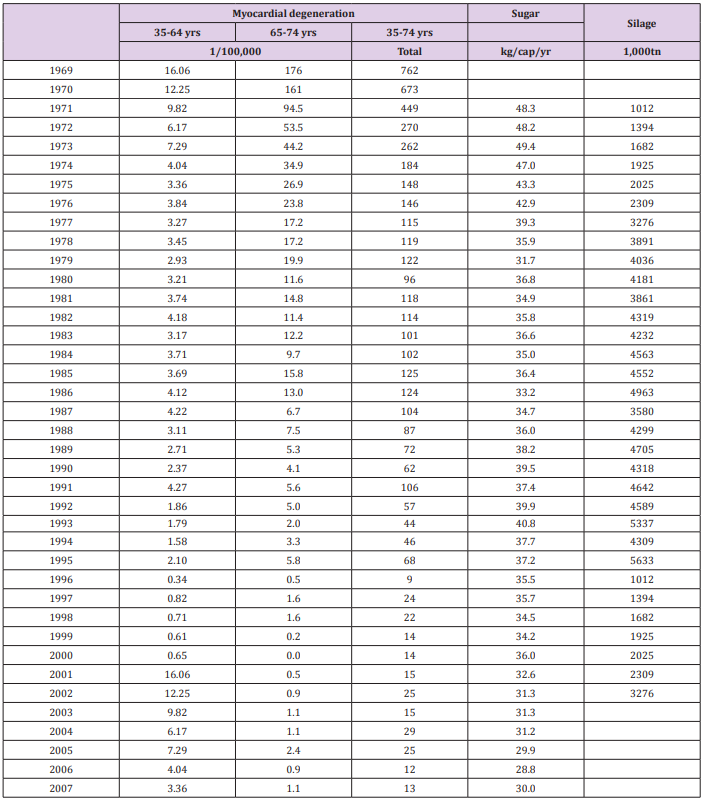
Table 1: Human Mortality from Myocardial degeneration, sugar consumption and silage production.
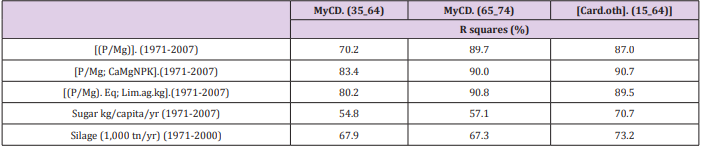
Table 2: Regressions of MyCD and [Card.oth] by fertilization factors [P/Mg], [P/Mg; CaMgNPK] and [(P/Mg); Lim.ag.kg], sugar consumption and silage production.
R squares were highest with [P/Mg;CaMgNPK] and [P/MgLim. ag] (80 -91 %), lowest with sugar. [P/Mg] explained nearly as well as [P/Mg;CaMgNPK] MyCD.(65_74) and [Card.oth]. All represented results were highly significant (p < 0.001).
Fig. 11. represents mortality from Myocardial Degeneration, aged 35-65, and its regression by fertilization ratio P/Mg. Regression explained variation in MyCD by 70.2 %. Positive deviation from the trend-line is seen between 1981 and 1996, during the elevation of CaMgNPK (Fig. 1). Average death-rate of MyCD.(35-64) was 2.7, range 0.34-9.8 (1/100,000), which can explain the great variation.
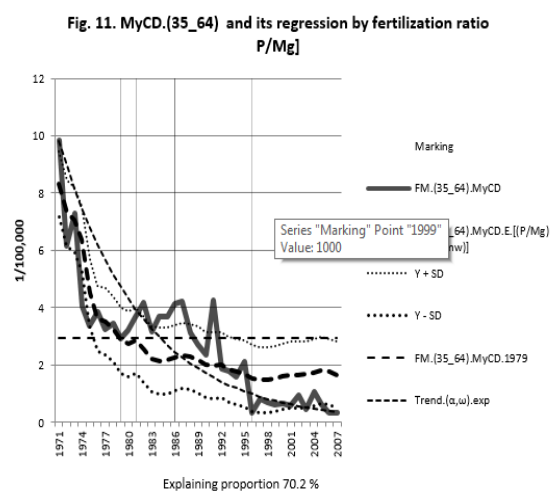
Figure 11:
Fig. 12. represents mortality from Myocardial Degeneration, aged 65-74, and its regression by fertilization ratio P/Mg. Regression explained variation in MyCD by 89.7 %. Between 1984 and 1987 is seen a “mini-epidemic” of MyCD, co-incidentally with the beginning of Non-CVD epidemic (Fig. 1). The second MyCD decline (since 1971) started after 1985 earlier than expected by the regression, 1988 – Se effect?
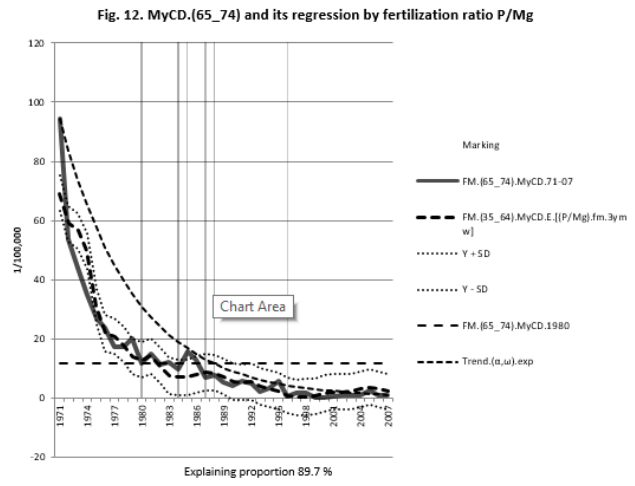
Figure 12:
Fig. 13. shows mortality from Myocardial Degeneration, aged 35-65, and its regression by P/Mg fertilization ratio and total fertilization. Regression explained MyCD variation by 84.3 % (p < 0.001 for both beta coefficients, too).
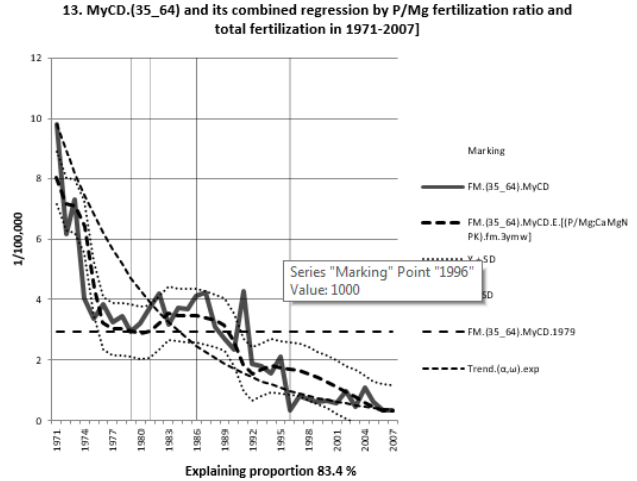
Figure 13:
Fig. 14. represents mortality from Myocardial Degeneration, aged 65-74, and its combined regression by P/Mg fertilization ratio and total fertilization. Regression explained MyCD.(65_74) variation by 90.0 %. This Fig. explains better than Fig. 12 period 1983-87.
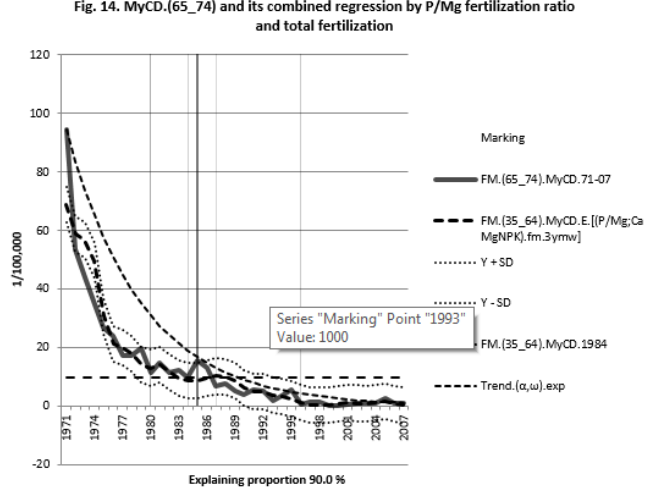
Figure 14:
Fig. 15. represents mortality from Myocardial Degeneration, aged 35-65, and its regession by sugar consumption in 1971-2007. Regession explained MyCD variation by 54.8 %. Compliance seems rather good, but during 1986-93 trends go to different directions.
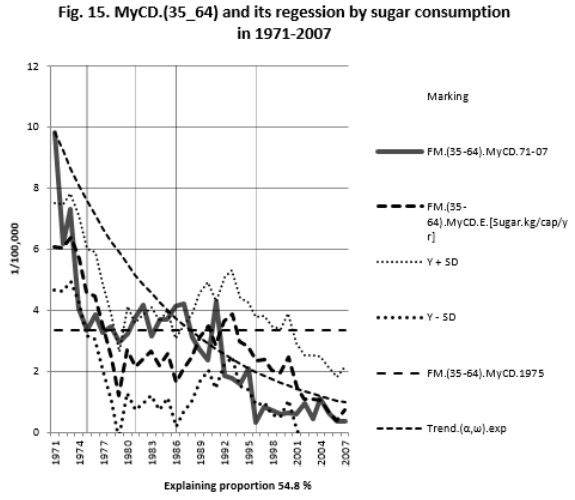
Figure 15:
Figure 16 represents mortality from Myocardial Degeneration, aged 35-65, and its regression by annual silage production (utilization) in 1971-2000. Regression explained MyCD variation by 67.9 %.
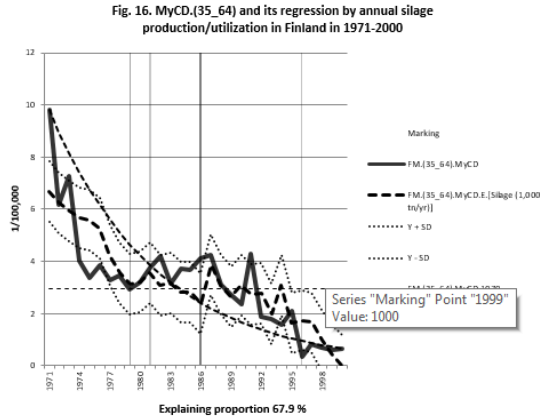
Figure 16:
Figure 17 Represents [Card.oth] and its regression by MyCD in 1971-2007. They explained variation in each other by 87.8 %.
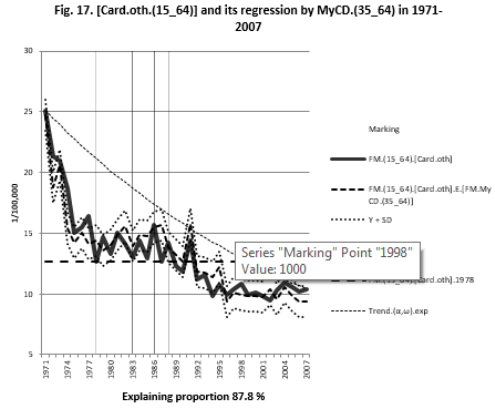
Figure 17:
Mean mortality from [Card.oth], aged 15-64, was 13.3, range 9.5- 25 (1/100,000), ie. on an average ca 5x higher than by MyCD. (35_64) – a subtype of [Card.oth]. Besides of reduction of MyCD, MyCD proportion inside of [Card.oth] was declining: from 27 % in 1971-87 to 20 % in 1988-95 and 6 % in 1996-2007. This and high compliance in Fig. 16 shows that other factors inside [Card.oth] comply the variation in MyCD.
Discussion
The aim of this study was to clarify associations of selected fertilization factors, sugar consumption and silage production with mortality groups, with special interest on MyCD.(35_64), MyCD. (65_74) and [Card.oth].(15_64). The effects of fertilization are not separated from food or feed factors, the changes are assessed as independent phenomena. The main observations are in the figures.
This study shows that the decline in the mortality from other subtypes of CVD was higher than from CHD during 1971-1990 (Fig. 5, 6, 7 and 8). Especially fast it was in [Card.oth] in 1971- 78, but even faster in MyCD. Effect of cardiac transplantations on MyCD mortality (on an average 16 per year, since 1985) [2] was not remarkable. Proportion of CHD.(WP) in CVD.(WP) begun to decrease (achieved the reduction speed of CVD) since 2000, but CHD.(15_64) in CVD.(15_64) as early as in1980 (Fig. 9 and 10).
{[P/Mg], [P/Mg;CaMgNPK], [P/Mg;Lim.ag], sugar consumption and silage utilization} explained variation in MyCD and [Card.oth] by 55-91 %, (p < 0.001). (Tabl. 2, Fig.’s 11-17). Regression by [P/ Mg;CaMgNPK] explained MyCD.(35_64) by 83.4 % (Fig. 13) and MyCD.(65_74) by (90 % (Fig. 14). This difference between R squares can obviously be explained by different number of cases in the groups (Tabl. 1). Fig. 13 shows better than Fig.14. the augmentative role of CaMgNPK (to P/Mg) in MyCD regression. The longer stagnation since 1982-84 in Non-CVD [5] than in Non-CHD [3], in working age, can be explained by rather co-incidental stagnation in [Card.oth], CbrVasc and [Vasc.oth], which are included in NonCHD, but not included in Non-CVD (Fig. 6 and 8). These changes were obviously more dynamic and could have responded faster to the environmental changes than CHD or the main Non-CVD group. Data of Non-CHD in Fig. 8 are from slightly different age group than in [3].
Different changes in mortality of CVD subtypes are not satisfactorily explained. Maybe they are possible to be explained by changes in availability of the mineral elements and principles represented in [3,4,5] including dualistic action of reninangiotensin-adrenergic system [3]. Importance of harms of excess phosphorus has been supported by Varo and Koivistoinen [7] and Nuoranne [14]: “The amount of phosphorus may be slightly excessive in the average Finnish (human) diet” (in the 1970’s), when it was 4.5 (2/0.44) (g) [7]. On the other side pig diet, in which P/Mg ratio was 5.3 (5.3/1.0) and which contained Mg more than twice that recommended by international norms, has been reported to produce Mg-deficiency symptoms, which could be prohibited by Mg supplementation [14]. Since 1971 P/Mg ratio has been strongly reduced in fertilization (Fig. 2), suggesting on P/Mg reduction in food, even more than calculated with aid of food composition tables from earlier decades [15].
Stagnation in the reduction of the fatal respiratory and digestive diseases in the 1980’s [5,10] suggests on deficiency in ”resistance against biotic and a biotic stresses”, a known silicon (Si) effect in plants [16]. Some protective abilities of Si in humans and animals have been observed [17] and suggested [18]. Si content of Finnish wheat in the 1970’s was < 0.1 g/kg [19], but in Australia 10 x higher (0.5-5 g/kg) [20]. The difference can be explained by climatologic and soil factors, but possibly by different amounts of fertilizers, too. Anyhow amount of sugar consumption (as well as medical treatments) have caused changes in human mineral element homeostasis, sometimes higher than by soil fertilization and can so explain the association with mortality (Fig. 15).
Silage effects on milk and milk fat quality: The lipid fraction in leaves of herbs and grasses ranges from 30 – 100 g kg-1 [21]. During hay harvesting hay fat is soft, iodine number ca 100, but the soft fats turn soon in dry hay into resin and lose their butter fat softening effects. Iodine number in milk fat can vary from 25 to 50, but target is 32 -37 [25]. Nobelist AI Virtanen (AIV) developed his rapid silage preservation method (“AIV method”) in the 1920’s, but first at the end of the 1960’s new machinery (e.g. field chopper) increased silage utilization. Abundant feeding of AIV silage was found to increase iodine number, as well as carotene, vitamin A and E content in milk and butter, which resembled nearly summer butter [23]. These changes in fodder quality obviously changed respectively the quality of dairy products and could explain a part of the MyCD and [Card.oth] mortality reduction. Obviously Se status of humans had been increasing before the mid 1970’s, because at that time Se content of pork was about 4-fold to other meat products and egg yolk 100-fold to milk [19].
Surprisingly rapid decline in MyCD during 1969 -74 could possibly have been affected by changes in diagnostic methods and social insurance, too (legislation on social security occurred mainly in the last half of the 1960’s and the beginning of the 1970’s) [24].
Conclusion
Fertilization parameters, sugar consumption and silage production explained changes in MyCD and [Card.oth].(15_64) by 55-91 % (p< 0.001). Reduction in [Card.oth], CbrVasc and [Vasc. oth] was faster than in CHD before 1991. Epidemic of Non-CVD associated with maximal total/carbonate fertilization.
Acknowledgement
I am grateful to Professor Osmo Hänninen and late veterinary surgeon Seppo Haaranen for several discussions.
References
- PubMed (2019) “Myocardial degeneration Finland”
- Harjula A. Heart transplants. http://www.hus.fi/sairaanhoito/ sairaanhoitopalvelut/elinsiirrot/Sydansiirrot/Sivut/default.aspx.
- Toysa T (2018) Associations of K/Mg fertilization ratio with non-CHD mortality in Finland during 1952-99. Biomed J Sci &Tech Res 5(3): 1-6.
- Töysä T (2018) Replacing Potassium by Phosphorus in Finnish CHD and Non-CHD Mortality Regressions by Fertilization Rates in 1961-2000 increased the Strength of Associations. Biomed J Sci &Tech Res 8(4):1:4.
- Töysä T (2019) CVD and Non-CVD mortality during 1971-2012 in Finland, associations with fertilization. Biomed J Sci &Tech Res 17(1): 1-10.
- Timo T, Osmo H, Seppo H (2018) Human CHD and Pig Cardiac Mortality in Finland during 1954-86. Biomed J Sci &Tech Res 2(4): 1-8.
- Varo P, Koivistoinen P (1980) Chapter XII. General Discussion and Nutritional Evaluation: 165-71. in Koivistoinen P (Editor). Mineral Element Composition of Finnish Foods: N, K, Ca, Mg, P, S, Fe, Cu, Mn, Zn, Mo, Co, Ni, Cr, F, Se, Si, Rb, Al, B, Br, Hg, As, Cd, Pb and Ash. Acta Agriculturae Scandinavica Supplementum 22. Stockholm 1980.
- Varo P, Alfthan G, Ekholm P, Aro A, Koivistoinen P (1988) Selenium intake and serum selenium in Finland: effects of soil fertilization with selenium. Am J Clin Nutr 48(2):324-329.
- Statistics Finland (2014) Myodegeneratio cordis (428 (ICD8), 4291A, I51.5 (ICD10)) in Finland 1969-2007.
- Statistics Finland. ‘http://pxnet2.stat.fi/PXWeb/pxweb/fi/StatFin/’ > English > Health > Causes of Death > 11br – Deaths/age-standardised death rates.
- Statistics Finland. Crops. Silage. Statistical Yearbook of Finland 1988 & 2001.
- FAOSTAT. Sugar consumption 1961-2013: a. ‘http://www.fao.org/faostat/en/#data/FBS’ > b. Finland > Food supply > Sugar (Raw Equivalent).
- Statistics Finland. http://pxnet2.stat.fi/PXWeb/pxweb/en/StatFin/ StatFin__vrm) > Population > population structure > 11s1.
- Nuoranne PJ, Raunio P, Saukko P, Karppanen H (1980) Metabolic effects of a low-magnesium diet in pigs. Br J Nutr. 1980 Jul;44(1):53-60
- Koivistoinen P, Ahlström A, Nissinen H, Pekkarinen M, Roine P (1970) Mineral Element Compositions of Finnish Diets Part I: Fe, Cu, Mn, Zn, Mg, Na, K, Ca and P. Suomen Kemistilehti B43: pp. 426-430, 1970.
- Epstein E (1999) Annual Review of Plant Physiology and Plant Molecular Biology. Vol. 50: 641-664.
- Maehira F, Motomura K, Ishimine N, Miyagi I, Eguchi Y, Teruya S (2011) Soluble silica and coral sand suppress high blood pressure and improve the related aortic gene expressions in spontaneously hypertensive rats. Nutr Res 31(2):147-156.
- Töysä T (2018) Regional associations of CHD and musculoskeletal morbidity with environmental and geographic factors – e.g. Ca, Mg, Si, Sn. Biomed J Sci & Tech Res 4(2) :1-8.
- Koivistoinen P (Editor) (1980) Mineral Element Composition of Finnish Foods: N, K, Ca, Mg, P, S, Fe, Cu, Mn, Zn, Mo, Co, Ni, Cr, F, Se, Si, Rb, Al, B, Br, Hg, As, Cd, Pb and Ash. Acta Agriculturae Scandinavica Supplementum 22. pp 28-29.
- Schultz JE, French RJ (1976) Silicon uptake by wheat and its relation to grain yield and water use. Australian Journal of Experimental Agriculture and Animal Husbandry 16(78) 123 – 128.
- Bauchart, D, Vérité R, Rémond B (1984) Long-chain fatty acid digestion in lactating cows fed fresh grass from spring to autumn. Canadian Journal of Animal Science (Suppl.), 330-331.
- Saarinen P (1956) On effects of Feeding on milk fat solidity and iodine number. Karjatalous 10: 237-238.
- Kreula M (1970). On effects of silage on quality of milk and milk products. Karjatalous 3:134.
- Hietaniemi M, Vidlund M (2003) Finnish Pension scheme.
