 Research Article


Abstract
The characteristics of inflammatory bowel diseases (IBD) are often ambiguous. The information obtained may deepen the cur-rent state of knowledge about ulcerative colitis and Crohn’s disease. For this reason, finding the optimal classifier to support further analysis of medical data is a factor determining the correct allocation of a patient to a given disease entity. The data were subjected to selection methods to find symptoms differing in the two analyzed groups. Then, the extracted variables were introduced into the classifier in order to build the classification model. Factors that were significantly different between patients with Crohn’s disease and ulcerative colitis were found. The built-in system with very high efficiency is able to predict to which group of diseases belongs new, undiagnosed patient (sensitivity 100%, specificity 98.48%). The constructed model can be an excellent method of assisting physicians in making decisions. Importantly, the system should be checked in a variety of balanced research groups to confirm its effectiveness.
Keywords: Crohn’s Disease; Ulcerative Colitis; Classification
Introduction
Crohn’s disease (CD) and ulcerative colitis (UC) have been known to physicians for decades. Unfortunately, so far there are many unknowns regarding CD and UC. There are numerous descriptions of clinical cases, different locations of disease symptoms, and descriptions of symptoms located both in the gastrointestinal tract and symptoms accompanying the disease. All this information sheds light on the etiology of inflammatory bowel disease (IBD) do not completely resolve their complexity. An analysis of the literature presented in the work indicates that the characteristics of diseases are often unambiguous. This contributes to the fact that IBD diagnostics are often difficult and create many problems [1-3]. Despite many years of research on inflammatory bowel diseases, they are still of interest to scientists today. Nonspecific inflammatory bowel disease is a term referring to chronic and recurrent gastrointestinal disease. A number of clinical symptoms distinguish between CD and UC, whose clinical picture is relatively diverse. However, in many cases the diagnosis is not straightforward, which contributes to the interest of researchers worldwide in the disorders under discussion. The inflammatory changes in the course of UC are continuous and limited to the mucous membrane of the large intestine. UC-related inflammation usually involves the mucosa and submucosa usually begins in the rectum and spread proximal to the colon. The affected tissue is swollen, with the presence of erosions and ulcers, which lead to spontaneous bleeding.
In most cases, UC initially occurs smoothly, with worsening symptoms within a few weeks. It happens, however, that the disease begins suddenly and goes very quickly. In such cases, due to the lack of the effect of conservative treatment, surgical treatment is already implemented in the early stages of the disease. However, in most cases, after the first shot of the disease, it goes into remission, after which it becomes more severe again. Such continuous conditions of illness and remission may last even several dozen years [1,2]. In the case of CD, the condition most often includes the small intestine and caecum, which accounts for 40% of cases, only small intestine (30% of patients) and only large intestine (25% of cases). In situations where only the large intestine is covered, two forms of the disease are recognized. The first one concerns about two thirds of cases and consists in taking the entire length of the large intestine with the disease state, while the second involves the occurrence of staple changes, which is one third of the diagnoses. Isolated inflammation of the anus or upper gastrointestinal tract is the least common form and occurs only in less than 4% of patients [3,4].
The most common clinical symptoms for CD are diarrhea, abdominal pain and weight loss. Bleeds are less frequent than in UC, while perirectal lesions and intestinal obstruction are more frequently observed. Of all environmental factors, smoking has an undoubted relationship to inflammatory bowel diseases. Interestingly, former or current smokers are at an increased risk of CD development. Scientists suggest, however, that one of the components of cigarettes - nicotine - is responsible for it. Studies using other substances that were intended to replace nicotine were ambiguous [5-8]. On the other hand, smokers who are ill with UC are less frequently hospitalized, less frequently, episodes of exacerbation of the disease, compared with patients with UC who have never smoked. Currently, animal studies are being carried out indicating mechanisms that may be responsible for the protective effect of smoking in UC [9]. The characteristics of diseases are often unambiguous. Therefore, it is important to look for new symptoms that differentiate the disorder and relationships between them. The acquired information will deepen the current state of knowledge about UC as well as the CD. For this reason, finding the optimal classification model to support further analysis of medical data is a factor determining the correct allocation of a patient to a given disease entity.
The aim of the analysis was to find symptoms that differentiate the analysed diseases among popularly tested laboratory exponents. It is necessary to look for symptoms that differentiate the diseases in question. Undoubtedly, it will deepen current knowledge about UC as well as CD. Answers to many bothering doctors may bring methods of knowledge exploration from databases [10-15]. For this reason, the methods of data mining in combination with statistical methods in the analysis of medical data of patients covered by the disorder were used in the work.
Materials and Methods
The protocol of the study was approved by the Bioethics Committee of the Medical University of Bialystok, Poland (R-I002/209/2018).
Data
The study concerned the analysis of patient data with inflammatory bowel diseases. Data were collected using data about patients of the Department of Gastroenterology and Internal Diseases of the Medical University of Bialystok Clinical Hospital, with the consent of the Bioethical Commission of the Medical University of Bialystok. The patients were diagnosed on the basis of clinical symptoms, biochemical, radiological and endoscopic results (the result of histological examination of the specimen collected during the study). The data was collected based on the analysis of patient records. In the first group, ulcerative colitis was diagnosed (N = 86, women N = 32, men N = 54), and the second group were patients with Crohn’s disease (N = 66, women N = 32, men N = 34). The age in the study group is 38.05 ± 16.57 years, where women aged 35.97 ± 15.56 and men 39.57 ± 17.19. The mean age in the CD group was 34.42 ± 14.30 years (mean age of women 36.19 ± 16.90 years, men 32.76 ± 11.34 years). The mean age in the group of UC patients was 40.84 ± 17.70 years (mean women age 35.75 ± 14.37 years, men 43.85 ± 18.88 years).
Information on the following laboratory exponents was collected: WBC [x10^3 / uL], RBC [x10 ^6 / uL], Hg [g / dl], MCV (Mean Corpuscular Volume) [fL], PLT (Platates) [x10^3/uL], Neutrophils [x10 ^3 / uL], Lymphocytes [x10^3/uL], Monocytes [x10^3/uL], Eozynofiles [x10^3/uL], Basofiles [x10^3 /uL], Glucose [mg / dl], Bilirubin [mg / dl], AspAT () [lU / L], ALAT [lU / L], Amylase [lU / L], PT [sec], INR, Fibrinogen [mg / dL], Urea [mg / dL], Creatinine [mg / dL], Sodium [mmol / L], Potassium [mmol / L], CRP [mg / dL]. And above all such information as: age, gender, smoking, occurrence of blood in the stool, palpable tumor within the abdominal cavity.
Machine Learning and Statistical Methods
The work combines statistical methods and selected data mining algorithms. The research part consists of two main stages of work: the first concerning the issue of classification and searching for the best classifier, and the second one consisting in mining the classification rules and then the rules of the action. The initial stage of research concerned the analysis with the use of significance tests. Before proceeding with the analysis, the value of extreme outliers was tested. In addition, data gaps that are characteristic of incomplete information systems have been filled out. The data gaps were filled by applying the average or median filling method.
The analyzes were carried out using the Statistica13.1 (StatSoft, Cracow in Poland) and Weka Software (University of Waikato, New Zealand).
Feature Selection: The selection of features was performed using statistical methods. The Mann-Whitney test was used for comparison of the CD group with the UC group in the case of quantitative data, if the parameters were not shown to be in normal distribution, Student’s t-test, if the compatibility with normal distribution and homogeneity of variance and CochranCox test were shown, if compliance with the normal distribution has been shown, but there is no homogeneity of variance. In the case of a comparison of data on the qualitative scale, a chi-square test was used. The Shapiro-Wilk test was used to check compliance with the nor-mal distribution, and the Leven test was used to test homogeneity of variance. The significance level was assumed α = 0.05 [16]. Selected features were used because the construction of classifiers using three algorithms of knowledge extraction
Cross-Validation Test: For the machine learning algorithms, the cross-validation method was used. It consists in the division of the studied statistical sample into subsets: the training and test set. The analyzes are carried out on the training set, while the test set is used to confirm the reliability of the obtained results [17].
4.2.3.Classification Model: In order to build a classification model that could assist the doctor in making the diagnosis, the Random Forest method was used. Random Forest (RF) is recognized as the most modern algorithm for building a decision forest, which is technically a combination of Bagging and Random Subspace algorithms. In the simplest form of RF, the attributes in the subspace f are randomly selected at the node level. Since its inception, the RF algorithm has been very popular with the scientific community and that’s why many of its variants have been proposed in recent years [18-22]. In order to test the accuracy of the constructed classifier, a matrix of errors (Table 1) was used to calculate the measures describing the correctness of the classification. [23,24] The board has two rows and two columns. Rows represent predicted classes, while columns represent real classes. We use some statistics, which are explained briefly as follows [24]:
Sensitivity – rate of the instances correctly classified as a given class:
Specificity – the ability to detect people who are actually healthy (without a given trait):
F-Measure - indicator of quality of the model, the harmonic mean of precision and sensitivity:
In order to analyze the quality of the classification, a new measure of the Action Quality Measure 150 (AQM) was proposed, taking into account all the results from the binary matrix of mistakes (both true 151 and false positive and negative). The measure evaluates the overall quality of model prediction:
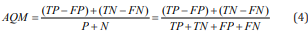
The proposed measure returns values from - 1 to + 1, with the factor +1 corresponding to an ideal 154 classification, a value oscillating within 0 means a random assignment of the result, and - 1 means a 155 total discrepancy between the forecast and the observation.
Results
Feature Selection
Following the methodology presented in Chapter 2, materiality tests were carried out. The results illustrating variables whose values differ significantly between the group of patients with UC and CD are presented in Figure 1 and Tables 1 & 2.
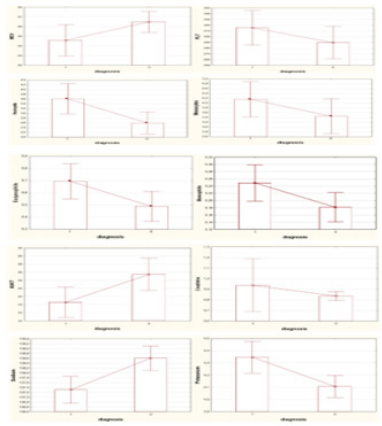
Figure 1: Means and standard deviation for variables significantly different in CD group (code 1) and UC group (code 0).
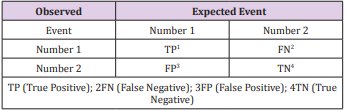
Table 1: Confusion matrix.
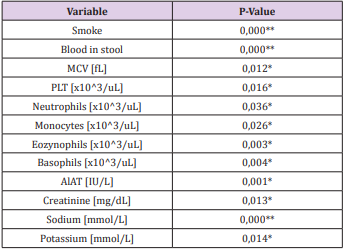
Table 2: Significant variables with the p-value.
*significant at the level of α = 0.05 ** significant at the level of α = 0.001. MCV – mean corpuscular volume, PLT – thrombocytes, AlAT – alanine aminotransferase.
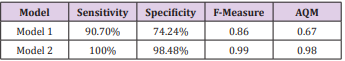
Table 3: The adjustment measures.
Classification Model
Two classification models were built. The first one (Model 1) containing all available data (test results and data from patient interviews). The second model (Model 2) contained only variables 179 that in the selection process of features turned out to be significantly different in the two analyzed groups. For the classifier built using all available variables, the sensitivity was 90.70%. The specificity 184 for model 1 was 74.24%. For the model 2, the sensitivity value was 100%, which indicates an ideal 185 ability to detect people with CD. The specificity value, specifying the ability to detect people with UC, fluctuates within 98.48%. The harmonic mean of precision and sensitivity, ie the measure F1187 score, reached the following levels: 0.86 (model 1), 0.99 (model 2). In addition, the value of the AQM 188 measure was calculated, which assumed the following values: 0.67 (model 1), 0.98 (model 2).
Classification Rules
Using data, a decision table was built. All attribute values have been transformed so that knowledge mining methods can be applied to them. Then, using the decision table, the strongest 192 classification rules were found for a limited set of data after selection Table 3. The first stage concerned the discretization of given quantitative attributes. Then, the classification rules from the decision table were extracted. Below, the selected generated classification rules (code of the 195-classification attribute 0 - UC, code 1 - CD) were printed out. In the prime of categorical variables: smoking and blood in stool code 0 means no occurrence of the phenomenon, code 1 says that the phenomenon occurs. In the case of quantitative variables, the values given are assumed by 198 individual laboratory exponents. For each rule there are coefficients - the first is the number of 199 instances covered by the rule, the second the number of incorrectly classified instances (coefficient 200 1. coefficient 2):
1) Smoking = 1 AND potassium> 3.9: 1 (42.0)
2) ALT> 24: 0 (32.0)
3) Blood in feces = 1 AND potassium ≤ 5.2 AND ALAT> 7: 0 (30.0)
4) Monocytes ≤1.51 AND PLT> 185: 0 (12.0)
5) Smoking = 0 AND sodium ≤ 140 AND ALAT> 19: 1 (12.0)
6) Smoking = 0 AND sodium> 138: 0 (18.0)
7) PLT> 195: 1 (12.0)
8) Smoking = 0: 0 (56.0)
9) Creatinine <0.69 AND blood in stool = 0 AND smoking = 0 AND PLT <524,5: 0 (12.0)
10) Creatinine <0.69 AND blood in stool = 0 AND smoking = 0 AND PLT ≥524,5: 1 (12.0)
11) Creatinine <0.69 AND blood in stool = 1 AND smoking = 0: 0 (18.0)
12) Creatinine <0.69 AND blood in stool = 1 AND smoking = 1: 1 (12.0)
13) Creatinine ≥0.69 AND smoking = 0 AND potassium ≥4.12 AND MCV <85.73 AND PLT> = 273 AND neutrophils <16.22: 0 (26.0)
14) Creatinine ≥0.69 AND smoking = 0 AND potassium ≥4,12 AND MCV <85,73 AND PLT≥273 AND neutrophils> = 16.22: 1 (12.0)
15) Creatinine ≥0.69 AND smoking = 0 AND potassium ≥4,12 AND MCV <85,73 AND PLT
16) <273: 0 (16.0)
17) Creatinine ≥0.69 AND smoking = 0 AND potassium ≥4.12 AND MCV <89.85: 0 (18.0)
18) Creatinine ≥0,69 AND smoking = 0 AND potassium ≥4,12 AND MCV ≥89.85 AND
19) Creatinine <0,81: 0 (16.0)
20) Creatinine ≥0.69 AND smoking = 0 AND potassium ≥4,12 AND MCV≥89.85 AND Creatinine <0.81 AND MCV <95.5: 1 (14.0)
21) Creatinine ≥0.69 AND smoking = 0 AND potassium ≥4.12 AND MCV≥89.85 AND Creatinine <0.81 AND MCV≥95.5: 0 (2.0)
22) Creatinine ≥ 0.69 AND smoking = 1 AND sodium <137: 1 (12.0)
23) Creatinine ≥ 0.69 AND smoking = 1 AND sodium
24) ≥137 AND eosinophils <0.33: 0 (16.0)
25) Creatinine ≥0.69 AND smoking = 1 AND sodium ≥137 AND eosinophils ≥0.33 AND creatinine ≥ 0.76: 0 (12.0)
26) Creatinine ≥0.69 AND smoking = 1 AND sodium ≥137 AND eosinophils ≥0.33 AND creatinine ≥ 0.76 AND sodium ≥ 138.52: 1 (10.0)
27) Creatinine ≥0.69 AND smoking = 1 AND sodium ≥137 AND eosinophils ≥0.33 AND creatinine ≥ 0.76 AND sodium <138,52 AND MCV <83.68: 1 (12.0)
28) Creatinine ≥0.69 AND smoking = 1 AND sodium ≥137 AND eosinophils ≥0.33 AND creatinine ≥ 0.76 AND sodium <138,52 AND MCV≥83.68: 0 (14.0)
29) 2creatinine <0.69 AND blood in stool = 0 AND smoking = 0 AND PLT <524,5: 0 (12.0)
30) Creatinine <0.69 AND blood in stool = 0 AND smoking = 0 AND PLT≥524,5: 1 (12.0)
31) Creatinine <0.69 AND blood in stool = 0 AND smoking = 1: 1 (20.0)
32) Creatinine <0.69 AND blood in stool = 1 AND smoking = 1: 1 (21.0)
33) Creatinine <0.69 AND blood in stool = 1 AND smoking = 0: 0 (12.0)
Discussion
Crohn’s disease and ulcerative colitis are known to physicians for decades. Unfortunately, so far there are many unknowns regarding CD and UC. The characteristics of diseases are often unambiguous. This contributes to the fact that the diagnosis of inflammatory bowel diseases is often difficult and creates many problems [1-4]. Therefore, it is necessary to look for symptoms that differentiate the disorders in question. Undoubtedly, it will deepen the current knowledge about UC and CD. Answers to many bothering doctors may bring methods of knowledge exploration from databases. For this reason, the methods of data mining in combination with statistical methods in the analysis of medical data of patients covered by the disorder were used in the work.
Significance analysis indicated that people who were diagnosed with UC did not smoke in most cases (N = 76). The number of smokers (N = 48) in relation to nonsmokers (N = 18) was significantly higher among patients with CD. The chi-square test showed a significant difference between the analyzed groups (p <0.05). Indeed, more non-smokers fell ill with UC. In the case of smoking, the odds ratio has reached 0.01, which means that there is a chance of developing CD in the case when the patient is significantly larger. The obtained results confirm current scientific reports. Studies show that smoking has a definite relationship with inflammatory bowel diseases. Smokers who are currently or those who have been smokers are at increased risk for developing CD, while smoking appears to have a protective effect in UC. Researchers suggest that nicotine may be responsible for this [6,8,9] Scientific reports also confirm that smoking patients with UC are less likely to be hospitalized and less likely to have episodes of exacerbation of the disease compared to UC patients who have never smoked [25]. The cause of this phenomenon has not yet been clarified. Currently, animal studies are carried out indicating mechanisms that may be responsible for the protective effect of smoking in UC due to the content of nicotine [9].
The chi-square test showed at the significance level of 0.05, that this feature significantly differs between patients with UC and CD (p = 0.00003). Blood in the stool was significantly more frequently reported in patients with UC. The OR for blood in feces was 14.45, indicating that this symptom is fourteen times more likely in the UC group [26]. Among the biochemical factors from blood tests with different parameters, the level of MCV (p = 0.012), PLT (p = 0.016), neutrophils (p = 0.036), monocytes (p = 0.026), eosinophils (p = 0.003), basophils (p = 0.004), ALAT (p = 0.001), creatinine (p = 0.013), sodium (p = 0.000) potassium (p = 0.014), where all differences were significant at a level of at least α = 0.05. According to the developed research methodology, only variables that were significantly different were included in a further stage of the analysis concerning the construction of classifiers in two groups. Other models were constructive, including a logistic regression model. The analysis carried out in this work, as well as in another work, confirm the validity of the results obtained [27]. Patients in the two analyzed groups significantly differentiate the level of PLT. If creatinine is maintained at the level mentioned in the rule, blood in the stool will not occur and the patient will not be a smoker, then PLT level greater than or equal to 524.5 x10^3 / uL will be characteristic for CD, while lower than mentioned level will indicate UC.
If the patient’s creatinine level is maintained below 0.69 mg / dL, the stool will not contain blood, the person will be a smoker, the patient will be diagnosed as having a CD. This indicates that while maintaining this level of creatinine and with the occurrence of blood in the stool, smoking will indicate on the CD, otherwise the patient will belong to the UC group. The parameter differentiating the discussed disease is the level of neutrophils in the blood. If the patient has the level of creatinine, potassium, MCV and PLT mentioned in the rule, he will not be a smoker at the same time, the neutrophil value below 16.22x10^3 / uL will be characteristic for CD, while the value will be greater than or equal to 16.22x10^3 / uL for UC. For both conditions, the level of MCV may exceed 89.95 fL, however, values above 95.5 fL indicate UC, while the level between 89.85 fL and 95.5 fL is characteristic for CD, while maintaining the levels of other parameters, such as like creatinine, potassium and smoking. The patient’s creatinine level will be maintained at a level higher than or equal to 0.76 mg / dL, the patient will be a smoker, sodium will be maintained at a level from at least 137 mmol / L to 138.52 mmol / L, the eosinophilia value will be higher or equal to 0.33x10^3 / uL, while the level of MCV will be greater than or equal to 83.68 μL less than the mentioned value, then the patient will be assigned to the CD group. Patients, while maintaining the appropriate values of parameters and traits (the level of creatinine in the patient will be maintained below 0.69x10^3 / uL, blood will not be found in the stool, the person will be non-smoker), when the PLT value exceeds 525.5x10^ 3 / uL suffer from UC, otherwise they are classified in the CD group.
While maintaining the appropriate level of creatinine (less than 0.69x10^3 / uL) and when there is blood in the stool, smoking will cause the person to be classified as suffering from CD, otherwise, it will be UC. All the above conclusions were drawn based on a classifier built on the basis of the developed methodology. The builtin model indicates that it can be successfully used to support the diagnosis. It may indicate symptoms differing in the two analyzed groups (UC and CD). Obtained model contains only parameters significantly different in the two analyzed groups. The quality of the built-in classifier is very high. Calculated metrics indicate very good classification. In the case of model using only variables significantly different Table 2, the calculated measures take very high values. The level of sensitivity fluctuates at 100% and specificity has reached 98.48%. This indicates that the model is perfectly able to recognize patients on both CD and UC. The constructed model was taught in 90% of available cases of patients, while tested in 10% of available cases (cross-validation method). Other calculated measures also indicate correct classification, including the proposed AQM measure (0.98). In order to compare the legitimacy of using the developed methodology, a model based on all available research results was built. This model shows inferior predictive capabilities (sensitivity of 90.7% and specificity 74.24%, AQM 0.67).
Conclusion
In conclusion, research shows that there are other factors differentiating the analyzed diseases. Laboratory tests alone may be a reason to make a diagnosis. The constructed classification system can undoubtedly help doctors in a situation of uncertainty. In addition, it should be noted that the tests must be repeated on other, balanced groups of patients in order to confirm the developed methodology. In further studies, it is necessary to apply and verify a model comparing the group of patients with healthy people, which will contribute to the deepening of knowledge about the analyzed diseases.
References
- Connelly TM, Koltun WA (2014) The cancer “fear” in IBD patients: is it still real? J Gastrointest Surg 18(1): 213-218.
- Frolkis AD, Dykeman J, Negron ME, Debruyn J, Jette N, et al. (2013) Risk of surgery for inflammatory bowel diseases has decreased over time: a systematic review and meta-analysis of population-based studies. Gastroenterology 145(5): 996-1006.
- Baumgart D, Sandborn W (2012) Crohn’s Disease. Lancet 380(9853): 1590-1605.
- Rutgeerts P, Goboes K, Peeters M, Hiele M, Penninckx F, et al. (1992) Effect of faecal stream diversion on recurrence of Crohn’s disease in the neoterminal ileum. Lancet 338(8780): 771-774.
- Abraham C, Cho J (2009) Inflammatory bowel disease. NEJM 361(21): 2066-2078.
- Mahid SS, Minor KS, Soto RE, Hornung CA, Galandiuk S, et al. (2006) Smoking and inflammatory bowel disease: a meta-analysis. Mayo Clin Proc 18(11): 1462-1471.
- Bernstein CN, Rawsthorne P, Cheang M, Blanchard JF (2006) A population-based case control study of potential risk factors for IBD. Am J Gastroenterol 101(5): 993-1002.
- Cottone M, Rosselli M, Orlando A, Olivia I, Puleo Cappelo M, et al. (1994) Smoking habits and recurrence in Crohn’s disease. Gastroenterology 106(3): 643-648.
- Daniluk J, Daniluk U, Reszec J, Rusak M, Dabrowska M, et al. (2017) Protective effect of cigarette smoke on the course of dextran sulfate sodium-induced colitis is accompanied by lymphocyte subpopulation changes in the blood and colon. Int J Colorectal Dis 32(11): 1551-1559.
- Dardzinska A, Kasperczuk A (2018) Decision-Making Process in Colon Disease and Crohn’s Disease Treatment. Acta Mech Autom 12(3): 227- 231.
- Dardzinska A (2013) Action Rules Mining. 1st ed. Berlin: SpringerVerlag.
- Kasperczuk A, Dardzinska A (2018) Comprehensive Review of Classification Algorithms for Medical Information System. LNCS 299- 309.
- Kasperczuk A, Dardzinska A (2016) Comparative evaluation of the different data mining techniques used for the medical database. Acta Mech Autom10(3): 233-238.
- Hastie T, Tibshirani R, Friedman J (2013) The Elements of Statistical Learning: Data Mining, Inference, and Prediction, Berlin Springer-Verlag 2013.
- Fawcett T (2006) An introduction to ROC analysis. Pattern Recognit Lett 27(8): 861-874.
- Stanisz A (2006) Przystepny kurs statystyki z zastosowaniem STATISTICA PL na przykładach medycyny. Statystyki podstawowe, 1st (edn.). Krakow StatSoft Poland.
- Sylvain A, Alain C (2010) A survey of cross-validation procedures for model selection, Stati Surv 4(2010): 40-79.
- Bernard S, Heutte L, Adam S (2012) Forest-RK: A new random forest induction method. LNCS 200: 5227: 430-437.
- Bernard S, Adam S, Heutte L (2012) Dynamic random forests. Pattern Recognit Lett 33(12): 1580-1586.
- Blaser R, Fryzlewicz P (2016) Random rotation ensembles. J Mach Learn Res 17(4): 1-26.
- Seyedhosseini M, Tasdizen T (2015) Disjunctive normal random forests. Pattern Recognit 48(3): 976-983.
- Sikonja M (2004) Improving random forests. Mach Learn 3201: 359- 370.
- Vapnik V (1995) The Nature of Statistical Learning Theory. 2nd ed. New York,Springer-Verlag.
- Powers DM (2011) Evaluation: from Precision, Recall and F-Measure to ROC, Informedness, Markedness & Correlation. J Mach Learn Tech 2(1): 37-63.
- Calkins BM (1989) A meta-analysis of the role of smoking in inflammatory bowel disease. Dig Dis Sci 34(12): 1841-1854.
- Wagner J, Sim WH, Lee KJ, Kirkwood CD, (2013) Current knowledge and systematic review of viruses associated with Crohn’s disease. Rev Med Virol 23(3): 145-171.
- Kasperczuk A, Daniluk J, Dardzinska A (2019) Smart Model to Distinguish Crohn’s Disease from Ulcerative Colitis Appl Sci 9: 1650.
