 Research Article
Abstract
A pot experiment was conducted to evaluate the effect of zinc (Zn) fertilizer rates: 0, 5, 10,and 15 mg Zn / kg soil on Zn and selenium (Se) concentrations in brown rice and polished rice of Z3055B and Z5097B, two Se rich genotypes and R725, Se low genotype to remote Zn and Se malnutrition for human health including the impact of Zn supply on Se concentration, enzymes activity, grain yield and nutrient loss. Enzymes activity and grain yield significantly increased at 5 mg Zn as compared to control. At 10 and 15 mg Zn, Zn concentration in brown rice significantly improved as compared to control but not significantly improved in polished rice. Zn supply enhanced Se concentration increase in brown rice and polished rice at 10 and 15 mg Zn as compared to control. Regarding nutrient content, Z5097B could maintain the highest Zn concentration in polished rice among three genotypes. Z3055B and Z5097B could accumulate higher Se concentration in brown rice and polished rice. Owing to polishing, Zn loss was higher than Se, and Z5097B showed the lowest Zn loss. The results showed that Zn supply provided Se increase in grain and Z5097B can be recommended to solve Zn and Se malnutrition.
Keywords: Zinc Biofortification; Grain Yield; Selenium; Polishing; Rice Genotypes
Introduction
Micronutrients, zinc (Zn) and selenium (Se) play an important role in human growth, development, and maintenance of the immune system. The Recommended Dietary Allowance (RDA) for Zn and Se nutrients are respectively 15 mg and 0.07 mg/day for both adults and children [1]. However, Zn dietary deficiency is considered as substantial global health and the nutritional problem which affects one – third of the world population [2,3]. Se deficiency adversely affects 15 % of the worldwide population, and Keshan and Kashin-Beck diseases in China are well -known diseases due to consumption of Se deficient food generally cultivated on Se deficient soils [4]. According to the nutritional observation, 24- 28 mg/kg Zn concentration in polished rice is essential for 30% of human estimated average requirement as rice is one of the most important global staple food crops with a very long history of cultivation and 62-190 kg/year, the per “capita” consumption of rice [2,5]. However, grain yield and Zn concentration are low because about 30% of the cultivable soils are low in Zn, especially in arid and semiarid regions due to be low organic matter, high pH and CaCO3 content in soils [6,7].
Moreover, brown rice is composed of bran (6-7 %), endosperm (90 %) and embryo (2–3 %) by weight. Although brown rice shows 20-25 Zn mg/kg, polished rice contains only 16-17 mg/kg of Zn as Zn in the outer layer of the grains was removed during dehusking and milling [8,9]. Further, consumers prefer polished rice which loses on an average 24 % of Zn during milling as compared 50.3 Zn mg/kg in aleurone and embryo to 8.6 Zn mg/kg in polished rice [10]. These may result in Zn malnutrition of people who depend on a rice-based diet. The differential depositions of mineral in bran, embryo, and endosperm of developing grains were important in generating genetic variation in grain Zn concentration of the cereals [11]. Therefore, it would be more appropriate to study the genotypic variation of Zn concentration in polished rice as rice is consumed primarily in the polished state. In addition, Zn plays a vital role in several physiological processes of plant growth and metabolism including enzyme activation, CO2 fixation and maintenance of biological membranes, protein synthesis, metabolism of carbohydrates, lipids, auxins, nucleic acids, gene expression, regulation and pollen formation [12-14]. Zn deficiency of nearly half of the cereal growing areas of the world can also adversely affect the quality of harvested products, the susceptibility of plants against high light, high temperature and fungal infection [15].
Therefore, SOD enzyme, a cupro-zinc protein becomes highly important to maintain Zn homeostasis in plant cells to protect them from various kinds of stress because SOD scavenges superoxide radicals and catalases (CAT) transform H2O2 to H2O to counteract ROS in the plant [16]. Although Zn application can increase seed yield and improve the resistance of plants to environmental stresses (Zn deficient soil, water stress, etc.) in previous reports, we need to observe the response of SOD and CAT enzymes activity under sufficient Zn application of different genotypes. Regarding Zn fortification, Zn concentration in grain may be increased by applying Zn fertilizer to the soil or directly to the plants for the short term [17]. It was found that Zn foliar application increased the number of wheat grains per spike and increased the seed yield and oil percentage in corn and Zn concentration in whole grain was significantly pronounced by spraying Zn at the milk and dough stage [18,19]. Zn soil application increased 29 and 95% of grain yield and wholegrain Zn concentration with 74% of whole-grain Zn bioavailability [20]. On the other hand, Zn application has a relationship with another nutrient uptake and concentration in grain [19].
Se had an antagonistic effect on Zn absorption by Zn-depleted rats, and Zn had an antagonistic effect on Se absorption by Znadequate rats [21]. SeO4−2 caused a slight increase of Zn in half of the wheat lines and suppressed by SeO3 −2 in the majority of the lines [22] [23] reported that Se metabolism competes with sulfate assimilation and Se compounds are formed as a result of the sulfate assimilatory pathway and sulfur amino acid-derived metabolism. The current study was, therefore investigated to evaluate the impact of Zn soil application on zinc and selenium concentrations in brown rice and especially polished rice of two Se rich rice genotypes(selenium concentration ≥0.04 mg/kg according to the national standard of China) and one low Se rice genotype released from the rice breeding program to overcome Se deficiency for human health, including the effect of sufficient Zn fertilization on the enzymes activity and grain yield in order to provide the information for the selection of rice genotypes with substantial capacity to acquire minerals for crop biofortification with these micronutrients in polished rice. Furthermore, among three selected genotypes, the different percent loss of nutrients due to polishing processes was assessed for sustainable enriched zinc and selenium in polished rice.
Materials and Methods
Plant Material and Field Experimentation
The current study was conducted at the experimental field of Hybrid Rice Department, Rice Research Institute, Sichuan Agricultural University in China with pot culture method during summer season (2018). The experimental soil had sandy loam texture, 5.8 pH, 38.4 g organic carbon, 141 mg extractable nitrogen, 28.1 mg phosphorus, 113 mg potassium, 2.75 mg zinc, 0.24 mg selenium, 2.75 mg Sulphur and 0.13 mg cadmium / kg of soil. Three rice genotypes used for the current experiment were Z5097B (Se rich rice genotype) and Z3055 B (Se rich rice genotype), and R725 (Se low rice genotype). In the field, 10 kg of soil was filled into plastic pots (diameter 30cm, height 27.3cm) after leaving 8cm from the top for standing water. At one week before transplanting, zinc sulphate (ZnSO47H2O) by making a solution with 500 mL of water was added into each pot. The experiment contained four Zn treatments viz 0,5,10,15mg Zn/kg of soil arranged in randomized completely block design with three replications. The nitrogen, phosphorus and potassium fertilizers were given to each pot as the recommended fertilizers dose on a soil weight basis. Four hills of 24-day seedlings of each genotype were transplanted into each pot from seedbed. Watering was done once in two days.
Determination of Total Chlorophyll and Carotenoids
Total chlorophyll and carotenoids in four flag leaves per pot were determined at the flowering time using the protocol reported by Krishnan [24]. At first, fresh leaf sample (0.1g) was chopped into small pieces and then was added into each test tube with 25 mL of 80% acetone and thereafter placed in the dark for 12 h for allowing chlorophyll extraction from the samples. The clear supernatant was taken, and the absorbance was recorded at the wavelength 663, 646 and 470 nm using 80% acetone as a blank with a spectrophotometer (DU-730; America Beck Man Coulter).
Superoxide Dismutase (SOD) Activity (EC 1.15.1.1)
The samples (0.1g) from four flag leaves at the flowering time were ground and homogenized with 1mL extraction buffer solution on the ice according to the SOD kit instruction (100/96) purchased from COMIN, Suzhou Comin Biotechnology Co. Ltd, of China (www. cominbio.com). The homogenate was centrifuged at 8000 g at 4°C for 10 minutes to produce the supernatant. The reaction mixture in each tube contained 45 μl of reagent 1, 100μl of reagent 2, 2μl of reagent 3, 18 mL of enzyme extract and 35mL of reagent 4 in order. One blank tube was carried out with water without a sample in the same way. After 30 min, SOD activity was assayed at 560 nm with UV visible spectrophotometer (Thermo Scientific, BIOMATE 3S).
Catalase Activity (EC 1.11.1.6)
The samples (0.1 g) from four flag leaves at the flowering time were ground and homogenized with 1mL extraction of buffer solution on the ice according to CAT kit instruction (100/96) purchased from COMIN, Suzhou Comin Biotechnology Co. Ltd, of China (www.cominbio.com). The homogenate was centrifuged at 8000 g at 4°C for 10 min to produce the supernatant. And then, 10 μl sample and 190 μl working solution were added and mixed into the microcuvette. After 30 min, CAT activity was assayed by recording the initial absorbance value (A1) at 240 nm and the second absorbance value (A2) after 1 min with UV visible spectrophotometer (Thermo Scientific, BIOMATE 3S).
Grain Yield and Total Dry Matter
To determine the grain yield and total dry matter (total weight of dry plant above the soil in the pot), rice plants from each pot were harvested at maturity. After drying, threshing and winnowing, the weight of grain and total dry matter including culms, tiller, leaves, and panicles (g/pot) were recorded from each pot.
Preparation of Rice Powder
After drying and winnowing grains, husks were removed using a laboratory-scale dehulling machine (JLG-II, Da Ji Co., Ltd, Hangzhou, P. R. China). Some of the brown rice samples were subjected to preliminary processing with a miller (JNM-III, CHINA GRAIN RESERVES CORPORATION) to obtain polished rice for 200 s. The resulted polished rice and brown rice were ground using a machine (F160, Zhong Xing Co., Ltd, Beijing, PR. China) to make powder and then these powders were passed through a 100-grade sieve to obtain the flour.
Determination of Zinc Concentration
According to the China Government’s National food safety standard of Zn determination in foods (GB5009.14-2017), 0.1 g of subsamples with 10 ml of nitric acid and perchloric acid mixture (10:1) were added into 25 mL Kjeldahl flasks with funnels and then placed in a water bath at 30°C for 40 min. After predigesting at room temperature for one night, flasks were heated on an electric hot plate at 160°C for 4 h. When the digestive solution changed to colorless, the temperature was raised to 180 °C for 4 h. When the solution became colorless and clear, the remainders 1-2 ml were diluted to 10 ml with ultrapure water after cooling. Blank digestion was also carried out in the same way. Zinc concentrations of samples were determined after preparing a Zn standard solution curve with atomic absorption spectrometer (AAS).
Determination of Selenium Concentration
Selenium concentration was determined by the China Government’s National food safety standard determination of Se in foods (GB 5009.932010) with a little modification. At first, 0.1 g of subsamples with 10 ml of nitric acid and perchloric acid mixture (10:1) was added into 25 ml Kjeldahl flasks with funnels and then placed in a water bath at 30 °C for 40 min. After predigesting at room temperature for one night, the flasks were heated on an electric hot plate at 120°C. When the color of flasks changed from red brown to yellow, the temperature was raised to 140°C. And then when the color changed to white, the temperature was raised to 160°C. When the samples were completely mineralized, 5 ml of HCl and H2O mixture (10:1) was added after cooling and then the flasks were heated again at 180°C. When the solution became colorless and clear, the remainders were diluted with ultrapure water to 10 ml. Blank digestion was also carried outinthe same way. And then, Se concentration was determined with a Se standard solution curve using atomic fluorescent spectrometry AFS-2100, Beijing Kechuang Hegang Instrument, China with a Se standard solution curve.
Statistical Analysis
All the data were subjected to statistical analysis in two-way ANOVA using IBM SPSS 25 software. Differences between the treatments and genotypes were performed by Duncan’s Multiple Range Test (DMRT) at a 5% confidence interval (P<0.05).
Result
Total Chlorophyll and Carotenoids
The effect of different levels of Zn soil application on total chlorophyll and carotenoids in leaves of three rice genotypes is shown in Table 1. According to the current results, the main effect of Zn treatments on total chlorophyll content and carotenoids was observed to be statistically significant (P < 0.05). The total chlorophyll content significantly increased at three concentrations of Zn supply: Zn5, Zn10, and Zn15 as compared to no Zn application but no significant differences between Zn treatments while carotenoids significantly increased at Zn15. The main effect of genotypes was found to be statistically significant (P < 0.05), and the two genotypes, Z3055B and Z5097B showed the higher total chlorophyll content as compared to R725 while the highest carotenoid was found in Z5097B. Influence of interaction effect of genotypes and Zn treatments on total chlorophyll content and carotenoids was found statistically no significant (P < 0.05).
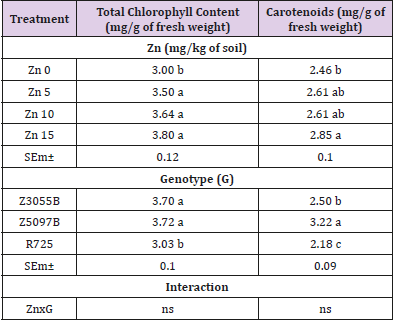
Table 1: Total chlorophyll and carotenoids in flag leaves of rice genotypes at flowering time as affected by Zinc (Zn).
Note: Data in column with same letter are not significantly different at the 0.05 level by least significant difference test; SEm± and ns stand for means of standard error and no significant difference respectively
Superoxide Dismutase (SOD) and Catalase (CAT)Activity
The effect of different rates of Zn soil application on SOD and CAT enzymes activity in leaves of three rice genotypes is shown in Table 2. Main effect of Zn treatments on SOD was found to be statistically significant (P < 0.05). At two concentrations of Zn supply: Zn5 and Zn10, SOD activity significantly increased comparing with Zn0 but no significant differences between Zn5 and Zn10 treatments. Main effect of genotypes was found to be statistically significant (P < 0.05) and R725 showed the higher SOD activity as compared to Se rich rice genotypes, Z3055B and Z5097B. CAT activity in flag leaves at the flowering time significantly increased under Zn supply (P <0.05). CAT activity in flag leaves at the treatment of Zn5 was higher than that in the treatment of Zn10 and Zn15. The highest level of CAT was found in Z3055B among three genotypes and the influence of theinteraction effect of genotypes and treatments on CAT was found statistically no significant.
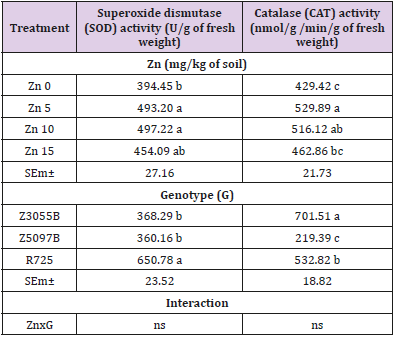
Table 2: Total chlorophyll and carotenoids in flag leaves of rice genotypes at flowering time as affected by Zinc (Zn).
Note: Data in column with same letter are not significantly different at the 0.05 level by least significant difference test; SEm± and ns stand for means of standard error and no significant difference respectively.
Grain Yield and Total Dry Matter Per Pot
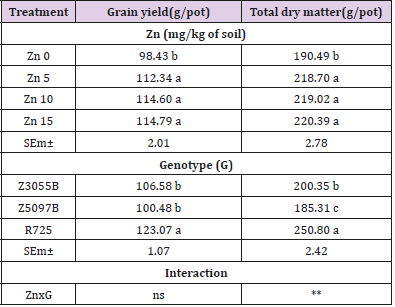
Table 3: Grain yield and total dry matter of rice genotypes as affected by Zinc (Zn).
Note: Data in column with same letter are not significantly different at the 0.05 level by least significant difference test; SEm±, ns and ** stand for means of standard error, no significant difference and significant at the 0.01 respectively.
According to the current results, Zn application exerted significant effect on the grain yield and total dry matter of three rice genotypes (Table 3). At three concentrations of Zn supply: Zn5, Zn10 and Zn15, the grain yield and total dry matter significantly increased comparing Zn0 but no significant differences between the Zn treatments (P < 0.05). The main effect of genotypes was found to be statistically significant and R725 showed the higher grain yield and total dry matter as compared to Z3055B and Z5097B (P < 0.05). Influence of interaction effect of genotypes and treatments on the grain yield was found statistically no significant but significant influence effect of genotypes and treatments interaction on the grain yield and total dry matter.
Zinc Concentration in Brown Rice
According to the current results, Zn soil application revealed significant effect on Zn concentration in brown rice of three rice genotypes (Table 4). The main effect of Zn treatmentson Zn concentration in brown rice was found to be statistically significant. At two concentrations of Zn supply: Zn10 and Zn15, Zn concentration in brown rice significantly increased comparing to Zn0 and Zn5 but no significant differences between the treatments of Zn10, and Zn15 (P < 0.05). The main effect of genotypes was observed to be statistically significant, and the two genotypes, Z3055B and R725 (35.29 and 37.88 mg/kg) showed the higher Zn concentration in brown rice as compared to Z5097B (31.65 mg/kg). Influence of interaction effect of genotypes and treatments on Zn concentration in brown rice was found statistically no significant (P < 0.05).
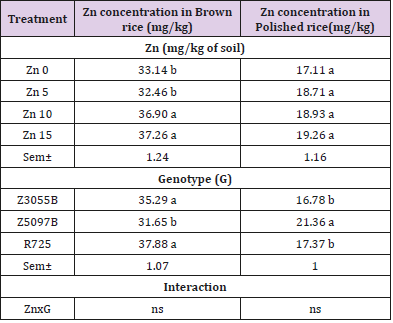
Table 4: Zinc concentration in brown rice and polished rice of rice genotypes as affected by Zinc (Zn).
Note: Data in column with same letter are not significantly different at the 0.05 level by least significant difference test; Sem± and ns stand for means of standard error and no significant difference respectively.
Zinc Concentration in Polished Rice
The effect of different levels of Zn soil application on Zn concentration in polished rice of three rice genotypes is shown in Table 4. Zn concentration in polished rice no significantly increased under three concentrations of Zn supply: Zn5, Zn10 and Zn15as compared to no Zn application according to the results (P < 0.05). Main effect of genotypes was found to be statistically significant (P < 0.05) and Z5097B (21.36 mg/kg) could accumulate the higher Zn concentration in polished rice as compared to Z3055B and R725 (16.78 and 17.37 mg/kg). Influence of interaction effect of genotypes and treatments on Zn concentration in polished rice was found statistically no significant (P < 0.05).
Selenium Concentration in Brown Rice
The effect of different levels of Zn soil application on Se concentration in brown rice of three rice genotypes is shown in Table 5. The result exerted the significant effect of increasing Zn addition on Se concentration in brown rice. Se concentration in brown rice significantly could accumulate at Zn10 supply as compared to Zn0, Zn5 and Zn15 (P < 0.05). The main effect of genotypes was found to be statistically significant (P < 0.05), and two Se rich rice genotypes, Z3055B and Z5097B (0.052 and 0.056 mg/kg) showed the higher Se concentration in brown rice as compared to R725 (0.038 mg/ kg). Influence of interaction effect of genotypes and Zn treatments on Se concentration in brown rice was found statistically no significant (P < 0.05).
Selenium Concentration in Polished Rice
The effect of different rates of Zn soil application on Se concentration in polished rice of three rice genotypes is shown in Table 5. Increasing Zn supply significantly could increase Se concentration in polished rice. At the rates of Zn supply: Zn10 and Zn15, Se concentration in polished rice improved as compared to Zn0 and Zn5 (P < 0.05) but no significant differences between the treatments of Zn10 and Zn15. Main effect of genotypes was found to be statistically significant and two Se rich rice genotypes (P< 0.05), Z3055B and Z5097B (0.049 and 0.050 mg/kg) showed the higher Se concentration in polished rice as compared to R725 (0.033 mg/ kg). Influence of interaction effect of genotypes and treatments on Se concentration in polished rice was observed statistically no significant (P < 0.05).
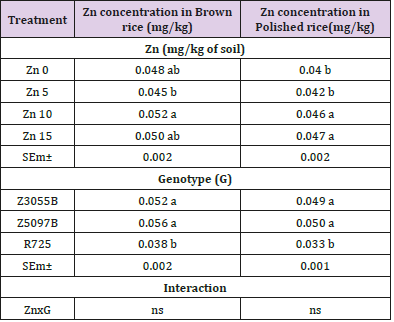
Table 5: Selenium (Se) concentration in brown rice and polished rice of rice genotypes as affected by Zinc (Zn).
Note: Data in column with same letter are not significantly different at the 0.05 level by least significant difference test; SEm± and ns stand for means of standard error and non - significant difference respectively
Zinc and Selenium Losses Owing to Milling and Polishing Operation
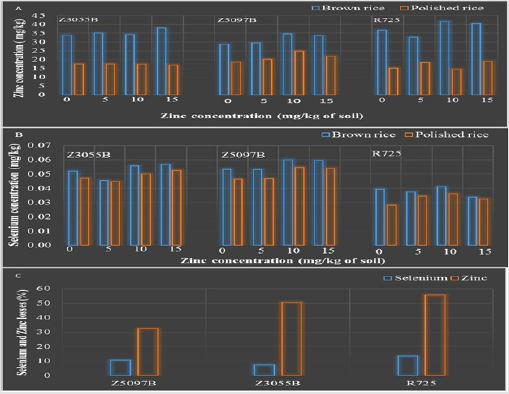
Figure 1: Means of Zinc concentration in brown rice and polished rice of rice genotypes (A), means of 507 Selenium concentration in brown and polished rice under zinc application with three replications (B) and 508 percent loss of Zinc and Selenium owing to milling and polishing (C).
When Zn and Se concentrations in brown rice and polished rice of all genotypes were assessed in the current study, Zn and Se losses due to the polishing were 32.7 and 8.3 % in Z5097B, 50.7 and 7.1 % in Z3055B, 13.44 and 55.08 % in R725 respectively shown in Figure 1. It was found that percent loss of Zn nutrient was higher than Se nutrient due to milling and polishing operation. Moreover, it was observed that the percent loss of Zn in Z5097B was the lowest and the highest percent loss of Zn in R725.
Discussion
Zn is an essential plant nutrient that plays an important role in plant growth. It has been reported that Zn promotes chlorophyll synthesis as a structural and catalytic component of proteins, enzymes, and as co-factor for normal development of pigment biosynthesis [25]. In previous reports, 5 mg/kg of soil Zn application increased total chlorophyll content in rice leaves and 14 Zn mg/kg of soil could increase SPAD values improving plant photosynthetic characteristics under water stress in wheat [26,27]. In the current study, it was observed that total chlorophyll content increased under Zn application but increasing Zn supply could not increase total chlorophyll content.
It was reported that a Zn efficient rice variety contains higher chlorophyll content than a Zn inefficient rice variety under Zn application [26]. According to the current results, two Se rich rice genotypes, Z3055B and Z5097B contained the higher total chlorophyll content. Carotenoids scavenge free radicals, which are generated owing to excess excitation energy from chlorophyll during photosynthesis. It was reported that a decrease in carotenoids of the black gram was more marked under Zn deficiency than excess [28]. In the current study, an increase in carotenoids was marked at Zn15 supply. It was reported that a relative decrease was more marked in the Zn deficient plants of pea genotype [29]. In the current study, the highest carotenoids were also found in Z5097B, Se rich genotype. According to the current results, the different response of total chlorophyll and carotenoids under Zn application might be due to Se rich genotype or the environmental condition at the different flowering time of three rice genotypes.
Zinc is an essential plant nutrient that acts as a metal component and a functional, structural and regulator cofactor of many enzymes. There was a positive relationship between zinc applications, yield and the activity of two enzymes; SOD and acid phosphatase (AcPh) activity with the proper functioning of the enzymes under zinc sufficient conditions [30]. On the other side, SOD and CAT are well-known enzymes that constitute the first line of defense against reactive oxygen species (ROS) within a cell [12,31]. The previous research reported that soil application (5 Zn mg /kg of soil) increased SOD activity of two rice cultivars and 14 mg Zn/kg of soil application significantly increased SOD gene and CAT expression under water stress in wheat [26,27]. In the present experiment, Zn soil application increased SOD and CAT activity as compared to no Zn application although there was no significant increase under the increased Zn supply. The lowest SOD activity in Se rich genotypes might be possible due to the genotype difference of maintainer and restorer line.
Moreover, the lowest SOD in Se rich rice might be as glutathione peroxidase (GSH-Px) and SOD activities were to some extent underestimated due to denaturation processes during the enzyme assays due to the potential presence of phenolic compounds and protease activity [32], and Se might encounter with ROS resulted in oxidation in proteins, nucleic acid, lipid peroxidation which causes inactive enzymes, disruption membranes, mutations, cell dealt. Moreover, it was observed that CAT activity was higher at Zn5 supply as compared with Zn10 and Zn15 in the current study. Zn efficient pea genotype demonstrated a significantly higher SOD and CAT activity in leaves at Zn deficient condition [29]. According to the current results, the highest CAT activity was observed in Z3055B, and no significant increase in SOD and CAT enzymes activity under increased Zn addition might be affected by the increase Zn application level as Zn is one of the heavy metals which cause plant stress, and the lowest SOD and CAT enzymes activity of Z5097B might be due to the plant height in the pot trail at the flowering time as the plant height of Z5097B was the highest among all genotypes. Earlier reports indicated that plant growth, yield, and grain Zn concentration of many crops could be achieved through Zn fertilization [32-35].
In field experiment, Ghoneim [36] mentioned that soil application of 15 kg/ha as ZnSO4 increased total N %, K % and available Zn content in both grain and straw of rice. Ma et al. [27] reported that 14 mg/kg of soil Zn application increased the grain yield of wheat in pot study. No significant effect beyond 5 mg Zn /kg of soil for grain yield and total dry matter in the current study supported that soil Zn concentrations beyond the critical limits may not be necessarily [37]. The variation in the potential grain yield among rice genotypes demonstrated that genotype is an important contributor to overall variability and must be considered in Zn fertilization management [20]. In the present results, the highest grain yield and total dry matter of R725 is also possible due to biomass production of restorer line with the longest growth maturity day among three genotypes. Zn fertilizer application has been recommended as an effective way to increase grain yield and Zn concentration. A low or high grain-Zn genotype is characterized by several mechanisms such as soil moisture, exudation of low molecular-weight of organic acid, anions activity of Zn-dependent enzymes, overexpression of specific Zn transporters. It was reported that following 14mg/kg of soil Zn application, grain Zn concentration of wheat enhanced regardless of water treatment [27].
In our experiment, Zn10 and Zn15 application had the higher Zn concentration in brown rice. Similar results were reported by [20,38,39]. Therefore, the increased Zn concentration in brown rice was the outcome of increased availability, absorption, translocation and deposition of Zn in grain. Regarding Zn nutrient in polished rice, Zn nutrient is almost exclusively stored in the husk, aleurone, and embryo. In our experiment, Zn soil application could not significantly improve Zn concentration in polished rice. Z5097B, Se rich rice genotype could maintain the highest Zn concentration (21.36 mg/kg) in polished rice among three genotypes although Z3055B and R725 showed the higher Zn concentration in brown rice. Jiang et al.[38] explained that the important role in Zn transport from the nucellar epidermis and aleurone cells to the endosperm (polished rice) is the apoplastic pathway within the rice grain. Wang et al. [40] reported that Zn transport is inhibited later during the grain filling stage due to large amounts of phytic acid accumulated in the outer aleurone layer although there is no particular restriction for Zn transport from aleurone to the inner part of the endosperm during the early grain growth stage , and Wirth et al. [41] found that over-expression of phytase degrades phytic acid and enhances the availability of Zn fortification in rice. Yang et al. [42] found that genotypic variation in Zn concentration between the endosperm and the aleurone layers was due to partly differences of Zn loading into the inner endosperm. In the current study, the highest Zn concentration in polished rice of Z5097B might be due to genotypic variation in Zn concentration between endosperm and the aleurone layers among three rice genotypes.
From the current study, sufficient soil Zn fertilization could promote Se concentration increase in brown rice and polished rice. The possible reason might be an indirect relationship with the ZnSO4 fertilizer in Sulphur (S) and phosphorus-deficient soil. Because Se and S biochemistry and antagonistic effects on each other during Se absorption and then Se compounds are formed as a result of the sulfate assimilatory pathway and sulfur amino acidderived metabolism [23]. However, Fang et al. [43] reported that Zn and Fe foliar spray did not affect the uptake and transport of Se from the leaf to grain in rice due to the different uptake metabolism of Se with Zn and Fe. Qian et al. [44] found that the application of single Se and Zn or combined Se-Zn significantly affected Se distribution in tea subcellular cells with the finding that Se was mainly distributed in membranes and organelles by Se and Se-Zn interaction and accumulated in cell wall by single Zn treatment. One more reason might be that Zn is a micro-battalion and Zn containing enzymes regulate and promote many plants process; CO2 fixation, maintain membrane, protein synthesis, auxin formation, hormones such as indole 3acetic acid (IAA) and gibberellin related to uptake most of the nutrients. In the current study, genotypes differed significantly in respect of Se concentration in the brown and polished rice. It might be the reason that different root and leaf morphology which can induce more Se uptake by phosphate transporters [45].
Concerning milling and polishing operation, the processing of rice grain has only little effect on Se concentration of polished rice products while there was a great reduction in Zn concentration. The reason might be that Zn deposited in the protein storage vacuole of aleurone and embryo stored with phytate as mineral salt so-called globoids [46] and Se forms as selenomethionine in the protein storage evenly distributed in the different tissues of wheat grain [43,47]. From the current study, the grain type of Z5097B is short bold among three genotype and the lowest percent loss of nutrient in Z5097B among three genotypes might be due to varietal differences for the extent of loss which depends on other traits like grain size, shape, and density under the same polishing time [34].
Conclusion
According to the current results, Zn had a cumulative effect on Se in rice and Zn soil application (10 mg Zn/kg of soil) improved grain yield, Zn and Se nutrients in brown rice. Z5097B, Se rich rice genotype could highly maintain both Zn and Se nutrients in polished rice even after polishing. Finding the difference of Zn distribution in brown and polished rice among three rice genotypes, for the cost- effective and sustainable strategy to remote Zn and Se deficiency relied on rice as the staple diet, motivate breeders to focus and develop new genotypes or select lines from already existed genotypes in the market with elevated concentration of micronutrients in polished rice in the future breeding program. The current study was pot experiment and futher investigation is required under field research trials.
Acknowledgment
This work was supported by (1) International Cooperation and Exchanges Research Program of the Department of S&T of Sichuan Province (2017HH0031), (2) Key Technology R&D Program of Sichuan Province (2016NZ0106) and (3) International Cooperation and Exchanges Research Program of the Department of S&T of Sichuan Province (2018HH0016).
References
- Lu K, Li L, Zheng X, Zhang Z, Mou T, et al. (2008) Quantitative trait loci controlling Cu, Ca,Zn, Mn and Fe content in rice grains. Journal of Genetic 87(3): 305-310.
- Krishnaswami (1998) Country profile: India. Nutritional disorders old and changing. Lancet 351(9111): 1268-1269.
- Myers SS, Zanobetti A, Kloog I, Huybers P, Leakey ADB, et al. (2014) Increasing CO2 threatens human nutrition. Nature 510: 139-142.
- Wu Z, Bañuelos GS, Lin ZQ, Liu Y, Yuan L, et al. (2015) Biofortification and phytoremediation of seleni in China. Frontiers in Plant Science 6: 136.
- Bouis HE, Chassy BM, Ochand JO (2003) Determination of Effect of Different Levels of Polishing on Zinc Content in Rice Grains. Trends in Food Science & Technology 14: 191-209.
- Mirzapour MH, Khoshgoftar AH (2006) Zinc Application Effects on Yield and Seed Oil Contentof Sunflower. Journal of Plant Nutrition 29: 1719-1727,
- Jiang W, Struik PC, Lingna J, Van Keulen H, Ming Z, et al. (2007) Uptake and distribution of root‐applied or foliar‐applied 65Zn after flowering in aerobic rice. Annals of Applied Biology 150(3): 383-391.
- Martinez CP, Borrero J, Taboada R, Viana JL, Neves P, et al. (2010) Rice cultivars with enhanced iron and zinc content to improve human nutrition. 28th International Rice Research Conference 28th International Rice Research Conference 8-12 November 2010.
- Duffner A, Hoffland E, Stomph TJ, Melse Boonstra A, Bindraban PS (2014) Elimination zinc deficiency in rice-based systems, VFRC Report 2014/2, Virtual Fertilizer Research Center, Washington, DC, USA.
- Palmgren MG, Clemens S, Williams LE, Kramer U, Borg S, et al. (2008) Zinc biofortification of cereals: problems and solutions. Trends in plant science 13(9): 464-473.
- Prom U Thai C, Glahnb RP, Chengb Z, Fukaia S, Rerkasemc B, et al. (2009) The bio availability of iron fortified in whole grain parboiled rice. Food Chemistry 112(4): 982-986.
- Marschner H (1995) Mineral nutrition of higher plants. Academic, San Diego, Canada, p889.
- Cakmak I (2000) Role of zinc in protecting plant cells from reactive oxygen species. New Phytologist 146: 185-205.
- Chang HB, C Win L, Huang HJ (2005) Zinc induced cell death in rice (Oryza sativa L.) roots. Plant Growth Regulation 46(3): 261-266.
- Herschfinkel M, Silverman WF, Sekler I (2007) The zinc sensing receptor, a link between zinc andcell signaling. Molecular Medicine 13(7-8): 331-336.
- Gill SS, Tuteja N (2010) Reactive oxygen species and antioxidant machinery in abiotic stress tolerance in crop plants. Plant Physiology and Biochemistry 48(12):909-930.
- Broadley MR, White PJ, Hammond IZ, Lux A (2007) Zinc in Plants. New Phycologist 173(4): 677-702.
- Tabatabai SMR, Oveysi M, Honarnejad R (2015) Evaluation of some characteristics of corn underwater stress and zinc foliar application. GMP Review 16: 34-38.
- Cakmak I, Kalayci M, Kaya Y, Torun A, Aydin N, et al. (2010) Biofortification and localization of zinc in wheat grain. Journal of Agricultural and Food Chemistry 58(16):9092-9102.
- Hussain ST, Hussain A, Ah Dar S (2018) Biofortification benefits of zinc application to rice genotypes. Journal of Pharmacognosy and Phytochemistry 7(1): 1555-1558.
- House AW, Welch RM (1989) Bioavailability of and interactions between zinc and selenium in rats fed wheat grain intrinsically labeled with 65Zn and 75Se. The Journal of Nutrition 119(6): 916–921.
- De S GA, De Carvalho J, Rutzke M, Albrecht J, Guilherme L, et al. (2013) Evaluation of germplasm effect on Fe, Zn and Se content in wheat Seedlings. Plant Science 210:206-213.
- Sors T, Ellis D, Salt D (2005) Selenium uptake, translocation, assimilation and metabolic fate in plants. Photosynthesis Research 86(3): 373-389.
- Krishnan P, Iyyakutty R (1996) Methods for estimating the chlorophyll content in rice leaves: are appraisal. Indian Journal of Experimental Biology 34: 1030-1033.
- Balashouri, Prameelavi (1995) Effect of zinc on germination, growth, pigment content and phyto mass of Vigna radiata and Sorghum bicolor. Journal of Eco biology 7(2): 109-114.
- Mathpal BM, Srivastava PC, Shankhdhar D, Shankhdhar SC (2015) Improving key enzyme activities and quality of rice under various methods of zinc application. Physiology and Molecular Biology of Plants 21(4): 567-572.
- Ma D, Sun D, Wang C, Ding H, Qin H, et al. (2017) Physiological Responses and Yield of Wheat Plants in Zinc-Mediated Alleviation of Drought Stress. Frontiersin Plant Science 8: 860.
- Girish CP, Binoy G, Nalini P (2011) Induction of Oxidative Stress and Antioxidant Responses in Vigna mungo by Zinc Stress1. Russian Journal of Plant Physiology 59(1): 198-205,
- Nalilni P, Binod G, Girish CP (2012) Antioxidant responses of pea (Pisum sativumL.) genotypes to zinc deficiency. Russian Journal of Plant Physiology 59(2): 198-205,
- Bharti K, Pandey N, Shankhdhar D, Srivastava PC, Shankhdhar SC (2014) Effect of different zinc levels on activity of superoxide dismutases & acid phosphatases and organic acid exudation on wheat genotypes. Physiology and Molecular Biology of Plants 20(1): 41-48.
- RG A, NE Heath L (2002) Role of superoxide dismutase (SODs) in controlling oxidative stress in plants. Journal of Experimental Botany 53(372): 1331-1134.
- Helina H, Tailin X, Vieno P (2000) Selenium as an antioxidant and pro-oxidant in ryegrass Plant and Soil 225(1): 193-200.
- Shehu HE, Jamala GY (2010) Available Zn Distribution, Response and Uptake of Rice (Orizasativa) to Applied Zn Along a Topo sequence of Lake Gerio Fadama Soils at Yola, North-eastern Nigeria. Journal of American Science 6(11): 1013-1016.
- KN K, Dalawai N, HE S, HV, VS (2017) Determination of Effect of Different Levels of 429 Polishing on Zinc Content in Rice Grains International Journal of Pure & Applied Bioscience 430 5 (1): 694-702,
- NK F, AB, DS, T C (2011) Zinc Nutrition of Lowland Rice. Communications in Soil Science and Plant Analysis 42(14): 1719-1727.
- Ghoneim AM (2016) Effect of Different Methods of Zn Application on Rice Growth, Yield and Nutrients Dynamics in Plant and Soil Journal of Agriculture and Ecology Research International, 6(2): 1-9.
- Khan P, Yousuf MM, Imtiaz M, Depar N, Aslam M, et al. (2012) Determining the zinc requirements of rice genotype Sarshar evolved at NIA Tandojam. Sarhad Journal of Agriculture 28: 1-8.
- Jiang W, Struik PC, Keulen HV, Zhao M, Jin LN, et al. (2008) Does increased zinc up take enhance grain zinc mass concentration in rice? Annals of Applied Biology 153: 135-147.
- Cakmak I (2015) Identification and correction of widespread zinc deficiency in Turkey-a success story. NATO Science for Stability Project.
- Wang KM, Wu JG, Li G, Zhang DP, Yang ZW, et al. (2011) Distribution of phytic acidand mineral elements in three indica rice (Oryza sativa L.) cultivars. Journal of Cereal Science 54(1): 116-121.
- Wirth J, Poletti S, Aeschlimann B, Yakandawala N, Drosse B, et al. (2009) Rice endo-sperm iron biofortification by targeted and synergistic action of nicotianamine synthase and ferri-tin. Journal of Plant Biotechnology7(7): 631-644.
- Yang X, Ye Z, Shi CH, Zhu ML, Graham RD (1998) Genotypic differences in concentrations of iron, manganese, copper, and zinc in polished rice grains. Journal of Plant Nutrient 21: 1453-1462.
- Fang Y, Wang L, Zhihong X, Zhao L, An X, Hu Q (2008) Effect of Foliar Application of Zinc, Selenium, and Iron Fertilizers on Nutrients Concentration and Yield of Rice Grain in China. Journal of Agricultural and Food Chemistry 56(6): 2079-2084.
- Qian D, Changquan W, Bing L, Huanxiu L, Yang L (2010) Effects of Se, Zn and their interaction on the subcellular distribution of selenium in spring tea leaves. Acta Horticulture Sinica 37: 794-800.
- HF L, SP M, FJ Z (2008) Selenium uptake, translocation and speciation in wheat supplied with selenite orselenite. New Phytologist 178(1): 92-102,
- Brinch Pedersen H, Borg S, Tauris B, Holm PB (2007) Molecular genetic approaches to in-creasing mineral availability and vitamin content of cereals. Journal of Cereal Science 46 (3): 308–326.
- Hawkesford MJ, Zhao F (2007) Strategies for increasing the selenium content of wheat. Journal of Cereal Science 46 (3): 282-292.
