 Research Article
Abstract
This publication discusses models that describe the heart tissue as an active conductive system, considering its self-oscillating properties. In this type of models, cardiac rhythms can be described on the basis of the theory of dynamic systems, which justifies the need to build a universal model of oscillating medium. This type of model contributes to the understanding of these pathologies’ cardiac activity as parasecoli and AB-blockade.
Introduction
The first theoretical study of cardiac arrhythmias was conducted in 1920-ies of the van - der - Pol and van - der - Mark, who proposed an electrical model of the heart [1,2]. They suggested that the activity of the heart can be simulated by three nonlinear oscillators corresponding to ACS, Atria and ventricles. This possibility was confirmed by the fact that the graphical representation of the processes occurring in the system of nonlinear oscillators had a form similar to the action potentials of heart cells. In this system, there was a unidirectional connection between the sinus and atrial oscillators, and the same connection existed between the atrial and ventricular oscillators. Reducing the connection between the latter, they found that it is possible to obtain a number of different rhythms with phase captures, qualitatively corresponding to the ABblockades of the heart. After the publication of the work [2], many researchers tried to model the dynamics of heartbeats, believing it to be generated by several coupled oscillators. These developments can be divided into two large groups: analysis based on continuous - time representations (ODE systems) and studies based on discrete - time representations (finite-difference equations). In this section we will consider in detail the main stages of development of these concepts and the corresponding mathematical concepts.
Discrete Models & of A System of Interacting Pacemaker
Consider some physical quantity ξ, which reflects the internal
state of the biological oscillator. Let own oscillator period is
equal to T0. Let’s call a marker any event that can be clearly seen
in the experiment, which is reached by the value ξ only once per
period. Such a marker may be, for example, the beginning of the
action potential in the cardiac preparation. Define the phase of the
oscillator as follows. The phase of an arbitrarily selected marking
event (for example, the maximum value of ξ) is assumed to be zero.
At any next time, t, 0 < t < T0, the phase is defined as  (mod1). Since the rhythm is restored after the perturbation of the
system, the introduced phase completely determines the state of
the system. Suppose that an external periodic perturbation acts on
a nonlinear oscillator. Then each external influence shifts the state
of the system to a new state:
(mod1). Since the rhythm is restored after the perturbation of the
system, the introduced phase completely determines the state of
the system. Suppose that an external periodic perturbation acts on
a nonlinear oscillator. Then each external influence shifts the state
of the system to a new state:

The function  is called the phase response curve (PRC)
and determines the phase change after the stimulus. The points
is called the phase response curve (PRC)
and determines the phase change after the stimulus. The points
 of the system state are conveniently represented lying on the circle of the unit radius. Then, by iterating the mapping (1), one
point of the circle is converted to another point of the same circle. If
the circle map is continuous, then it can be characterized by a number
called the topological degree and equal to the number of passes
φn+1 on the unit circle for the time in which
of the system state are conveniently represented lying on the circle of the unit radius. Then, by iterating the mapping (1), one
point of the circle is converted to another point of the same circle. If
the circle map is continuous, then it can be characterized by a number
called the topological degree and equal to the number of passes
φn+1 on the unit circle for the time in which  passes it once.
In periodic perturbations of self-oscillations with a stable limit cycle, the dynamics is often described by maps of a circle with a topological degree 0 (when the over-threshold response gives rise to a new cycle) or 1 (which expresses a sub-threshold response to stimulation). The different types of circle maps are shown in Figure 1.
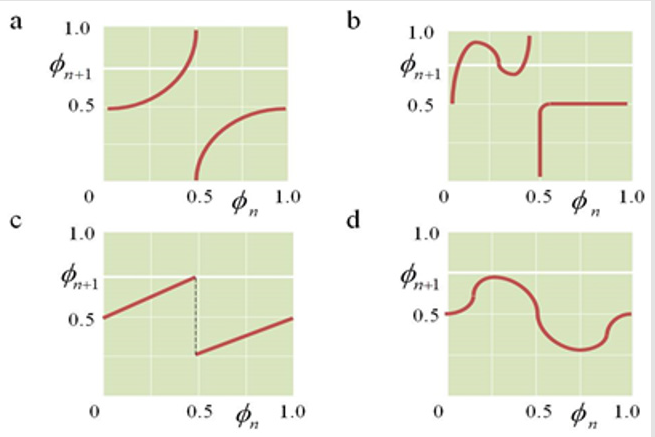
Figure 1: Different types of circle maps:
i. Reversible, topological degree 1
ii. Irreversible, topological degree 1
iii. Piecewise continuous
iv. Topological degree 0.
Along with the topological degree, an important characteristic of the circle display is the number of rotations. We define it as the time average ratio of the external perturbation period to the period of the perturbed oscillator. If the rotation number is rational, ρ = M/N (here M is the number of cycles of the stimulator, and N is the number of cycles of the nonlinear oscillator), then the dynamics of the system will be periodic with the capture of the phase of multiplicity N/M. If the rotation number is irrational, the system exhibits quasi-periodic or chaotic behavior. In many cases, the disturbance by a single pulse of a spontaneously oscillating system leads to a phase shift of the current rhythm (see, for example, [1,3] and references there). The magnitude of the shift depends on both the magnitude of the stimulus and its phase in the cycle. The graph of the dependence of the new phase on the previous phase (i.e., PRC) is either a continuous circle map with a topological degree of 1 or 0, or a discontinuous function. One of the simplest (and coarsest) approximations of a given PRC is the sinusoidal function, which ultimately results in a map of the form (2):

Where a and b are constants. This approximation, for all its simplicity, correctly reflects the qualitative structure of the phase portrait of the system under study. The analysis of bifurcations of reversible circle maps was undertaken in the last century by A. Poincare and still attracts much -by V. Arnold [4] (see also [5] and the references given there). For pic.6 the bifurcation diagram of the circle diffeomorphism on the parameter plane (b, a) is shown. This diagram is divided into areas called language (or horns) of Arnold, which correspond to the sustainable capture phase ratio N/M (i.e., N cycles of the stimulator has M cycles of a nonlinear oscillator). Arnold languages exist for all rational relations N/M, where N and M are mutually Prime numbers. This means that there are an infinite number of Arnold languages that correspond to all possible ratios of frequencies of the stimulator and the perturbed oscillator. Between any two languages corresponding to N/M and N*/M* phase captures, there is another capture region corresponding to the capture of multiplicity phases (N+N*)/(M+M*). The structure shown in Figure 2, is the usual behavior for low stimulus amplitudes in simple theoretical models discussed below. However, as the amplitude of the periodic effect increases, this structure collapses.
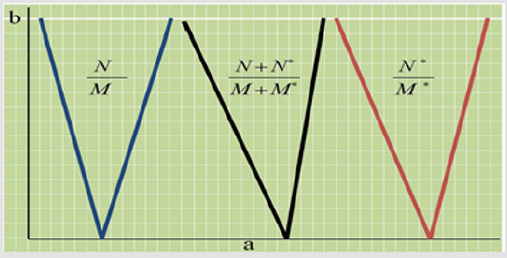
Figure 2: Schematic diagram of Arnold tongues. In shaded areas there is a steady phase capture. There are always other zones between any two capture zones.
Model of Two Interacting Pacemakers Considering the Refractoriness Time
In this section, we consider two interacting leading centers (pulse oscillators) that can be pacemakers in cardiac tissue, construct a model of such interaction, and investigate its behavior.
The principle of Constructing a Model
Consider a system of two interacting nonlinear pulse oscillators Figure 3. Let the momentum of the first oscillator with the period of undisturbed oscillations appear at the moment of time , and the momentum of the second oscillator with the period of undisturbed oscillations appear at the moment . Then the moments of time of occurrence of the following pulses are defined as:
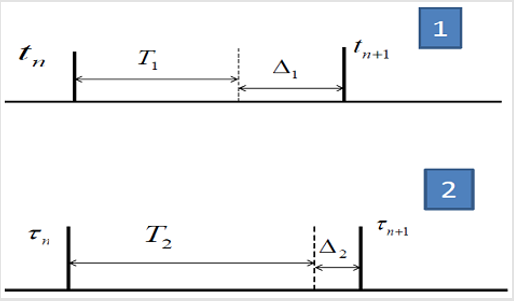
Figure 3: The scheme of construction of the model describing the system of two interacting nonlinear oscillators.

Now, assuming that under the influence of the second pulse,
the period of the first oscillator will change by some value
 (where the expression in parentheses shows
that this value depends only on the phase of the second pulse
relative to the first), then the corresponding expression for tn+1
will look like:
(where the expression in parentheses shows
that this value depends only on the phase of the second pulse
relative to the first), then the corresponding expression for tn+1
will look like:
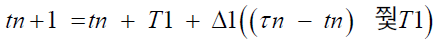 . When you consider that
τn+1 > tn+1 , that for τn+1 get a similar expression:
. When you consider that
τn+1 > tn+1 , that for τn+1 get a similar expression:
 . Dividing
both of these expressions by T1, we find the corresponding
expressions for the phases (3):
. Dividing
both of these expressions by T1, we find the corresponding
expressions for the phases (3):
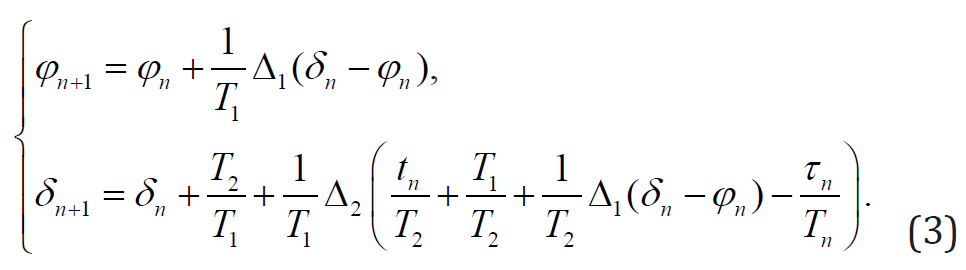
Here  phase of the first perturbed oscillator
relative to the undisturbed (with the period T1),
phase of the first perturbed oscillator
relative to the undisturbed (with the period T1),  − the second phase of the disturbed oscillator with respect to
the same first oscillation with a period of T1. Introducing the
parameter
− the second phase of the disturbed oscillator with respect to
the same first oscillation with a period of T1. Introducing the
parameter  (the ratio of the eigenfrequencies
of both oscillators) and labeling f1 = Δ1 ∕ T1, f2 = Δ2 ∕ T1, after the
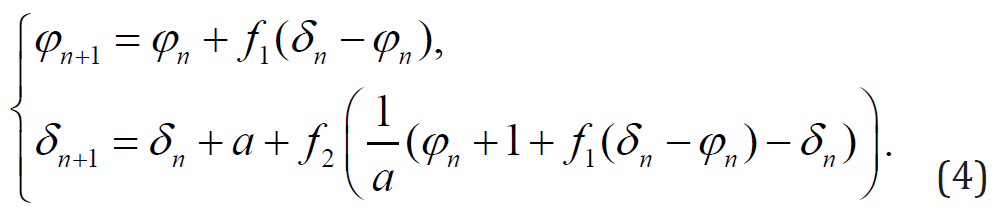
transformations we obtain (4):
(the ratio of the eigenfrequencies
of both oscillators) and labeling f1 = Δ1 ∕ T1, f2 = Δ2 ∕ T1, after the
transformations we obtain (4):
Since we are interested in the phase difference of the described oscillators, the final expression, which will be used in the future, is as follows (5):

where 
Expression 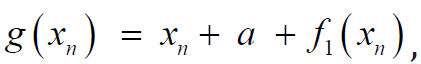 included in the right side
of the equation is a circle map describing the effect of the constant
perturbation on the nonlinear oscillator. Considering the mutual
influence of oscillators leads to the appearance of an additional
nonlinear term. Thus:
included in the right side
of the equation is a circle map describing the effect of the constant
perturbation on the nonlinear oscillator. Considering the mutual
influence of oscillators leads to the appearance of an additional
nonlinear term. Thus: 
Function f1(x), f2(x) called phase response curves, which generally do not coincide with each other. Both oscillators are sources of action potentials in the same tissue, have a similar nature, and can be considered functions f1(x)and f2(x) approximately the same. It is known that the response of the oscillator to an external stimulus depends only on the stimulus phase of its amplitude and the PRC changes its shape when the amplitude of the external influence changes. This means that the functions that define the type of phase response curves must depend on one parameter that determines the magnitude of the amplitude. In the case of this dependence can be considered multiplicative. Then the phase response curves will be written as:
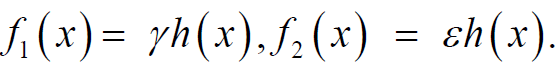
Where h(x) − periodic function,  Under this
assumption, the formula (5) will take the form:
Under this
assumption, the formula (5) will take the form:

Let’s focus on the study of the display (6) sinusoidal functions [6−8].
Phase Diagrams for Systems with Mutual Influence
Let us now dwell on the case of two-way communication of
two pulse systems. Suppose that the effect of the first oscillator
on the second one is relatively small, ε = 0.1. As a PRC we will
take 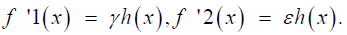 For Figure 2 the
corresponding phase diagram obtained as a result of numerical
study is presented. It depicts for comparison the same steady grips
phases ratio N:M. Here n cycles of the second oscillator account for
M cycles of the first one. It is easy to see that considering the mutual
influence of the oscillators leads to bending and splitting of the
capture areas. Note also that even at small values of the amplitude
of the second stimulus, the main captures are superimposed on
each other. The dynamics of the system thus becomes multistable.
This corresponds to the situation when the limiting behavior of the
display (6) depends on the initial phase difference of the oscillators
x0. For Figure 4 the circle map (6) constructed for some values of a
and γ is given. It kind of confirms that with increasing γ the system
dynamics becomes more complicated, and the display ceases to be
monotonous, and it appears the intervals with the slope, a large 1.
It can be shown [9] that for continuous circle maps this leads to
multistability and chaotic dynamics.
For Figure 2 the
corresponding phase diagram obtained as a result of numerical
study is presented. It depicts for comparison the same steady grips
phases ratio N:M. Here n cycles of the second oscillator account for
M cycles of the first one. It is easy to see that considering the mutual
influence of the oscillators leads to bending and splitting of the
capture areas. Note also that even at small values of the amplitude
of the second stimulus, the main captures are superimposed on
each other. The dynamics of the system thus becomes multistable.
This corresponds to the situation when the limiting behavior of the
display (6) depends on the initial phase difference of the oscillators
x0. For Figure 4 the circle map (6) constructed for some values of a
and γ is given. It kind of confirms that with increasing γ the system
dynamics becomes more complicated, and the display ceases to be
monotonous, and it appears the intervals with the slope, a large 1.
It can be shown [9] that for continuous circle maps this leads to
multistability and chaotic dynamics.
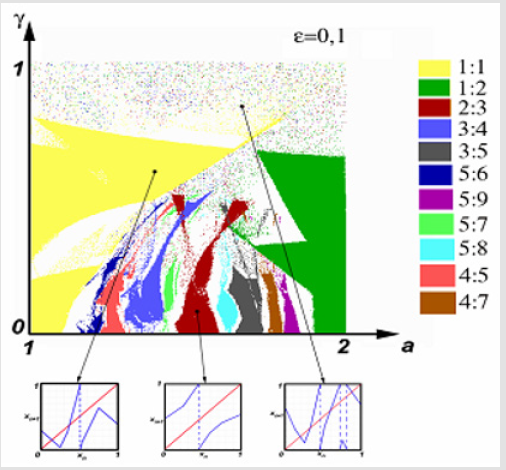
Figure 4: Areas of stable phase captures for piecewise linear mapping of a circle (2) with a PRC of the form (6) considering the mutual influence of oscillators.
Sinusoidal Model
Let  Then the phase response curves will
take the form:
Then the phase response curves will
take the form:  As in the previous paragraph, we consider two cases: one-way and
two-way communication of oscillators.
As in the previous paragraph, we consider two cases: one-way and
two-way communication of oscillators.
Grips Phases in Two-Way Interaction of Oscillators
As a model of two nonlinear interacting excitation sources, we consider two coupled oscillators, assuming the role of h(x) sinusoidal function without taking into account the refractoriness and assuming the value of the influence of the first oscillator on the second ε = 0.1. Then the display (6) takes the form:

Locations of capture of phases, the resulting numerical investigation of (7) shown in Figure 5. Similar to the case of piecewise linear approximation of phase response curves, the consideration of the mutual influence of two pulse systems leads to the curvature of the phase capture regions, their overlapping at small γ and splitting of the main languages. Inside the split areas there are captures, multiples of the main.
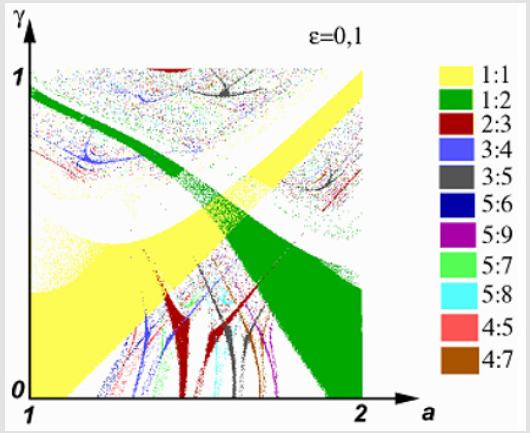
Figure 5: Phase diagram of the sine curve (7) considering the mutual influence of oscillators.
Phase of seizures in the space (a,γ)
Let us first assume that the effect of the first oscillator on the second is relatively small. For fig.6a the phase diagram showing the possible modes of behavior of the system of two interacting oscillators for this case is given. Mutual influence at sufficiently small values leads to similar effects, mutual influence at significantly small values leads to similar effects γ. The increase in the refractoriness time in the model with ε = 0.1. causes a stronger curvature of the main captures and the disappearance of the splitting regions. If we increase the value of the influence of the first oscillator to, for example, ε = 0.5 , we see a very complex structure with a much stronger deformation of the areas of the main captures Figure 6. The 1:1 area will degenerate into a narrow strip, while the 1:2 capture area will grow due to the appearance of long narrow languages. Let us now construct phase diagrams of interacting oscillators in the space of the influence amplitudes (ε, γ). In the first example, let a = 2 (Figure 7a). This value of the ratio of periods means that for ε = γ = 0 the number of rotations is rational, and the dynamics of the system is periodic with a capture of 1:2. With increasing nonlinearity, it is possible to obtain phase capture regions with a different multiplicity, even at large values of ε and γ, the periodic behavior of the system with a capture of 1:2.
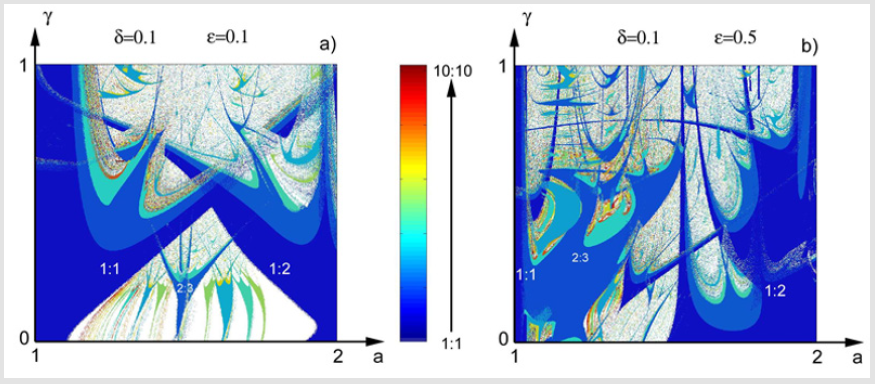
Figure 6: Phase capture areas of a system of oscillators with two-way coupling (δ = 0,1): (a) ε = 0,1: (b) ε = 0,5.
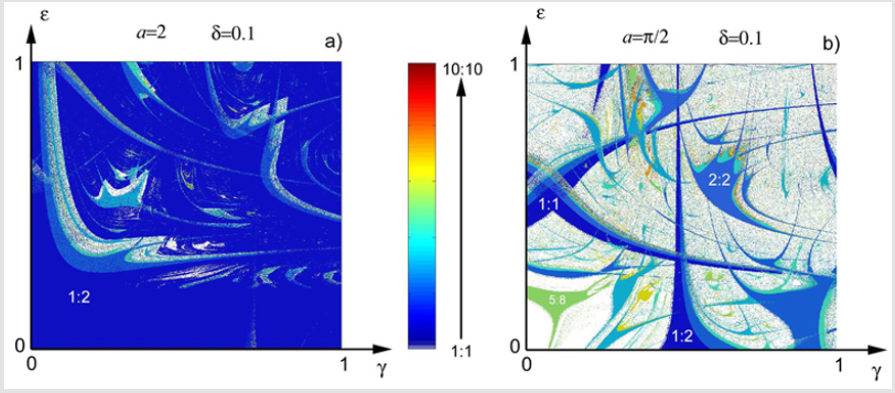
Figure 7: Phase captures in the stimulus amplitude space (δ = 0,1): (a) a = 2: (b) a = π/2.
The opposite situation is observed for a = π / 2 . Here, the number of rotations is irrational at zero stimulus amplitudes, and the system detects a quasiperiodicity or chaotic property. With the growth of nonlinearity, there is a possibility of periodic behavior (Figure 7b). In the case of sufficiently large ε, there is a decrease in the area occupied by the resonance zones. For irrational values of a, the probability of complex system behavior (8) is quite high.
Stabilization of Complex Dynamics and the Possibility of Full Control
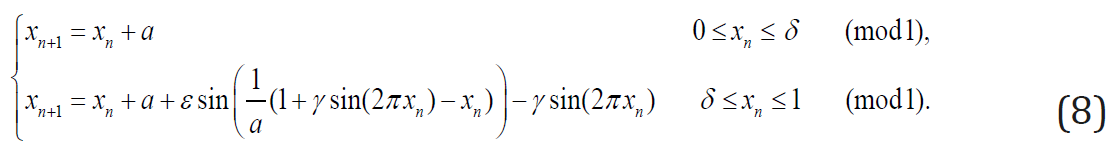
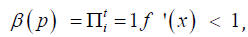
Any cycle of the form x0, x2,..., xN at any xi ϵ σ is sustainable (this cycle includes a critical point), this statement allows us to practically use this method of controlling the dynamics of systems, which are effectively described by such families. Write periodically perturbed mapping explicitly:
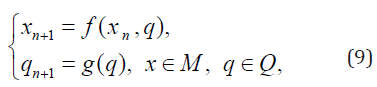
where function f is defined by expression (10):

where a and q are parameters. The set of parameters here
are a, γ, ε and δ. If the map (11) has a cycle p of period t equal to
the perturbation period, 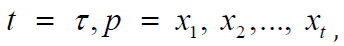 the points
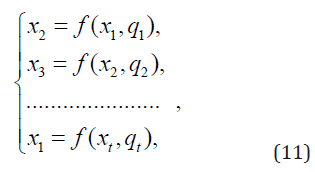
forming this cycle will obey the following system of equations (11):
the points
forming this cycle will obey the following system of equations (11):
To solve the inverse problem, i.e. to find the parameter values at which the map (9) has a given cycle p, it is necessary to express the values from (11) qi. It is clear that not for all possible xi the obtained values of the parameters will satisfy the ratio qi ∈ Q. However, i if this is true for any cycle p = x1, x2,..., xt you can find the values of the parameters q1,q2,..., qt, for which the perturbed map (9) has such a cycle.
If the multiplier of the cycle  it’s
stable. When among the points forming the cycle, there is a critical
xc, the multiplier is always less than one, which ensures stability. In
case of unilateral influence of pacemakers on each other, at ε = 0,
the display at
it’s
stable. When among the points forming the cycle, there is a critical
xc, the multiplier is always less than one, which ensures stability. In
case of unilateral influence of pacemakers on each other, at ε = 0,
the display at  for sinusoidal PRC taking into
account refractoriness (Figure 8a). The functions f(x), determined
from (10), under the mutual influence of oscillators are shown
in (Figure 8b) for sinusoidal PRC. Numerical analysis shows that
with the growth of ε to a value of ~ 0.5, the area occupied by the
resonance zonses becomes larger. This leads to almost complete
mixing of languages, so that it is possible to detect zones of different
multiplicity in a sufficiently small neighborhood of almost any point
(a, γ). However, for these values, self-similar structures are still
clearly visible. As the nonlinearity parameter ε increases further,
the resonance zones decrease, taking up less and less space. In this
case, there is also a very complex picture. Thus, the increase in the
force of influence of the oscillators leads to mixing of the initially
sufficiently ordered structure in space (a, γ).
for sinusoidal PRC taking into
account refractoriness (Figure 8a). The functions f(x), determined
from (10), under the mutual influence of oscillators are shown
in (Figure 8b) for sinusoidal PRC. Numerical analysis shows that
with the growth of ε to a value of ~ 0.5, the area occupied by the
resonance zonses becomes larger. This leads to almost complete
mixing of languages, so that it is possible to detect zones of different
multiplicity in a sufficiently small neighborhood of almost any point
(a, γ). However, for these values, self-similar structures are still
clearly visible. As the nonlinearity parameter ε increases further,
the resonance zones decrease, taking up less and less space. In this
case, there is also a very complex picture. Thus, the increase in the
force of influence of the oscillators leads to mixing of the initially
sufficiently ordered structure in space (a, γ).
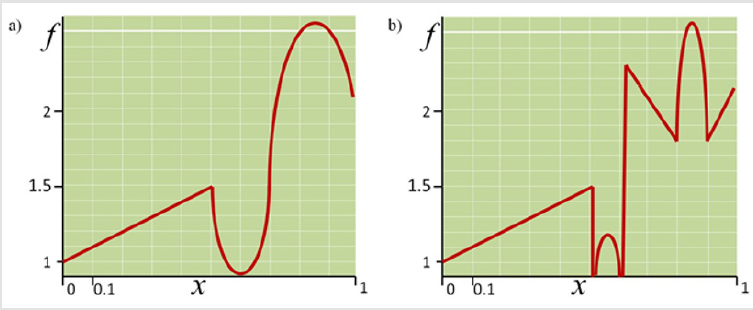
Figure 8: Functions f(x) (10) at different h(x) and parameter values. The ratio of periods a is fixed and is 2 (a) h(x) – sinusoidal PRC, ε = 0, γ =0.7, δ =0.5. (b) h(x) is a sinusoidal PRC, ε = 0.5, γ = 0.7, δ =0.5.
Set of values p = x1, x2,..., xt for whom qi ∈ Q and inequality
 forms a certain area in the coordinate
space R. Each point of this region corresponds to a stable cycle
of disturbed mapping. Using the system of equations (11), it is
possible to obtain the corresponding region in the parametric
space. This enables full control of the system behavior described
by the mapping (12). From the point of view of applications to the
active environment, this means that a simple parametric impact
can control its dynamics. Moreover, if the behavior of the medium
is chaotic, with the help of such control it is easy to stabilize it
and bring the system to the required dynamic mode of motion
[10]. Thus, the main result of this section is quite important for
applications: for the systems described by the map (12), there are
almost always such external influences, in which such systems will
have a prescribed (pre-selected) dynamics.
forms a certain area in the coordinate
space R. Each point of this region corresponds to a stable cycle
of disturbed mapping. Using the system of equations (11), it is
possible to obtain the corresponding region in the parametric
space. This enables full control of the system behavior described
by the mapping (12). From the point of view of applications to the
active environment, this means that a simple parametric impact
can control its dynamics. Moreover, if the behavior of the medium
is chaotic, with the help of such control it is easy to stabilize it
and bring the system to the required dynamic mode of motion
[10]. Thus, the main result of this section is quite important for
applications: for the systems described by the map (12), there are
almost always such external influences, in which such systems will
have a prescribed (pre-selected) dynamics.
Conclusion
The Analogy with Abnormal Heart Rhythms
In conclusion, we draw an analogy between the results and
pathological conditions of cardiac tissue. With the help of the
constructed models it is possible, for example, to describe the
interaction of sinus and ectopic pacemakers, PRC and ABU, and the
impact of external disturbances on the sinus rhythm. If, for example,
consider the first pulse oscillator PRC, and the second – ABU, it can be
found that some stable phase captures correspond to the observed
pathologies in clinical practice. In this case, among the various
grippers are constructed as normal sinus rhythm (capture ratio 1:1)
and classical rhythms Wenkebach (captures multiplicity N:(N-1))
and N:1 AB-blockade. If the first pulse count system of the ABU, and
the second ACS, then appear inverted rhythms Wenkebach (similar
to direct, but that changes the role of the ventricles and the Atria)
observed in some patients. It should be noted that the considered
response functions 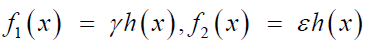 for different
approximations of the form, the functions h(x) are model. They
were taken to analyze the characteristic features of the dynamics
of two nonlinear interacting oscillation sources. In practice,
these functions should be chosen considering additional physical
assumptions about the nature of the interaction and consider the
experimental data on the response of a single oscillatory system
to single pulses of external perturbation. For example, in [11] the effect of short pulses on aggregates of spontaneously oscillating
cells from the embryo heart was considered. The experimentally
obtained phase response curves were approximated by exponential
functions, and the “internal” parameters were chosen for the best
correspondence of the curve graphs to the experimental points.
Their dependence on physical parameters was also chosen in
this way. As a result, the phase diagram obtained numerically
corresponded well enough to the real dynamics of the system.
for different
approximations of the form, the functions h(x) are model. They
were taken to analyze the characteristic features of the dynamics
of two nonlinear interacting oscillation sources. In practice,
these functions should be chosen considering additional physical
assumptions about the nature of the interaction and consider the
experimental data on the response of a single oscillatory system
to single pulses of external perturbation. For example, in [11] the effect of short pulses on aggregates of spontaneously oscillating
cells from the embryo heart was considered. The experimentally
obtained phase response curves were approximated by exponential
functions, and the “internal” parameters were chosen for the best
correspondence of the curve graphs to the experimental points.
Their dependence on physical parameters was also chosen in
this way. As a result, the phase diagram obtained numerically
corresponded well enough to the real dynamics of the system.
Presence of wide areas of phase captures (Figures 4-7), in such systems, various types of synchronization of two oscillators are possible, which qualitatively correspond to some types of cardiac arrhythmias. The phase diagram allows to reveal under what conditions of interaction (i.e. at what values of parameters a, γ, ε and δ) this or that kind of synchronization is possible. Moreover, all the phase patterns presented in this paper indicate that with increasing nonlinearity (i.e., with the growth of the γ parameter), the regions with different captures begin to overlap. Knowledge of such areas and the dynamics of the system in these areas allows by external perturbation (for example, a series of single pulses) to withdraw the system from the unwanted mode of synchronization to a more favorable mode, which is vital. Analysis of phase diagrams makes it possible to find ways to control such systems. We consider the effect of additional periodic pulse action on the behavior of interacting oscillatory subsystems. The study of possible modes of behavior of such a system by varying the frequency and amplitude of the external perturbation will lead its dynamics to a predetermined, for example, to complete suppression of the ectopic sine pacemaker. This problem, considered in the next section, is very relevant for the General theory of control of nonlinear dynamic systems and excitable media, in particular, cardiac tissue, which is satisfactorily described in the models [12,13].
Summary
Modern methods of removing the heart from the state of fibrillation are very rigid (supply of a short electrical pulse of a huge voltage and a large current). The development of nonlinear dynamics and Synergetic made it possible to understand that such a force effect is not necessary. Often enough weak electrical effects directly on the heart muscle. Precisely, if there are spiral waves with opposite directions of rotation in the medium, then, choosing the phase and frequency of external action, it is possible to achieve the movement of the centers of the two waves towards each other and their annihilation. Now the word for careful experimental research. The theory of dynamic systems describes many processes inherent in active media, including some types of arrhythmias [1,3]. Since arrhythmias are caused by certain disorders in the heart muscle and, therefore, are pathological conditions, the modeling of such systems is of great practical interest and can bring closer to solving the problem of the possibility of controlling their behavior through external influences. This, in turn, allows us to come close to the problem of soft withdrawal of active systems from the state of developed space–time chaos that characterizes some types of pathologies [14-17]. A noteworthy work is presented in the publication [18]. In this paper, we have implemented a model of the heart, which describes the real behavior of rhythmic and arrhythmic processes in the heart.
References
- Beuter L Glass, MC Mackey (2003) Nonlinear Dynamics in Physiology and Medicine. In Beuter L Glass, MC Mackey(Eds.), springer, New York, USA.
- RP Grant (1956) The mechanism of A-V arrhythmias; with an electronic analogue of the human A-V node. Am J Med 20: 334-344.
- R Clayton, E Zhuchkova, A Panfilov (2006) Phase singularities and filaments: Simplifying complexity in computational models of ventricular fibrillation. Prog Biophys Mol Biol 90(1-3): 378-398.
- VI Arnold (1991) Cardiac arrhythmias and circle mappings. Chaos 1(1): 20-24.
- K Kaneko (1984) Supercritical behavior of disordered orbits of a circle map. Progr Theor Phys 72(6): 1089-1103.
- A Loskutov, SD Rybalko, EA Zhuchkova (2004) A model of cardiac tissue as an excitable medium with two interacting pacemakers having a refractory time. Banach Center Publ 63: 231-241.
- A Loskutov, SD Rybalko, EA Zhuchkova (2004) A model of cardiac tissue as a conductive system with interacting pacemakers and refractory time. Int J Bifurcation and Chaos 14: 2457-2466.
- PL Boyland (1986) Bifurcations of circle maps: Arnold tongues, bistability and rotation intervals. Commun. Math Phys 106: 353-381.
- A Loskutov (1994) Nonlinear dynamics and cardiac arrhythmia. Applied and nonlinear dynamics 2: 14-25.
- A Loskutov, SD Rybalko, EA Zhuchkova (2003) Modeling and controlling the heart conductive system. Proc of the Int Conference "Physics and Control". In Fradkov AL, Churilov AN(Eds.), Saint Petersburg, Russia: IEEE. P: 522-527.
- L Glass, J Belair, D Scagliotti, D Gordon (1989) A circle map in a human heart. Physica D 40(3): 299-310.
- ME Brandt, G Chen (1996) Controlling the dynamical behavior of a circle map model of human heart. Biol. Cybern 74(1): 1-8.
- DJ Christini, JJ Collins (1996) Using chaos control and tracking to suppress a pathological nonchaotic rhythm in a cardiac model. Phys Rev E 53(1): R49-R52.
- FX Witkowski, PA Penkoske, R Plonsey, DT Kaplan, ML Spano (1995) Development of a nonlinearly deterministic signal generator for real time chaos control testing. Eng in Medicine and Biology Soc IEEE 17th Ann Conf 1: 287-288.
- ME Brandt, Chen Guanrong (1996) Feedback control of a quadratic map model of cardiac chaos. Int J Bifurcation and Chaos 6(4): 715-723.
- A Garfinkel, ML Spano, WL Ditto (1992) Controlling cardiac chaos. Science 257(5074): 1230-1235.
- B van der Pol, J van der Mark (1928) The heartbeat considered as a relaxation oscillation and an electrical model of the heart. Phil Mag 6: 763-775.
- Devid J Christini, Kenneth M Stein (2001) Nonlinear - dynamical arrhythmia control in humans. Medical Sciences 98(10): 5827-5832.
