 Research Article
Abstract
Cold spray has been identified as having Cu coatings with greater antimicrobial properties than that of other additive manufacturing techniques. The addition of nanoagglomerate Cu powder to the cold spray process to form nanomaterial coatings has shown an increase in antimicrobial efficiency, as compared to conventional Cu, in the contact killing of Influenza A Virus. Corrosion testing, microstructural analysis, and composition measurement can help explain why cold sprayed nanomaterial Cu coatings performed better than conventional Cu coatings. Corrosion tests including electrochemical impedance (EIS), Linear Polarization (LP), and an Ion Release Assay all show nanomaterial Cu to have a greater corrosion rate than that of conventional Cu. Micrographs support corrosion results showing nanomaterial Cu to have much smaller grains than conventional Cu, indicating a greater percentage of grain boundaries available for Cu ion release into the environment. Composition testing through X-Ray Diffraction and X-Ray Photoelectron Spectroscopy (XPS) confirm sample surfaces to be comprised of pure Cu and Cu oxide, with the main oxide species present as Cu(i) or Cu20. More research is needed to determine how the dominant Cu species develops based on environmental factors and how the presence of different species affect material antimicrobial properties.
Keywords: Corrosion; Nanomaterial Cu, Cold Spray; Ion Release; Linear Polarization; Electrochemical Impedance
Background
The U.S. spends over $125 billion a year in prevention of touch surface infections [1-5]. Copper cold spray coatings have been identified as having greater antimicrobial effectiveness than other additive methods [1]. This paper builds off of prior work from the paper “Effectiveness of Nanomaterial Copper Cold Spray Surfaces on Inactivation of Influenza A Virus “, where copper cold spray antimicrobial properties are improved with the use of nanoagglomerate Cu powder [2]. There is a need to further qualify consolidated nanomaterial Cu material properties in relation to conventional Cu to better understand Cu kill-mechanisms. The primary killing mechanism of copper is contact killing through deformation of microbe membranes by copper ions leading to cell cytoplasm release and subsequent internal damage to the cell [6- 8]. Further research is needed to determine the main mechanisms for copper ion uptake into the cell [4,9-11]. Research is being performed in the biology field to better understand microbial copper ion defense and uptake mechanisms, including mapping of internal signal pathways and external cell interactions that lead to selective ligand favorability [4,10,12-14].
The U.S. spends over $125 billion a year in prevention of touch surface infections [1-5]. Copper cold spray coatings have been identified as having greater antimicrobial effectiveness than other additive methods [1]. This paper builds off of prior work from the paper “Effectiveness of Nanomaterial Copper Cold Spray Surfaces on Inactivation of Influenza A Virus “, where copper cold spray antimicrobial properties are improved with the use of nanoagglomerate Cu powder [2]. There is a need to further qualify consolidated nanomaterial Cu material properties in relation to conventional Cu to better understand Cu kill-mechanisms. The primary killing mechanism of copper is contact killing through deformation of microbe membranes by copper ions leading to cell cytoplasm release and subsequent internal damage to the cell [6- 8]. Further research is needed to determine the main mechanisms for copper ion uptake into the cell [4,9-11]. Research is being performed in the biology field to better understand microbial copper ion defense and uptake mechanisms, including mapping of internal signal pathways and external cell interactions that lead to selective ligand favorability [4,10,12-14]. open structure than that of atomic grains, making the barrier for diffusion much less in grain boundaries than in the material lattice [3]. In nanomaterial Cu, smaller grain size allows for a greater number of grain boundaries and an increase in ion diffusion as compared to conventional Cu, making microstructure a key factor in nanomaterial Cu’s increased antimicrobial effectiveness [18-20]. Nanomaterial Cu alsohas a much greater surface roughness than that of conventional Cu at the nanoscale, which is the same scale for Influenza A Virus. This may also be a contributing factor in Cu ion release [21]. Environmental factors also affect corrosion rate, including changes in temperature, pH, and humidity.
Water can become de-aerated with increasing temperature, where this decrease in oxygen may decrease corrosion rate [22]. This is not a concern for this work since testing is performed at room temperature. As pH decreases, Cu-alloys and protective films are unable to develop, causing an increase in corrosion rate [22,23]. In a study performed by Feng et al, copper oxide thickness in relation to H2O pH was measured where pH below 4 caused oxide dissolution, pH higher than 4 formed Cu2O, and pH above 10 formed CuO [24]. For this paper 3% (weight) NaCl solution is used in corrosion testing. NaCl is formed from HCl and NaOH, which are a strong acid and base, respectively. Salts comprised of both a strong acid and base do not hydrolyze, instead they dissociate in water into Na+ and Cl- ions [25]. The dipole nature of H2O allows for this to occur, where Na+ is attracted to the electronegative oxygen and Cl- is attracted to the electropositive hydrogen [15,26]. The result is a neutral pH solution. It follows that the predominant oxide to form at this pH is Cu2O. However, humidity also plays a role in oxide species presence, where Cu(i), also known as Cu2O, is more stable in dry environments and Cu(ii), also known as CuO, is more stable in aqueous environments [27].
Other factors determining the favorability of copper oxide state include Cu geometry, bonding, and hard-soft acid-base (HSAB) theory [10,14,17,27,28, 29]. Cu(i) prefers a tetrahedral geometry, favors back-bonding, and is a soft acid that associates with soft bases, whereas Cu(ii) prefers octahedral geometry, has a low degree of back bond donation, and is a borderline hard acid that associates with harder bases. All of the above listed factors may be affected by the environment and the microbes in it. Microbes can select for certain kinds of geometries and bonds using specific ligands and bonding sites, they can also excrete material that changes local pH, and can change their own internal pH [4,10,12,14,15,27,30]. So even if a certain kind of Cu species manifests on the surface of a consolidated Cu coating as a result of environmental factors, this does not mean that the same species will be received or internalized by the microbe. When considering lifecycle and maintenance of Cu coatings, it is important to note that oxides/tarnishing of the Cu surface does not affect the antimicrobial efficacy of the coating [31,32].
Post-processing heat treatment is not recommended for this application as it could negate the antimicrobial effects of the nanoparticles used in the nanomaterial Cu cold spray coating [3]. It is possible that for other applications the need for residual stress relief outweighs the need for antimicrobial efficiency, in those cases heat treatment may be used. Heat treatment work is included in this paper, but most data is placed in the supplemental section as this work is out of scope for the given antimicrobial application. The Pourbaix diagram, (Figure 1), can provide important background information on the movement of Cu ions with changing potential and pH. The Pourbaix diagram assumes that the movement of ions flows passively from high to low concentration. The region in between the two blue dashed lines indicates the thermodynamic stability region of H2O at 1atm [23]. Cu corrosion has an anodic and cathodic reaction. The anodic reaction dissociates Cu into electrons and Cu ions, which can form oxides like Cu2O and CuO or hydroxides like Cu(OH)2. The cathodic reaction consumes the electrons released from the anodic reaction.
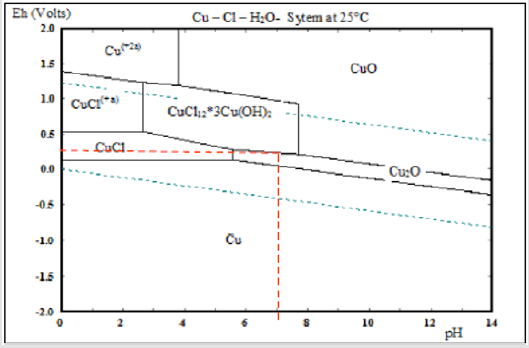
Figure 1: Pourbaix Diagram for Cu in 3%NaCl solution (in water) at 25oC [modified from- 25].
Since NaCl solution in water is neutral, the cathodic reaction would be: O2+2H2O+4e- = 4OH-. Considering that neutral pH is 7 and that standard electron potential of Cu is 0.34, the pourbaix diagram can be used to plot these values, as indicated by the red dashed lines in (Figure 1). An estimate of the resulting corrosion products is determined to be right on the line between CuCl*3 Cu(OH)2, and Cu2O. However, the Pourbaix diagram serves only as an estimate, since it does not take into consideration corrosion rate which can be changed with voltage [23,33,34]. The pourbaix estimate can be confirmed through X-Ray Diffraction (XRD) and X-Ray Photoelectron Spectroscopy (XPS). Both methods can determine the Cu species present on the sample post-corrosion testing, however, XPS is able to more accurately measure the top-most atomic layers (~5nm depth) of the sample. Linear polarization (LP) and electrochemical impedance (EIS) corrosion tests can be performed using an electrochemical cell. LP measures corrosion rate and EIS measures impedance response at a fixed frequency [23].
Ion concentration can also be measured through an ion release assay using an inductively coupled plasma mass spectrometer (ICPMS). Corrosion results are comparable to efficacy of nanomaterial vs. conventional Cu, where an increase in corrosion rate or ion concentration in the environment indicates an increase in Cu ion release from the substrate [23]. Since Cu’s kill mechanism is through Cu ion release through contact with the surface, it follows that an increase in Cu ion release will be proportional to the material’s antimicrobial effectiveness. Measuring changes in corrosion and composition will allow for a better understanding of why nanomaterial Cu is more efficient in the contact killing of Influenza A Virus than conventional Cu and will aid future research in better understanding the contact killing mechanism.
Test Procedure
Materials
Cold Spray: Cold spray samples from the first paper, “Effectiveness of Nanomaterial Copper Cold Spray Surfaces on Inactivation of Influenza A Virus” [2], were used. The pure Cu cold spray coatings on aluminum substrates are approximately 0.05 mm thick. The nano copper (Eltron) was produced by spray drying and the conventional copper (Praxair Cu-159) through gas atomization. Due to the low mass of the nanoparticles, they are bound into agglomerates using conventional Cu as the binder and spray dried [35,36]. For more information on the materials and cold spray process parameters see reference 40. Cold spray samples are compared to bulk wrought pure Cu.
Heat Treated Cu: Worcester Polytechnic Institute (WPI) performed oxidation treatment on 99% Pure Bulk Cu, heated in a furnace at 250C for 2 hours. The furnace was then turned off and the samples were allowed to cool inside for 20 hours. Heat treatment (annealing) of bulk, conventional, and nanomaterial Cu surface was performed by Surface Combustion. Samples were cleaned using acetone and placed in a molybdenum lined, high temperature lab furnace. The chamber was evacuated with a vacuum pump and heated to 100F, then backfilled to 1atm nitrogen and heated to 400C for two hours. The samples were then cooled under nitrogen with an internal fan.
Corrosion Testing
Electrochemical Testing: A ParaCell Electrochemical Cell Kit by Gamry Instruments was used with 3% (weight) NaCl solution and a Murcury Chloride (G0115 LOT 2516) reference electrode. Figure 2 shows a detailed diagram of the test set-up; the Paracell Manual (988-00017) was used to set up the test. The corrosion cell is attached to the EC Lab software using electrical cables. The cable attachments are labeled in Figure 3. Corrosion test data is collected on EC Lab software for Electrochemical Impedance (EIS) and Linear Polarization (LP). Prior to running corrosion tests, open circuit voltage (OCV) is confirmed to reach steady state. The system inputs are listed in (Figure 4). Materials tested include: 1) As made: bulk Cu, conventional Cu cold spray, nanomaterial Cu cold spray, and bulk CuO,2) Annealed: bulk Cu, conventional Cu cold spray, nanomaterial Cu cold spray. For each test, the corrosion cell was washed with DI water before and after testing. Samples were sterilized in ethanol prior to testing. During testing 350mL of 3% (weight) NaCl solution was used. Corroded material samples were air dried and saved for further materials characterization.
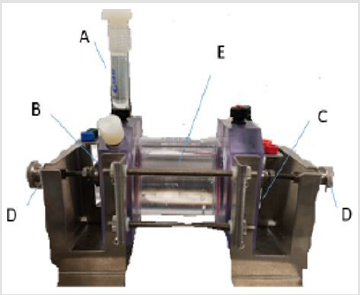
Figure 2: Diagram of corrosion cell including A) reference electrode in solid bridge filled with NaCl, B) Cu sample pressed between electrode (anode) plate and cell opening, C) Carbon pressed between electrode (cathode) plate and cell opening, D) clamps used to secure B+C, E) corrosion cell filled with NaCl Solution.
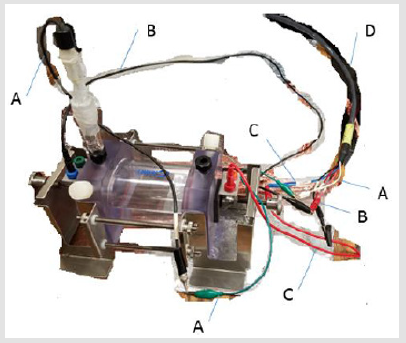
Figure 3: Corrosion Cell Attachment to EC Lab System includes A) Connection of Reference Electrode B) Connection of Anode, C) Connection of Cathode, D) Main line connecting to system.
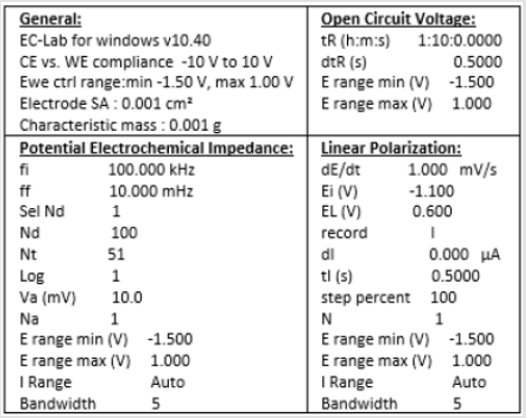
Figure 4: Inputs for Corrosion Testing.
The cold sprayed samples were not thick enough to polish to eliminate oxides affecting the EIS test. EIS testing was only performed for the non-heat treated (non-HT) samples. Data is collected and analyzed using EC Lab software. For EIS data, conventional and nanomaterial Cu cold spray samples were fitted to the equation: R1+R2/C2+Q1, which correspond to the diagram in Figure 5. The above diagram can be broken into three sections to consider what is happening in the electrolyte, at the electrolytemetal interface, and at the metal. For the electrolyte, the solution resistance between the reference and working electrode must be considered. At the electrolyte-metal interface, the charge transfer resistance from metal ions diffusing into the electrolyte and the double layer capacitance from ions in solution adsorbing onto the electrode surface are both considered. Since capacitors in EIS experiments often do not behave in an ideal manner due to various factors, including sample surface roughness, a constant phase element is added to account for the variation [37].
Bulk Cu samples were fitted to the equation: R1+R2/C2+R3/ C3+Q1, where R3/C3 accounts for the passivation effect, as indicated by the semi-circle present on the Bulk Cu line in (Figure 6). See the description in (Figure 5) for further definition/explanation of equation components. Magnifying the EIS data for Bulk Cu shows that there is a small semi-circle followed by the beginning of a much larger semi-circle, with the first one representing the passivation zone for the material and the second being the beginning of the Nyquist plot. An expanded view of a notional Nyquist plot can be seen in Figure 7. Where R1 and R2 correspond to solution resistance and charge transfer resistance, respectively. And Rp represents the polarization resistance of the material undergoing corrosion. The smaller the diameter or Rp value, the higher the corrosion rate of the material. Ohm’s law states that resistance is the ratio between voltage and current. Capacitance is the ratio between charge stored on the capacitor and electrical potential, making capacitance inversely proportional to resistance and directly proportional to corrosion rate [38-40]. For LP data, all samples fit to a graph of electron potential vs. current density, as seen in Figure 8. From the linear polarization plot the potential and current at the point of corrosion (Ecorr and Icorr), passivation (Epass and Ipass), and pitting (Epitt and Ipitt) can be determined. Where, Ecorr and Icorr are based on extrapolation of the slopes of the anode and cathode, as seen in the red box in (Figure 8) [23,41].
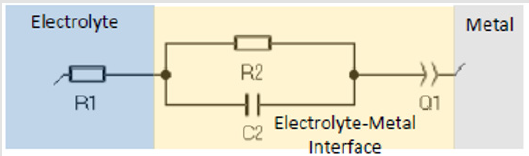
Figure 5: Equivalent Circuit for an Electrochemical Cell where R1 is solution resistance, R2 is charge transfer resistance, C2 is double layer capacitance, and Q1 is constant phase element [38].
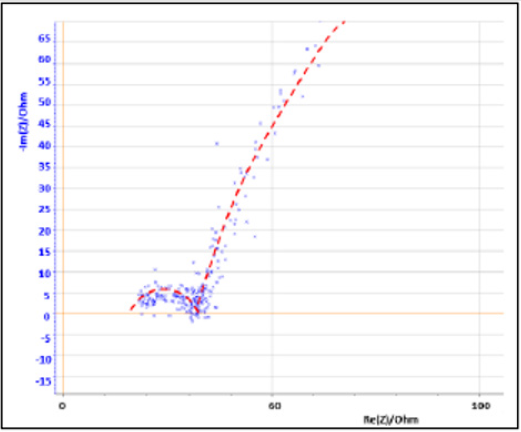
Figure 6: Magnified EIS data of Impedance vs. Resistance for Bulk Cu.
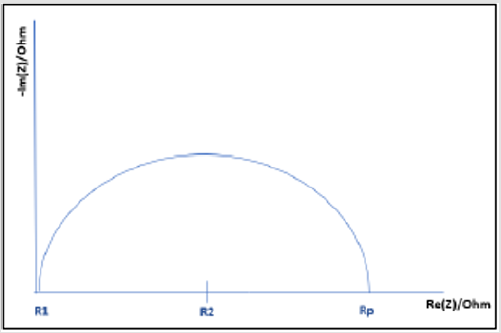
Figure 7: Nyquist Plot Diagram.
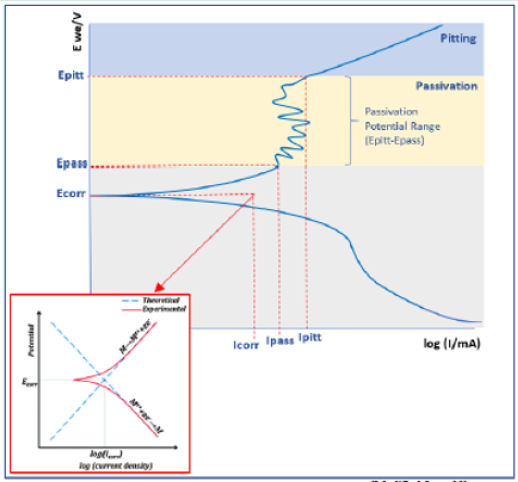
Figure 8: Linear Polarization Diagram [Modified from 33].
Cu Ion Release Assay: The release of soluble copper from cold sprayed samples was measured over 7 days. The release of copper ions (ppb) from Aluminum (Al), conventional Cu (CC) and nanomaterial Cu (nC) surfaces versus time (days) from 30min to 7 days, determined using inductively coupled plasma mass spectroscopy (ICP-MS) in samples diluted 100-fold in water. Points represent mean standard deviation of n=3 sample at a single time point; oneway ANOVA (p<0.05). Significance for copper release wasfound for nC samples between 1 hour and 7 days and for CC samples.
Composition + Microstructure Analysis
XRD: WPI’s PANalytical Empyrean X-ray Diffraction machine was used with a Cu tube and Ni filter from 20 to 140 2theta at 45Kv and 40Ma, with a ½ degree divergence slit, 1-degree antiscatter slit, 0.04 radian soller slit, and 10mm mask. Due to the thin Cu cold spray coating thickness (50um or less), the time per step was increased to 100 seconds per step. Prior to running, the depth was checked with a goniometer and a depth of 1 was confirmed. Results were collected and analyzed using Data Viewer and High Score Plus software. Results were compared against reference PDF4database, with PDFs 00-004-0836, 00-005-0061, 00-005- 0667 for Cu, CuO, and Cu2O, respectively. Data was collected for top-down measurement of the corroded area of the samples.
XPS: Due to the high amounts of carbon contamination, left by cutting fluids and corrosion testing, attempts were made to delicately clean the copper surfaces. Prior to analysis by XPS, all samples were sequentially sonicated in acetone then isopropanol for 5 minutes each. Cleaning with water and detergents was avoided as to not affect the surface chemistry being probed. A PHI5600 XPS system with a third-party data acquisition system (RBD Instruments, Bend Oregon) acquired all photoelectron spectra as detailed previously [42]. Analysis chamber base pressures were <1×10⁻⁹ Torr. A hemispherical energy analyzer that was positioned at 90° with respect to the incoming monochromated Al Kα X-ray flux and 45° with respect to standard sample positioningcollected the photoelectrons. Survey spectra utilized a 117 eV pass energy, a 0.5 eV step size, and a 50-ms-per-step dwell time. High-resolution XP spectra employed a 23.5 eV pass energy, 0.025 eV step size, and a 50 ms dwell time per step. Spectra were acquired for the Al 2s, Al 2p, C 1s, Cu 2p, N 1s, and O 1s photoelectron regions as well as the Cu LMM Auger region. Post-acquisition data fitting employed Shirley-style baselines to all spectra based on a qualitative visual assessment of baseline shape. For a given oxidation state, fits that employ multiple peaks within a spectral region utilized identical fwhm (full width and half max) values for each peak to minimize mathematically optimized but possibly chemically unrealistic fits [43]. All areas were fit with GL (30) pseudo-Voigt peak functions except for features in the Cu 2p region that employed GL (70) functions. Lastly, Cu 2p features ascribed to Cu0 and to Cu1+ utilized an asymmetric tail function.
Results and Discussion
Corrosion
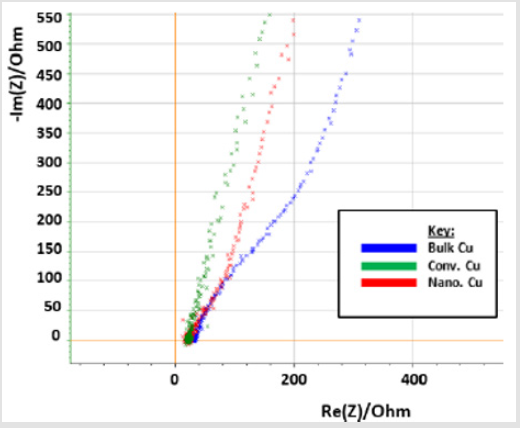
Figure 9: EIS Data in impedance vs. resistance.
EIS data, in (Figure 9), shows that nanomaterial Cu cold spray has a greater corrosion rate than that of conventional Cu cold spray. And that bulk Cu has a corrosion rate that is greater than both conventional and nanomaterial CuThe data is (Figure 9) is manifested as lines rather than semi-circles due to the presence of two overlapping time constants, derived from Cu’s multi-layered microstructure, where the top of the material is porous followed by a denser inner core. This results in three stages of corrosion: 1) the porous layer corrodes, 2) localized dissolution of Cu occurs creates pores in the denser layer, 3) oxidation occurs within those pores. Our micrographs (section 3.3) support this, showing the corroded samples to have localized pitting as indicated by the darker round spots on the micrographs [44]. EC Lab Software is able to find a line of best fit for each data set with values for charge transfer resistance (R2) and double layer capacitance (C2) in (Table 1). As resistance decreases there is an increase in capacitance, where capacitance is directly proportional to corrosion rate [38-40].
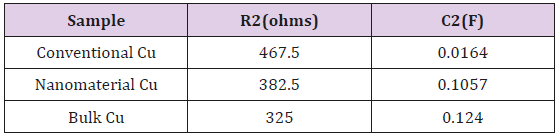
Table 1: EIS Data Outputs.
Bulk Cu has the lowest resistance and highest capacitance, followed by nanomaterial Cu and conventional Cu, respectively. LP data, in (Figure 10), supports EIS resultsAt first glance, the above data appears, with the exception of Bulk Cu as an outlier to the right (blue line on the graph). Upon further analysis, differences are seen between the samples as detailed in (Table 2). The Icorr, Ipass, and Ipitt values vary from highest to lowest with the sample order being: bulk Cu, nanomaterial Cu, conventional Cu, and heattreated samples. This supports the EIS data showing bulk Cu to be the least corrosion resistant, as it has the highest current density, and passivation values. It also has the lowest passivation potential range. Nanomaterial Cu also has a higher corrosion rate than conventional Cu, which is expected as the nanoparticles present in the coating provide a greater percentage of grain boundaries for ion diffusion [2]. Bulk Cu performed worse than nanomaterial Cu, in that it had a higher corrosion rate. This may be due to bulk Cu not being manufactured using cold spray technology, which provides denser coatings with minimal oxides and inclusions [2].
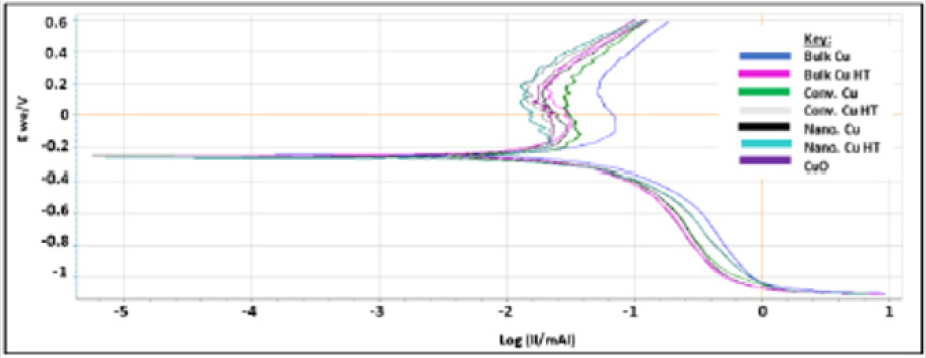
Figure 10: Linear Polarization Data.
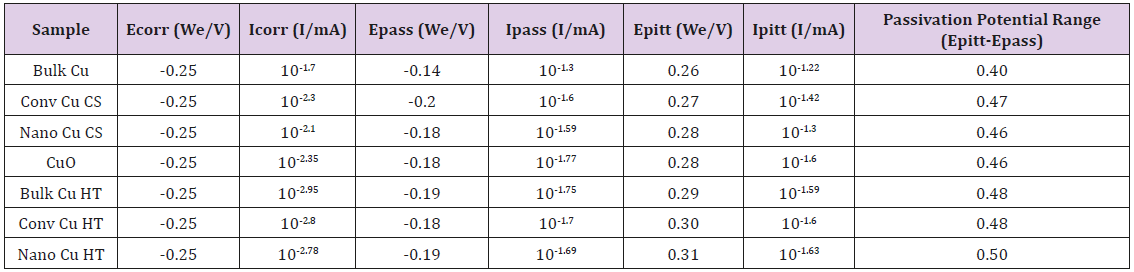
Table 2: Linear Polarization Data Analysis.
Microstructure and hardness analysis in the following section can confirm this. Additionally, it is possible that the nanomaterial Cu was able to form a passive layer more rapidly than that of bulk Cu, for which the Ipass values show this to be true [45]. Ion release assay data supports both EIS and LP test results, as seen in Figure 11. Results show Nanomaterial Cu to have greater ion concentration in solution than conventional Cu. The timepoint of greatest interest is the 2hour mark, as this is the timepoint used in the EPA approved efficacy protocol. While both Cu materials released significant (p<0.05) amounts of ions into solution over aluminum controls, nanomaterial Cu demonstrated greater cumulative ion release at all time points tested through 1 day, including at the 2-hour timepoint. Corrosion testing shows nanomaterial Cu to have a greater corrosion rate, and subsequently greater ion release than conventional Cu. This supports prior work done with nanomaterial Cu performing better than conventional Cu in the contact killing of Influenza A Virus [2]. The next section will look the differences in microstructure between the two coatings to further explain why nanomaterial Cu is able to have a faster ion release rate.
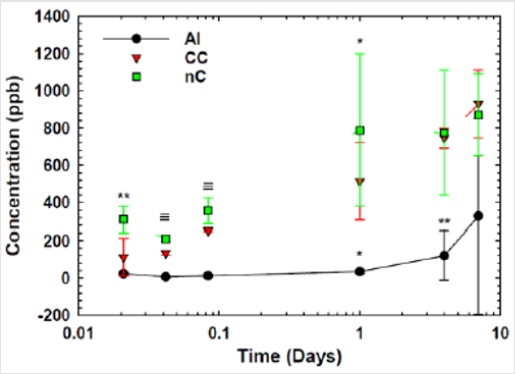
Figure 11: Cu Ion Release Assay for nanomaterial Cu (nC) and Conventional Cu (CC) with aluminum (Al) control.
Microstructure
Micrographs of top-down as made and corroded conventional, nanomaterial, and bulk Cu are in (Figure 12). Conventional Cu micrographs show larger grains compared to nanomaterial Cu. Both appear to have smaller, more defined grain structure as compared to bulk Cu. The corroded samples show pitting in the nanomaterial and bulk Cu samples, with the later having larger corroded areas. The heat-treated samples (see supplemental section A) show similar differences in microstructure and corrosion patterns. Cross-sections of the conventional, nanomaterial, and bulk Cu are show in Figure 13. The conventional Cu appears to have the largest grains, followed by bulk Cu, and then nanomaterial Cu. While nanomaterial Cu has the smallest grains, it also appears to have the most diverse distribution of grain size with grains ranging in nanometers to microns in size. This is characteristic of the powder production process where nanoparticles are spray dried into agglomerate structures using conventional Cu binder. Cold spray produces high density coatings with little to no oxides and inclusions [1]. Compared to the conventional and nanomaterial Cu cold spray coatings, bulk Cu shows much greater porosity. There is no visible corrosion in these micrographs, confirming that the electrochemical testing assayed only the near surface region. The heat-treated samples (supplemental section A) show similar differences on microstructure as the non-heat-treated samples. They also show no difference between as made and corroded samples.
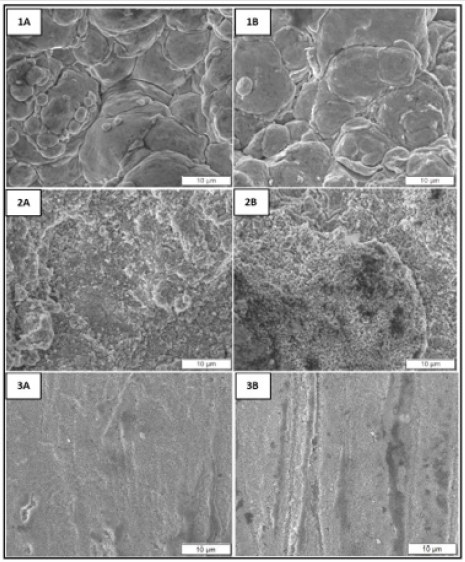
Figure 12: FE SEM top-down micrographs of as made (A) and corroded (B) conventional (1), nanomaterial (2), and bulk (3) Cu.
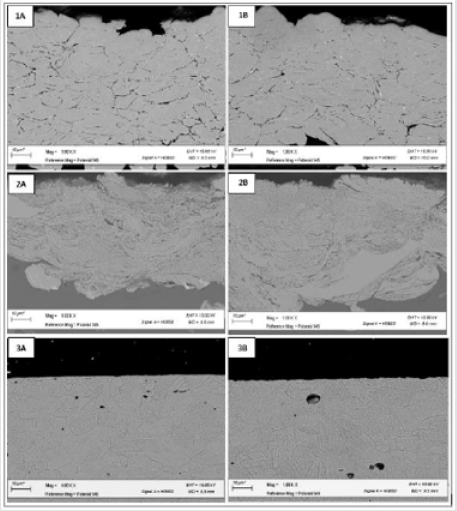
Figure 13: SEM cross-section micrographs of as made (A) and corroded (B) conventional (1), nanomaterial (2), and bulk (3) Cu.
Composition
EDS: See supplemental section B for top-down EDS data. All data shows that both as made and corroded samples have Cu and Oxygen present. Some samples have remnants of NaCl from the liquid used in the electrochemical cell during testing. For cross-sections, all results showed predominantly Cu with minimal oxygen content. No differentiation was able to be made between the corroded and non-corroded areas of the sample. This is most likely do to the fact that the electrochemical testing only affected the topmost atomic layers of the samples.
XRD: Diffraction peaks for all the corroded samples are seen in Figure 14. All peaks matched to Cu (pdf 00-004-0836) with the exception of the 1st peak, which matched to Cu2O (pdf 00-005-0667).
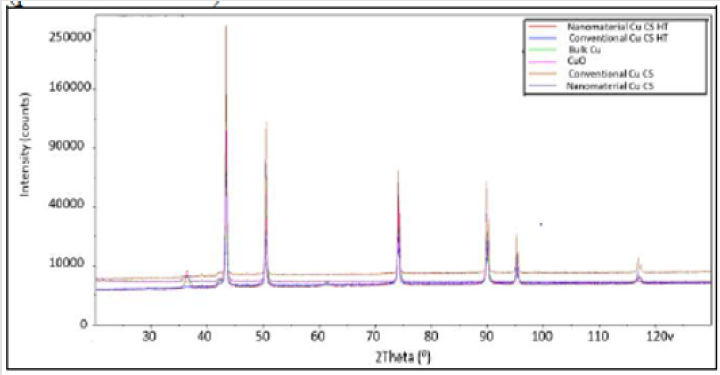
Figure 14: XRD of corroded samples.
XPS: XPS data for as made and corroded conventional, nanomaterial, and bulk Cu is in (Figure 15). The As made bulk Cu sample spectra was limited due to sample contamination. Figure 15 represents spectra for the Auger Cu LMM and XP Cu 2p regions for both conventional and nanomaterial copper surfaces. The photoelectron features ascribed to Cu0 and Cu1+ occur at overlapping binding energies, which necessitates the combination of Auger and photoelectron spectra to elucidate oxidation state information. For XP, Cu2+ dominates the photoelectron spectra for as made conventional copper, but Cu0 and Cu1+, dominate for all other samples. The Auger spectra deconvolve the contribution of Cu0 and Cu1+. The dashed lines in the Auger graphs represent peak energy locations of each oxidation state of copper in oxides. This shows all surfaces to be dominated by Cu1+ but contain significant quantities of Cu2+ rather than Cu0. For all corroded samples, it appears that there is a greater presence of Cu1+ vs. Cu2+ as compared to the noncorroded samples. The XP spectra for O shows strong presence of oxygen, as well as some Cu hydroxide, with greater amounts of the later in the corroded samples.
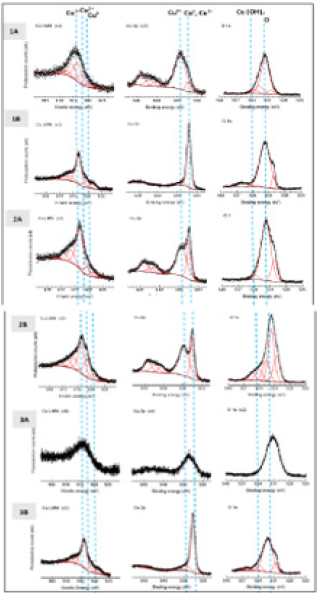
Figure 15: XPS from left to right: Auger electron spectra of the Cu LMM region, XP spectra of the Cu 2p3/2 region, XP spectra of O. For as made (1A) and corroded (1B) conventional Cu. For as made (2A) and corroded (2B) nanomaterial Cu. For as made (3A) and corroded (3B) bulk Cu. The dashed lines represent the location of each species.
XPD results for heat treated samples are in supplemental section C, with similar results to the above. The Cu LMM spectra of corroded and textured copper surfaces can contain many peaks which can make quantitative interpretation increasingly difficult. The auger spectra helped in the identification, but it was hard to get much more detail as there was a lot of carbon present on the samples. No attempt was made to sputter clean the samples as this may have reduced the copper on surface. Consequently, this contamination attenuates photoelectron signals from the underlying substrate causing the relevant peaks in the Cu LMM spectra to broaden and decrease overall resolution. Additionally, the nanoparticles can cause peak broadening in the sample which may decrease resolution. So, while comparison can be made between samples for the type of species present, comparison has not been made between the differences in intensity between the samples [46,47] XPS data provides interesting insight into the kind of Cu oxide species present, Cu20, and confirms pourbaix diagram predictions. It also raises the question of how Cu20 came to be the dominant species based on environmental factors and how the presence of different species may affect material antimicrobial properties. Follow-on work is needed to uncouple the effects of different Cu species on the contact killing of various microbes.
Conclusion
In conclusion,
1. Nanomaterial Cu has a higher corrosion rate than
conventional Cu.
2. Nanomaterial Cu has smaller grain size and consequently
greater percent grain boundaries than conventional Cu,
expected to lead to increased ion release which contributes to
increased corrosion rate.
3. Since the main antimicrobial mechanism of Cu is through
contact killing, it follows that increased ion release and
corrosion rate of nanomaterial Cu contributes directly to its
increased antimicrobial effectiveness in the contact killing of
Influenza A Virus as compared to conventional Cu [2].
4. XRD and XPS show sample composition to be of pure Cu
and Cu oxides, with XPS determining the dominant Cu oxide
present to be Cu20.
5. Follow-on work is needed to determine if the presence of
different oxide species varies Cu kill-rate.
6. Additional work should also be done to quantify the
energetics of nanomaterial versus conventional Cu cold
spray for grains, grain boundaries, and subsequent transport
phenomena.
Acknowledgement
A special thanks to WPI Department of Chemistry and Biochemistry for X-ray Photoelectron Spectroscopy testing. Thank you to Surface Combustion for the heat-treated samples and WPI’s Chemical Engineering Department for the Cu Ion Release Assay.
References
- Champagne V, Helfritch D (2013) A demonstration of the antimicrobial effectiveness of various copper surfaces. Journal of Biological Engineering 7(1): 8.
- Sundberg K, Champagne V, McNally B, Helfritch B, Sisson R, et al. (2015) Effectiveness of Nanomaterial Copper Cold Spray Surfaces on Inactivation of Influenza A Virus. J Biotechnology and Biomaterials 5(4).
- Callister W, Rethwisch D (2018) Materials Science and Engineering: An Introduction. 10th edn, United States: Wiley.
- Balasubramanian R, AC Rosenzweig (2008) Copper Methanobactin: A Molecule Whose Time has Come. Curr. Opin Chem Biol 12(2): 245-249.
- Casey AL, Adams D, Karpanen TJ, Lambert PA, Cookson BD, et al. (2010) Role of copper in reducing hospital environment contamination. J Hosp Infect 74(1): 72-77.
- Lee F, Wang D, Chen L, Kung C, Wu Y, et al. (2013) Antibacterial nanostructured composite films for biomedical applications: microstructural characteristics, biocompatibility, and antibacterial mechanisms. Biofouling 29(3): 295-305.
- Noyce JO, Michels H, Keevil CW (2007) Inactivation of influenza A virus on copper versus stainless steel surfaces. Appl Environ Microbiol 73(8): 2748-2750.
- Center for Disease Control Prevention. Electron Micrograph of Methicillin-Resistant Staphylococcus aureus (MRSA).
- Verran J, Boyd R (2000) The Relationship Between Substratum Surface Roughness and Microbiological and Organic Soiling: a Review. Biofouling 17(1): 59-71.
- Lemire J, Harrison J, Turner R (2013) Antimicrobial activity of metals: mechanisms, molecular targets and applications. Microbiology. 11(6): 371-384.
- Boone SA, Gerba CP (2007) Significance of fomites in the spread of respiratory and enteric viral disease. Appl Environ Microbiol 73: 1687-1696.
- Grass G, Rensing C, Solioz M (2011) Metallic Copper as an Antimicrobial Surface. Applied and Environmental Microbiology 77: 1541-1547.
- Espirito Santo C, N Taudte, DH Nies, G Grass (2008) Contribution of copper ion resistance to survival of Escherichia coli on metallic copper surfaces. Appl Environ Microbiol 74: 977-986.
- Varadwaj P, Varadwaj A, Jin B (2015) Ligand(s)-to-metal charge transfer as a factor controlling the equilibrium constants of late first-row transition metal complexes: revealing the Irving–Williams thermodynamical series. Phys Chem Chem Phys 17: 805-811.
- Johnson G, Cook W (1985) Fracture Characteristics of Three Metals Subjected to Various Strains, Strain Rates, Temperatures, and Pressures. EngineeringFracture Mechanics 21(1): 3148.
- Rapid reference to influenza. The influenza virus: structure and replication. Elsevier Ltd.
- Rizvi M, Akhoon S, Maqsood S (2013) Synergistic Effect of Perchlorate Ions and Acetonitrile Medium Explored for Extension in Copper Redoximetry. Journal of Analytical Chemistry 70(5): 633-638.
- Sundberg K, Sousa B, Schreiber J, Walde C, Sisson R, et al. Modeling Copper Cold Spray Single-Particle Impact for Optimized Antimicrobial Coatings. Journal TBD.
- Sundberg K, Wald C, Sousa B Microstructural Characterization of Conventional and Nanomaterial Copper Cold Spray Coatings. Journal TBD.
- Malik R, Burch D, Bazant M, Ceder G (2010) Particle Size Dependence of the Ionic Diffusivity.
- Sundberg K, Gleason M, Haddad B, Champagne V, Brown C, et al. (2019) The Effect of Nano-Scale Surface Roughness on Copper Cold Spray Inactivation of Influenza A Virus. Journal TBD.
- Carvalho M (2014) Corrosion of copper alloys in natural seawater: effects of hydrodynamics and pH. Analytical chemistry.
- Jones D (1996) Principles and Prevention of Corrosion. 2nd Prentice Hall, New Jersey, USA.
- Feng Y, Siow K, Teo W, Tan K, Hsieh A, et al. (1997) Corrosion Mechanisms and Products of Copper in Aqueous Solutions at Various pH Values. Corrosion 53: 389-398.
- (2019) Libre Texts, “Chemistry: Aqueous Solution of Salts” Department of Education. Accessed.
- Askeland D, Fulay P, Wright W (2011) The Science and Engineering of Materials. 6th Cengage Learning, United States.
- (2012) Principles of General Chemistry. Chapter 23: The d-Block Elements.
- Rizvi M (2015) Complexation Modulated Redox Behavior of Transition Metal Systems (Review). Russian Journal of General Chemistry. 85(4): 959-973
- Bott R, Bowmaker G, Davis C (1997) Crystal Structure of [Cu4(tu)7] (SO4)2].H2O and Vibrational Spectroscopic Studies of Some Copper(I) Thiourea Complexes Inorg Chem 37: 651-657
- Pereda Ayo B, Torre U, Josellian Gomez M (2013) Role of the different copper species on the activity of Cu/zeolite catalysts for SCR of NOx with NH3. Applied Catalysis B: Environmental 147(5): 420-428.
- Walkowicz M, (2018) Impact of oxidation of copper and its alloys in laboratory-simulated
- conditions on their antimicrobial efficiency. Corrosion Science 140(1): 321-332.
- Murthy P, Venugopalan V (2011) Antibiofilm Activity ofNano sized CuO. IEEE 580-583.
- Liptakova T, Ayman Alaskari, Pavol Fajnor, Alexander Dodek (2012) Assessment of Corrosion Behavior of Copper Pipelines System under Flowing Condition. International Conference on Computer Design and Engineering (ICCDE 2012) 49:24.
- Wang D, Xiang B, Liang Y, Song S, Liu C (2014) Corrosion control of copper in 3.5 wt.% NaCl Solution by Domperidone:Experimental and Theoretical Study. Corrosion Science 85: 77-86.
- Praxair: surface technologies. Powder Solutions: product brochure.
- Rolfe S (2014) email conversation and Phase I SBIR Final Report, Advanced Nanostructured Powders for Cold Spray Applications. Eltron Research and Development Inc 4600 Naytilus Court South Boulder, CO 80301-803241.
- (2019) Gamry Instruments. Basics of Electrochemical Impedance Spectroscopy. Access.
- Bard A, Faulkner L (2001) Electrochemical Methods: Fundamentals and Applications. United States: Wiley.
- Scully J, Silverman D, Kendig M (1993) Electrochemical Impedance: Analysis and Interpretation. Philadelphia: ASTM 37-53.
- Li W, Hu L, Zhang S, Hou B (2011) Effects of two fungicides on the corrosion resistance of copper in 3.5% NaCl solution under various conditions. Corrosion Science 53(2): 735-745.
- Ramachandran R, Nosonovsky M (2015) Coupling of surface energy with electric potential makes superhydrophobic surfaces corrosion-resistant. Phys Chem Chem Phys 17: 24988-24997.
- Carl AD, Kalan RE, Obayemi JD, Zebaze Kana MG, Soboyejo WO, et al. (2017) Synthesis and Characterization of Alkylamine-Functionalized Si (111) for Perovskite Adhesion with Minimal Interfacial Oxidation or Electronic Defects. ACS Appl Mater Interfaces 9(39): 34377-34388.
- Fairley N (2017) Peak Fitting in XPS.
- Silva F, Cinca N, Dosta S (2019) Corrosion resistance and antibacterial properties of copper coating deposited by cold gas spray. Surface and Coatings Technology 361: 292-301.
- Balyanov A, J Kutnyakovaa, NA Amirkhanovaa, VV Stolyarova, RZValiev, et al. (2004) Corrosion resistance of ultra-fine-grained Ti. Scripta Materialia 51: 225-229.
- Biesinger M (2017) Advanced analysis of copper X-ray photoelectron spectra. Surf Interface Anal 49: 1325-1334.
- Dabera G, Marc Walker, Ana M Sanchez, H Jessica Pereira, Richard Beanland, et al. (2017) Retarding oxidation of copper nanoparticles without electrical isolation and the size dependence of work function. Nature Communications 8: 1894.
