 Mini Review
Introduction
Research irreproducibility in published work has drawn increasing attention both in the research community and in the media [1]. Among the many contributing factors to research irreproducibility, a lack of adequate statistical rigor in research design and data analysis is one of the most important. Lowering the p-value threshold from the conventional 0.05 to 0.005 has been proposed to decrease the rate of false positives [2]. While using a uniform cutoff of 0.005 (as oppose to 0.05) will undoubtedly lower the false positive rate in general, it will also certainly increase the false negative rate. This may not be ideal, especially in the early exploratory phase of a study where potential leads warrant follow-ups. On the other hand, a p-value of 0.005 is not small enough for many situations. American Statistical Association has published its statement on p-values [3] with a recent editorial formally suggesting moving beyond “p<0.05” [4]. Similarly, some saying that the categorization of “statistical significance” should be abandoned [5].
A p-value is based on a significance test comparing two opposing hypotheses: a null hypothesis (H0) versus an alternative hypothesis (HA). Interpreting p-value may never have been very intuitive for clinical researchers insofar as a p-value does not provide the calibration that researchers care to know the most: the likelihood that a research hypothesis is true after analyzing the newly obtained data - the posterior probability - Pr(HA|Data) [6,7]. Instead, a p-value gives the probability of obtaining the observed data (or more extreme) assuming that the null hypothesis is true - Pr(- Data|H0). A typical procedure for hypothesis testing is as follows:
1) Based on pilot data or exploratory analysis on data from other studies, a research hypothesis (HA) is formed.
2) Using the negation of the research hypothesis, the null (opposite) hypothesis (H0) is set up.
3) Assuming the null hypothesis is true, the probability that the collected data (or data that are more extreme) can be obtained is calculated. This probability is the p-value.
4) Results are interpreted based the magnitude of a p-value. The smaller the p-value is, the more we are leaning toward rejecting the null hypothesis and in favor of the alternative hypothesis. Often a p-value of 0.05 is used as the significance threshold.
It is natural to think that a small p-value inevitably indicates that the null hypothesis is unlikely and that the research hypothesis is most likely true. This notion may well be a primary reason for the overwhelmingly wide usage of p-values. However, a small p-value does not necessarily mean that the research hypothesis is true given the obtained data. This posterior probability Pr(HA|Data) is also affected by two other factors: the prior probability that the research hypothesis is true Pr(HA) and the study power. It is because of these two factors that a p-value obtained from analyzing a set of data cannot always guarantee a certain probability of the research hypothesis being true. In fact, a p-value can only result in an incremental increase to the probability before the new data was collected and analyzed. For example, a study is designed to compare a normally distributed measure X between two groups (group E vs. C). The investigative research (alternative) hypothesis is that group E has a higher measure in X than group C (HA: μE>μC). Thus, the null hypothesis is that group E has an equal or lower measure in X than group C (H0: μE≤μC). Suppose that the study is designed with 80% power and that the prior probability of the research hypothesis being true is estimated at 50%. By Bayes rule, posterior probability:
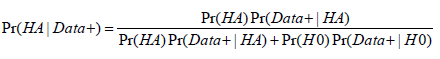 ,
,Data+ is observed data or more extreme data.
Replacing Pr(Data+|HA) with study power, a p-value of 0.05 will yield a posterior probability of 94% that the research hypothesis is true. But if justifications for such a relatively high prior on research hypothesis do not exist and the prior probability is estimated as “unlikely” e.g. at 1%, a p-value of 0.05 only yields a posterior probability of 14%. While 94% posterior probability on the research hypothesis is well above the level that most researchers may be willing to accept, 14% certainly is too low to be considered acceptable. Table 1 considers the study scenario discussed above and includes the p-values required for a posterior probability of 90% that the research hypothesis is true Pr(HA|Data) and certain nominal p-value thresholds along with their corresponding posterior probabilities (The study power is set to be 80%). It is not a surprise to see that vastly different p-values are required to have a >90% posterior probability for different priors from “perhaps likely” to “highly unlikely”. Interesting though, a nominal p-value of 10% of the prior probability for all categories always yields a posterior probability of 89% or higher. This provides us a general basis for determining the p-value cutoffs for either exploratory or confirmatory studies. Because small deviations of Pr(Data+|HA) (study power, in the above calculation) from 80% minimally affect the posterior probability of a research hypothesis, we propose that p-value threshold be set at 10% of the estimated prior probability (Table 1).
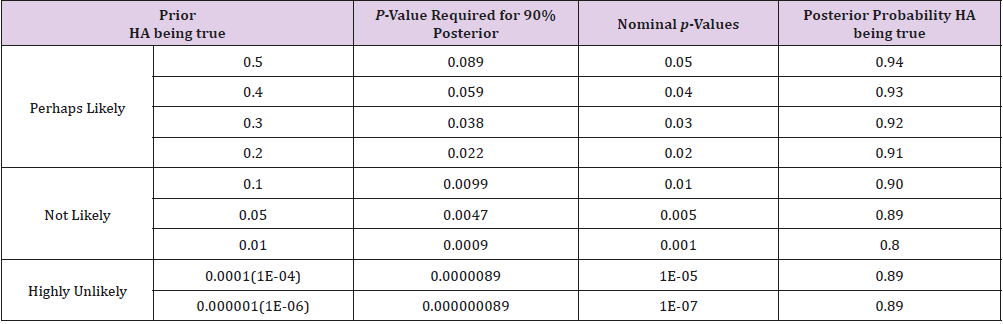
Table 1: The p-values required for a posterior probability of 90% that the research hypothesis is true Pr(HA|Data) and certain nominal p-value thresholds along with their corresponding posterior probabilities (The study power is set to be 80%).
It is also interesting to notice from Table 1, that the widely used 0.05 p-value cutoff requires a “perhaps likely” prior - about 40% or higher - for a 90% posterior probability that the research hypothesis is true. For tightly FDA-regulated clinical trial approval process, evidence supporting a research hypothesis accumulates over a series of investigations, from preclinical research, to phase I, II and III comparative studies. A p-value cutoff of 0.05 for phase III study is reasonable because a “perhaps likely” prior can be established from all the previous investigations. But this is hardly the case for most of the published studies where prior probability is not in the “perhaps likely” category. In some extreme cases, for example in genomic studies, the probability that a particular SNP is associated with a phenotype is only 1 in a million. In order to have a >90% posterior probability, a p-value of 1X10⁻⁷ is needed. Setting p-value threshold at 10% of the estimated prior probability yields a favorable 89% posterior probability or higher that the research hypothesis is true for studies with about 80% power or higher.
Although it may not be always straightforward to come up with a precise prior probability of the hypothesis being true before an experiment, reasonable estimates can be based on information collected before new data are collected and analyzed. The phase III clinical trial investigation is one example where a “perhaps likely” prior can be reliably reached. Other such examples include situations where either adequate reliable literature on the topic exists or convincing scientific reasoning indicates that degree of plausibility. In the situations where a “perhaps likely” prior cannot be reached, one has to assume a small prior probability and consequently a p-value less than 0.01, 0.005, 0.001, or even 0.0000001 are required for an acceptable (>89%) posterior probability, for priors of 10%, 5%, 1% or 0.0001% respectively. It should be emphasized that research hypothesis can only be proven through a process of accumulating evidence, each elevating the posterior probability until it finally approaches to 1. We believe that setting the p-value cutoff at 10% of the assumed prior probability will be a reasonable practice as long as the prior is specified with proper justifications before new data are collected and analyzed. This practice reflects the natural process of development and verification of a research hypothesis. It helps to prevent regarding results from a single p-value definitive.
References
- Baker M (2016) Is there a reproducibility crisis? Nature 533(7604): 452-454.
- Wasserstein R, Lazar N (2016) The ASA’s statement on p-values: Context, process, and purpose. The American Statistician 70(2): 129-133.
- Wasserstein R, Schirm A, Lazar N (2019) Moving to a world beyond “p<0.05”. The American Statistician 73(Sup1): 1-19.
- Amrhein V, Greenland S, McShane B (2019) Retire statistical significance. Nature 567(7748): 305-307.
- Windish DM, Huot SJ, Green ML (2007) Medical resident’s understanding of the biostatistics and results in the medical literature. JAMA 298(9): 1010-1017.
- Colquhoun D (2017) The reproducibility of research and the misinterpretation of p-values. Royal Society Open Science 4(12): 171085.
- Ioannidis JPA (2018) The proposal to lower p value thresholds to .005. JAMA 319(14): 1429-1430.
