 Research Article
Abstract
Infectious diseases are often related to climatic factors such as temperature and rainfall. In this paper, we use time series model to analyze the role of climatic factors on the epidemiology of infectious diseases transmission in Hong Kong. Specifically, we choose ARIMA (Autoregressive Integrated Moving Average) model along with climate factors measured by Hong Kong Observatory. The experiment results show that the model with climatic factors as input variables have better performance than the univariate model in which the infectious diseases depend only on past value. The best model for Hong Kong infectious diseases is obtained when the temperature and rainfall are added as input variables. Therefore, in Hong Kong, we can use past diseases and weather data to predict the future notifiable infectious disease. The predicted results can be used for hospitals to allocate the treatment resources efficiently.
Keyword: ARIMA; Infectious Disease; Climatic Factors
Abbreviations: ARIMA: Autoregressive Integrated Moving Average; ACF: Autocorrelation Function; PACF: Partial Autocorrelation Function; AR: Autoregressive; MA: Moving Average; AIC: Akaike’s Information Criterion; RMSE: Root Mean Square Error; CCF: Cross-Correlations Function
Introduction
Infectious diseases remain a main concern in the worldwide
since the epidemics may cause up to five million severe illness
and 500,000 deaths each year [1]. Many northern countries adopt
surveillance and vaccination to prevent prevails. However, many
countries in tropics underutilize the prevention strategy despite
the year round outbreaks [2]. The recent studies show that the
new sources of infectious disease mainly come from East and
Southeast Asia [3,4]. The various ways of transmission and scarce
surveillance data make the prevention of infectious diseases more
difficult. The infectious diseases in temperate areas always appear
in cold and dry climate [5,6]. In cold and dry weather, people may
prefer to crowd indoor which will definitely lead to higher risk of
contact virus transmission [7]. On the other hand, the cold and dry
weather is most favorable for virus transmission [8,9]. In addition
to humidity and temperature, the solar radiation has also been
considered in the virus transmission in the temperate climate [10].
However, the role of climate on the infectious diseases transmission
in the tropics attracts less attention. Several regions observe high
infectious disease transmission in the rainy seasons such as India,
Vietnam and Brazil [11-14]. While in areas such as Singapore,
Thailand and Philippines, the annual peaks of infectious diseases
do not coincide with the rainy seasons [11-14].
Lowen et al. [15] states that the contact transmission dominates
in the tropics [15], while Alonso et al. shows that temperature
and humidity contribute more to the virus spread than contact
transmission in Brail [16]. According to the above analysis, the
contributing factors to the infectious disease’s transmission are
region-depended due to different transmission pattern. With the
monthly scarce surveillance data, we choose to study infectious
diseases transmission in Hong Kong (22 °N). The objective of this
study is to investigate the effect of temperature and humidity on
infectious disease transmission pattern in Hong Kong. The model with best performance can be used to predict infectious diseases
outbreaks that can help develop vaccination strategy and allow the
hospitals to distribute the treatment resources efficiently.
Methods and Data
This study uses the monthly count of infectious diseases data
in Hong Kong. We obtain the infectious cases data between January
2003 and December 2018, from the monthly statistics published by
the Department of Health, Government of the Hong Kong Special
Administrative [17]. The climatic parameters are collected from the
Hong Kong Observatory with the same frequency and period [18].
We divide dataset into two:
(i) For fitting process, where the coefficients are estimated,
(ii) Forecasting process, where future values are calculated
using the predicted values, and the goodness of fit statistics will
typically be used in the model selection. Out of 204 observations
in Hong Kong infectious data, we used 156 points for fitting and
48 for prediction.
The infectious cases time series that we analyze in this study
is characterized by a strong autocorrelation, a property that
commonly violates the ordinary linear regression. Thus, in order
to account for the autocorrelation behavior, we employed a class
of time series technique ARIMA. We first developed a univariate
ARIMA model, where the response series depends only on its
past values and some random shocks, followed with multivariate
ARIMA with the environmental parameters as inputs. ARIMA is
based on the assumption that the response series is stationary,
that is the mean and variances of the series are independent of
time. Stationarity can be achieved by differencing the series or
transforming the variable so as to stabilize the variance or mean.
In our analysis we take the logarithmic transformation to reduce
the variances of the infectious time series, and subsequently
differenced the series until it is stationary. Once the response series
is stationary, we examine the ACF (Autocorrelation Function) and
PACF (Partial Autocorrelation Function) to determine the initial AR
(autoregressive) and MA (moving average) order. An ARIMA model
is notated as ARIMA (p, d, q), where p indicates the AR order, d the
differencing order and q the MA order. Based on the ACF and PACF
we fit several ARIMA models with varying AR and MA orders. In
the fitting process, the AR and MA coefficients are estimated using
conditional least square method.
The residuals are further inspected for autocorrelation through
ACF and PACF. Models with autocorrelated residuals are discarded,
else goodness of fit are examined through calculated AIC (Akaike’s
Information Criterion) and the RMSE (Root Mean Square Error).
The resulting model is subsequently used to forecast (1 step
ahead) the latest infectious season, and the associated RMSE are
calculated. Once we developed and selected a univariate ARIMA,
we investigate the effect of the environmental variables and the
corresponding lags on the infectious cases. The environmental
series are first prewhitened. In other words, we applied univariate
ARIMA modeling such that the environmental series no longer
characterized by autocorrelation. Subsequently, CCF (Cross-
Correlations Function) between the pre-whitened environmental
series and the infectious cases is then calculated so as to identify
the lags to be included in the model. Environmental variables that
do not exhibit significant cross-correlations with the infectious
cases are excluded from further analysis. Similar to univariate
ARIMA fitting process, we further estimate the coefficients of the
AR and MA terms as well as the lagged environmental variable. The
environmental input series are first included one at a time before
combining them together.
Results
In this paper, we employ a time series model ARIMA to analyze the infectious diseases transmission in Hong Kong during the past 17 years. In the first step, we need to stationarize the series of monthly infectious illness amounts in Hong Kong as shown in Figure 1. By taking the log transformation of the series to reduce the variance of the infectious cases, we can get the stationary series. Then ACF and PACF are used to identify the specific order of the series. Both ACF and PACF cut off at lag 2. Furthermore, we fit several univariate ARIMA models of different orders to exclude models with residual exhibiting autocorrelation. The results can be obtained in Table 1. As we can see in Table 1, for the fitted dataset, the ARIMA (2,1,2) get the best performance for the criteria of RMSE, while ARIMA (2,1,1) has the best predictive RMSE and lowest AIC. Among the two different univairate models, the difference AIC of two model is 5%, fit RMSE is 17%, the predictive RMSE is 9%. Since the fit RMSE gets the biggest difference and the other two are relatively smaller, we will choose the model ARIMA (2,1,2) as baseline model for further comparison. In the next step, we need put the environment factors into our model to examine if the performance can be better improved. We first examine the correlations between the infectious cases and environment series.
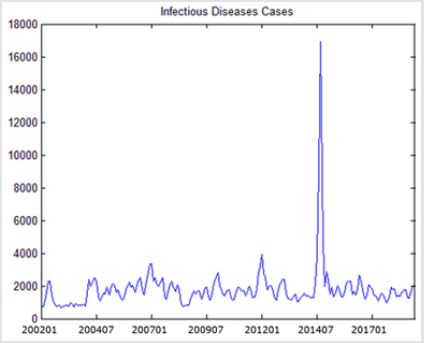
Figure 1: Infectious Diseases Cases.
The experiment results as showed in Table 2 confirm the significant correlations between infectious cases and temperature at lag 2, rainfall at lag 3. Then the multivariate ARIMA models are estimate with one or more environmental factors. The performance of these models is showed in Table 1. For these multi-variable models, the best fit RMSE is obtained from ARIMA (2,1,2) with temperature and rainfall. ARIMA (2,1,1) with temperature has the lowest AIC and ARIMA (2,1,1) with rainfall has the best prediction RMSE. Compared with these three models with the above three baseline univariate models, we can find that the models with environmental factors included enhance the fit RMSE by 8%, the AIC by 14% and the prediction RMSE by 11% from the baseline univariate models. Among the three best multivariate models, ARIMA (2,1,1) with rainfall has highest AIC. Thus, we exclude this model from our list. Between ARIMA (2,1,2) with both temperature and rainfall and ARIMA (2,1,1) with temperature, the difference of AIC is 3%, however, the difference of fit RMSE is 19%. So, we choose the ARIMX (2,1,2) model with temperature and rainfall as inputs as the best model.
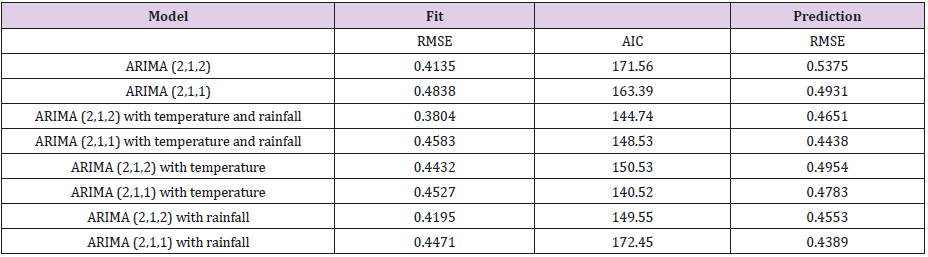
Table 1: Summary of model performance for ARIMA.
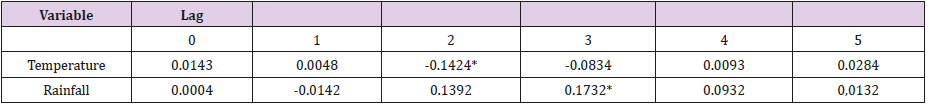
Table 2: Cross-correlation between infectious counts and environment series.
Discussion
In this study we investigate the relationship between infectious cases and climatic variables in the warm region Hong Kong. In the first part, we check if the univariate ARIMA can be applied to model the infectious cases with its own past values and random errors. We can find that the univariate ARIMA can forecast one-step ahead future infectious cases relatively well. The best univariate model is ARIMA (2,1,2) in which the infectious cases are depended on the cases in the past two months. In the multivariate ARIMA models, we find that the temperature and rainfall are significantly related to the infectious cases in Hong Kong. The relationship between rainfall and infectious diseases is observed in tropical countries in Singapore, Brail and Thailand [12-14]. There is any connection between with infectious transmission effectiveness, virus survivorship or host susceptibility. In common sense, rainfall may cause changes in the social activity which in turn promote the transmission of infectious disease. For example, in rainy days, people may prefer to stay indoors and thus promote the chance to contact with other people. The rainy season is between April and September in Hong Kong. Meanwhile, the infectious disease transmission peaks are typically around March and April, which is considered to be in the rainy season.
Temperature is always accompanied with infectious diseases such as in Tokyo [6]. Especially in the northern region, the infectious diseases peaks always coincide with winters. The prevailing dry and cold climate during winter seems to enhance infectious disease transmission, though this is not the same case in the tropics. Lowens st al find that low temperature (5°C) and small amount of rainfall environment is efficient for infectious diseases transmission. The high temperature (30°C) can block airborne transmission but not contact transmission, which explains the infectious diseases transmission in tropics. The first peak of infectious cases occurs during the winter, i.e. December and January. The normal mean temperature at this time is 16-20°C and the humidity is always low due to the rare rainfall. According to Lowens et al. [8], 20°C temperature combined with relative dry weather induces very high transmission. The winter climate will result in the paradise for the transmission of virus. Another infectious cases peak occurs during summer, when the temperature is relatively high and the normal value during this period is 26-28 °C. Note that the rainfall starts to increase at this period of each year and the humidity is relatively high. As a result, the high rainfall frequency will promote the risk of contact transmission at this time of each year. Thus, it seems that the second infectious diseases transmission is predominantly caused by the contact transmission.
In this paper we have demonstrated the application of climatic variables and the infectious cases data through a mathematical model to assess the effect of environmental factors on infectious diseases. We have shown the prediction capability of the models, as measured by the RMSE of prediction dataset (Table 1), to forecasts the next infectious diseases period. Presently we use the one step ahead to forecast the infectious cases in the next month. In reality this may only be possible for cities with more advanced computerbased surveillance systems such as New York City and Hong Kong. Most of the models developed depend on the past one to two weeks infectious cases. A more common way is to predict the infectious cases with more than one-step ahead forecasts. That is to say, the future forecasts are calculated with previously predicted number of cases instead of using the actual cases from the surveillance data (as in one-step ahead approach). However, one caveat to this approach is that more data is needed, since model selection will be based not only on the RMSE of the fitting dataset but also on the prediction dataset.
Conclusion
In this study, we combine the climatic parameters with the infectious disease cases through a time series model ARIMA. Through the comparison of several different models, we can conclude ARIMA (2,1,2) with temperature and rainfall included outperform other models and is the best model to predict the infectious diseases cases in the next period. Also, this model can approximately explain the two peaks of the infectious cases each year. Finally, the models in this study are a first step towards developing an early warning system for infectious diseases.
References
- (2009) World Health Organizations (WHO). Influenza (Seasonal).
- Wong CM, Yang L, Chan KP, Leung GM, Chan KH, et al. (2006) Influenzaassociated hospitalization in a subtropical city. PLoS Med 3(4): e121.
- Rambaut A, Pybus OG, Nelson MI, Viboud C, Taubenberger JK, et al. (2008) The genomic and epidemiological dynamics of human influenza A virus. Nature 453: 615-619.
- Russell CA, Jones TC, Barr IG, Cox NJ, Garten RJ, et al. (2008) Influenza vaccine strain selection and recent studies on the global migration of seasonal influenza viruses. Vaccine 26(4): D31-D34.
- Du Prel JB, Puppe W, Grondahl B, Knuf M, Weigl JA, et al. (2009) Are meteorological parameters associated with acute respiratory tract infections? Clin Infect Dis 49(6): 861-868.
- Urashima M, Shindo N, Okabe N (2003) A seasonal model to simulate influenza oscillation in Tokyo. Jpn J Infect Dis 56(2): 43-47.
- Lofgren E, Fefferman NH, Naumov YN, Gorski J, Naumova EN (2007) Influenza seasonality: underlying causes and modeling theories. J Virol 81: 5429-5436.
- Lowen AC, Mubareka S, Steel J, Palese P (2007) Influenza virus transmission is dependent on relative humidity. PLoS Pathogens 3: e151.
- Shaman J, Kohn M (2009) Absolute humidity modulates influenza survival, transmission, and seasonality. Proc Natl Acad Sci U S A 106(9): 3243-3248.
- Sagripanti JL, Lytle CD (2007) Inactivation of influenza virus by solar radiation. Photochem Photobiol 83(5): 1278-1282.
- Hampson AW (1999) Epidemiological data on influenza in Asian countries. Vaccine 17(1): S19-S23.
- Chew FT, Doraisingham S, Ling AE, Kumarasinghe G, Lee BW (1998) Seasonal trends of viral respiratory tract infections in the tropics. Epidemiol Infect 121(1): 121-128.
- Chumkiew S, Srisang W, Jaroensutasinee M, Jaroensutasinee K (2007) Climatic Factosr Affecting on Influenza Cases in Nakhon Si Thammarat. Proceedings of world academy of science, engineering and technology 21: 364-367.
- Moura FE, Perdigao AC, Siqueira MM (2009) Seasonality of influenza in the tropics: a distinct pattern in northeastern Brazil. Am J Trop Med Hyg 81(1): 180-183.
- Lowen AC, Steel J, Mubareka S, Palese P (2008) High Temperature (30°C) blocks aerosol but not contact transmission of influenza virus. Journal of Virology 82(11): 5650-5652.
- Alonso WJ, Viboud C, Simonsen L, Hirano EW, Daufenbach LZ, et al. (2007) Seasonality of influenza in Brazil: a traveling wave from the Amazon to the subtropics. Am J Epidemiol 165(12): 1434-1442.
- Hong Kong Department of Health Flu Express.
- Hong Kong Observatory Extract of Meteorological Observations for Hong Kong.
