 Research Article
Abstract
Honey has an outstanding history of human consumption as a natural food source which is made up of many substances including sugars, water, traces of organic acids, minerals, proteins, ashes, enzymes, amino acids, vitamins, phenol compounds, pollen and wax. The quality standard and freshness of honey is represented by its diastase value of range between three and eight in relation to Codex standard. To this end, this study evaluated the physicochemical properties and mineral elements of sixteen (16) honey samples produced in Guinea Savannah zones of Nigeria between March 2017 and September 2018. Honey samples were randomly collected from four (4) locations in Guinea Savannah zones namely: Benue (Naka), Kaduna (Zangokataf), Niger (Gbako) and Taraba (Sardauna). Physicochemical and mineral parameters such as Hydroxymethylfurfural (HMF), Total acids, free and lactones acids, Optical density, Specific Gravity (SG), Moisture content, Ash, Mineral elements, Total carbohydrates, Total solid, Total energy, Protein and pH, were determined... The results obtained were within the international standard limit. HMF ranged from 32.27 mg/kg in Niger to 44.57 mg/kg in Taraba. The moisture content varied from 11.13% in Benue to 16.16% in Taraba; Ash content varied from 0.67% in Kaduna and Niger to 0.68% in Benue and Taraba, States. The Total solid varied from 83.82% in Taraba to 88.83% in Benue; Total carbohydrate ranged from 98. 91% in Benue to 98.98% in Kaduna State. Also, Total energy varied from 1668.70 kj in Kaduna to 1669.53kj in Taraba. The mineral elements recorded among honey samples in the zones showed that Potassium (K) was the dominant mineral in the study and varied from 32.53mg/l in Niger to 81.88 mg/l in Kaduna; Sodium (Na) varied from 13.38mg/l in Benue to 22.22 mg/l in Niger. There was presence of trace minerals including Nickel, Copper, Cadmium and Lead, in all the studied honeys, an indication of environmental pollution. The honeys having total soluble dissolved solids of range 83.82 % in Taraba and 88.83 % in Benue can be rated grade A and B in relation to USDA index. In addition, the studied honeys met the Codex Alimentarius and European Union honey quality standards and can be explored for export as international commodity
Keywords: Physicochemical Properties; Proximate Analysis; Nutritional Quality; Honey
Introduction
Honey is a viscous natural sweet substance produced by honeybees from the nectars of plant flowers or from secretions of living parts of plants or excretions of plant sucking insects on the living parts of plants, which honeybees collect, transform and combine with specific substances of their own, store and leave in the honeycomb to ripen and mature [1]. A fundamental factor that influences the commercial value of honey includes botanical and floral origin, season, treatment of beekeeper and environmental factors [2,3].Honey has an outstanding history of human consumption as a natural food source used in various food preparations including alcoholic and non-alcoholic beverages and confectionaries as sweeteners and flavoring agents [4].
Honey is composed of many substances including sugars, water, traces of organic acids, minerals, proteins, ashes, enzymes, Amino acids, vitamins, phenol compounds, pollen and wax [5]. Sugars account for 90–95% of the dry weight of honey [6,7]. Fructose and glucose are the main honey sugar content. The sum of fructose and glucose, glycemic index or fructose/glucose (F/G) ratio and glucose/ water (G/W) ratio are essential factors that related to honey quality. F/G ratio indicates the ability of honey to crystallize [2,8]. Moisture content of honey is an important factor for consideration for stability, storage and exportability against fermentation and granulation. The low moisture content of less than 18% confers on honey longer period of preservation and against microbial activities [3,9,10]. Organic acids, a side product of enzymatic digestion in the honey stomach of the bee, give honey its characteristic flavor and an acidic pH [8,9]. The pH of honey ranges from 3.42 to 6.10 [9- 11]. There are few trace elements in honey; potassium is the most abundant macro mineral [10,12]. Raw honey contains enzymes which are useful in medical application and essentially includes invertase, phosphatese, catalase and glucose oxidase, an enzyme which combines with water to produce hydrogen peroxide, an antiseptic which prevents microbial infections and aid wound healing (Khalil, et al., 2010). The enzyme activity in bee honey is an important criterion for determining its quality
The quality standard and freshness of honey is represented by its diastase value which is within the range of three to eight [13]. Similarly, hydroxymethylfurfural (HMF) content in bee honey gives an indication of the degree of freshness, overheating at extraction or adulteration with commercial invert syrup (Gomes, et al., 2010; Leticia, et al., 2013). Codex Alimentarius (Alinorm 01/25 2000) established that the HMF, content of honey after processing or blending must not be higher than 80mg/kg, while the European Union (EU Directive 110/2001), recommends a lower limit of 40mg/kg with the exceptions that 80mg/kg is allowed for honey that originates from countries or regions with Tropical temperature, while a lower limit at only 15mg/kg is allowed for honey with low enzymatic levels. Honey is produced in a commercial quantity in the Guinea Savannah zones of Nigeria; but there have not been a scientific document that compares the quality with those prescribed in Codex Alimentarius and European standards. This study, therefore, is aimed at evaluating the physicochemical properties and mineral elements of honeys produced in the Guinea Savannah zones of Nigeria, with a view of comparing the quality with the Codex Alimentarius and European Standards honeys produced by honeybees.
Materials and Methods
Honey Samples Collection
A total of sixteen (16) honey samples that were traditionally processed were randomly collected from four (4) different markets in Guinea Savannah zones namely: Benue (Naka), Kaduna (Zangokataf), Niger (Gbako) and Taraba (Sardauna). Two liters (2L) of four (4) honey samples were collected per commercial market (n = 4). Particles of wax, dead bees, combs and other dirt in the honey samples were removed by straining through sieve. The honey samples were stored, preserved, protected from heat and light to avoid deterioration of enzymes, Hydroxymethylfurfural (HMF), viscosity and moisture content [3]. These samples were used for the laboratory analyses.
Duration of the Study
The study was carried out between March 2017 and September 2018 with first nursing of beehives for one year. Thereafter, the maturation of the bee honey and honeycombs were harvested and further processed.
Moisture Content
The water content of honey sample was determined by hot airdried oven method (A.OA.C, 1990). Determination was in triplicate for each sample. Clean and dried crucibles were weighed empty (Wo g) using aeAdam, analytical weighing balance, model N17250. Two grams (2g) of honey sample was pipetted into the empty porcelain crucible and were weighed (W1g). Thereafter, the set up were put in the oven, Genlab, hot air oven, model MINO/50, and the temperature of the oven was set at 100 oC and was switched on. Crucible and content were heated for two (2) hours. Afterwards, crucibles and content were transferred to a desiccator containing desiccant (Silica gel), where heated honey samples and crucibles cool and maintained dryness for forty-five (45) minutes. Thereafter, crucibles and contents were weighed. Repeated heating and weighing of crucible and content was performed till a constant weight was obtained (W2g). The Moisture Content of honey samples were obtained from the relation of loss in weight of sample (g), upon weight of sample (g), multiplied by one hundred (%).
Ash Content of Honey
The ash content of honey was determined according to the Furnace ash method (A.O.A.C, 1990). Determination was in triplicate of each sample. Gallenkamp electric Muffle Furnace, model 3, was used for the ash content. Analytical weighing balance “aeAdam”, model N17250; was used for weighing. Clean and dried crucibles were weighed empty (Wo g). Ten grams (10g) of honey samples were pipetted into the empty porcelain crucibles and were weighed (W1g). The crucible and content were preheated on a gas flame to darkness/charred, to avoid foaming. Thereafter, the preheated crucible and content were ashed (oxidize organic matter) in an electric muffle furnace at a temperature of 550 oC, for five (5) hours. The obtained ash was allowed to cool in desiccators for forty five(45) minutes, after which the weight of crucible and ash content were determined (W2g).The ash content of honey was calculated from the ratio of weight of ash to sample weight multiplied by one hundred.
Total Solids of Honey
This was the difference of moisture content of honey sample
from 100. Total solids of honey sample were calculated from the
expression:
% Total Solids = 100 % moisture Content.
Fat Content of Honey
The lipid content of honey samples was determined according to the Soxhlet method of extraction (A.O.A.C, 1990). Continuous liquid-liquid extraction apparatus (Soxhlet), where diethyl ether, was the extracting organic solvent, was used. Parameters were determined in triplicates of each sample. Distillation/Product receiving flask was weighed empty (W0g). Five (5) grams of honey sample was weighed with the analytical weighing balance, aeAdam, model N 17250.The honey was dissolved in ten (10) milliliter of distilled water(aqueous phase) in a 100 milliliter beaker. The honey mixture (aqueous phase) was introduced into the extractor flask of Soxhlet equipment, and the flask was filled with diethyl ether. The ether was heated to reflux in the product receiving flask, and the vapour was liquefied in the water-cooled condenser. The ether in the product (fat) flask was evaporated using Clifton thermo stated water bath, of serial number 98024.The flask and content was dried in the hot air oven at 60 oC, for one hour; afterwards, were allowed to cool in the desiccators. Then, the dried flask and content were weighed (W1g).Fat content of honey was calculated from the ratio of the difference between W1 –W0 to sample weight multiply by one hundred.
Total Protein Content of Honey
Protein content of honey was determined by the method of Kjeldahl (A.O.A.C, 1990). Parameters were determined in triplicates of each sample. Ten (10) grams of honey was weighed using analytical balance, aeAdam, model N17250, and the honey was introduced into micro-Kjedahl digestion flask, followed with the addition of twenty milliliter (20ml) concentrated sulphuric acid (H2SO4), which transformed organic nitrogen to mineral nitrogen (NH4)2SO4, in presence of ten gram added mixed catalyst (mixture of 9grams of potassium sulphate plus 15grams of copper sulphate). The setup was subjected to two processes i.e. digestion and distillation. The resulting solution was distilled after adding 30ml of 40% sodium hydroxide solution, and the distillate was collected in a flask with 40% boric acid and mixed indicator. The mixture was titrated with a standard solution of 0.01MHCL. The crude protein content was calculated using the conversion factor of 6.25 (i.e. N X 6.25).
Total Carbohydrate Content of Honey
Total carbohydrate of honey sample was obtained by difference from 100 of the sum of % Ash, Protein and Lipid, according to [14]. Total carbohydrate of honey was calculated from the expression: Total Carbohydrate of honey = 100 % (AshProtein Lipid).
pH of Honey Samples
pH of honey samples was measured using glass electrode pH meter method (A.O.A.C, 1990). Analysis was carried out in triplicate of each sample. Ten grams (10 g) of honey sample was weighed into 100ml glass beaker with the aid of aeAdam analytical balance, model N17250.A solution of the honey sample was made with the addition of 75ml of carbon dioxide free distilled water (prepared by boiling the distilled water for 20 minutes and allowed to cool at room temperature).Next, was the calibration of Hanna pH meter, model HI22I4, with buffer solutions of 4.01, 7.0 and 10.9 to ensure linearity of the meter. Afterwards, the pH values of the honey samples were measured accordingly.
Acidity (Free, Lactone and Total) of Honey Samples
Acidity of honey sample was determined according to potentiometric titration method (A.OA.C, 1990). Parameters were assayed in triplicates of each sample. Free, Lactones and Total acidity were measured by titration method using a solution containing 10grams (weighed with aeAdam analytical balance model N17250), of honey sample dissolved in 75ml of carbon dioxide free distilled water (prepared by boiling the distilled water for 20minutes and allowed it to cool at room temperature),in a 250ml glass beaker. The honey solution was titrated with 0.05M NaOH solution from 50ml glass burette at the rate of 5.0ml minute-1. Immediately the pH meter read 8.50 (Free acidity); the addition of 0.05M NaOH solution was stopped and the volume of consumed 0.05M NaOH solution recorded. Excess 10ml of 0.05M NaOH solution was immediately added and without delay was back titrated with 0.05M HCL solution from ten milliliter (10ml) glass burette to a pH of 8.30(Lactones acid) and the volume of consumed 0.05M HCL solution recorded. The blank sample was also treated as the sample. Total acidity of the honey sample was determined by adding Free acidity and Lactones acidity. The result was expressed in mEq/kg.
Optical Density (O.D.) of Honey Samples
Honey colour intensity otherwise known as Optical Density (O.D) was measured using the UV-Visible Spectrophotometer method. Measurement was in triplicates of each sample. Ten gram (10g) of honey sample was weighed, into a 250ml beaker, using aeAdam analytical balance model N17250. The honey was diluted to 100ml with distilled water. The resulting honey solution was transferred into plastic centrifuge tube and the set up was put in centrifuge bucket (Centurion Scientific Refrigerated Centrifuge, K3 Series, and Model K24IR), and spun for 10 minutes at 3000rpm. Thereafter, the absorbance and transmission of the supernatant filtrate was measured at 530 nm, against distilled water as blank using UV-Visible Spectrophotometer (T60 UV-Visible Spectrophotometer, PG Instrument, model T60U) [15].
Density/Specific Gravity of Honey Samples
The Specific Gravity (S.G.), of honey samples was determined as the ratio of the weight of sample to that of equal volume of water. Determination was carried out in triplicates of each sample. Weight of weighing bottle was determined empty (Wo g), using aeAdam analytical weighing balance model N17250. Five grams (5g) of honey sample was introduced into the weighing bottle and were weighed (W1g).Thereafter, five centimeter cube (5 cm3) of distilled water was pipetted into weighing bottle and the set up were weighed on aeAdam analytical balance model N17250 (W2g).The Specific Gravity (S.G.), of honey was calculated from the expression of ratio of weight of sample to weight of equal volume of water.
Hydroxmetylfurfural (HMF), of Honey Samples
5- Hydroxmethylfurfural (HMF), of honey samples were determined by Spectrophotometric method as described by A.O.A.C (1990). Analysis was carried out in triplicates of each sample. Two (2) test tubes were labeled; one sample solution and the other reference solution. Five milliliter (5ml) of filtrate was pipetted into each test tube. To sample solution tube, 5ml of distilled water was added, and to the reference tube, 5ml of 0.20% of Sodium bisulphate solution was added. The content of each test tube was mixed by inversion, and the absorbance of sample solution was read against the reference solution at A285nm and A335nm in a 10mm quartz cell within one hour, using T60 UV-Visible Spectrophotometer, model T60U, PG Instrument. When the absorbance of sample solution read 0.6nm, the sample should be diluted and the assay repeated till a lower absorbance was obtained. The value of HMF, was expressed in mg/kg, and was calculated from the relation: the difference between sample absorbance at 285nm and 335nm multiply by 147.7 and weight of sample and final dilution factor.
Hydroxmethylfurfural (mg/kg) of honey sample = (A285nm A335nm)X149.7X 5X D/W
Analysis of Mineral Element of Honey Samples
Honey samples were analyzed for mineral elements according to A.O.A.C (1990). Analysis was carried out in triplicates of each sample. Ten grams (10 g) of honey sample was weighed into a clean and dried empty porcelain crucible, using aeAdam analytical balance model N17250. Then, crucible and content were preheated on a gas flame to darkness/charred, to avoid foaming. Thereafter, the preheated crucible and content were ashed (oxidize organic matter) in Gallenkamp electric muffle furnace, model 3, at a temperature of 525 oC, for five (5) hours. Thereafter, the crucible and ash were allowed to cool. Afterwards, the calcined ash of honey was transferred into 100ml standard volumetric flask and was dissolved and diluted to mark with 2M HCL solution. The solution was used to determine mineral elements: Magnesium (Mg), Iron (Fe), Calcium (Ca), Manganese (Mn), Cadmium (Cd), Nickel (Ni), Copper (Cu), Lead (Pb), using Atomic Absorption Spectrophotometer, PG-990F, model 990F. Potassium (K), and Sodium (Na), contents were assayed using Jenway Flame photometer, model PFP7, UK; while phosphorus (P) was determined by Colorimetric method of Ammonium monovanadate and molybdate, at wavelength of 400nm, using T60 UV-Visible Spectrophotometer, model T60U, PG Instrument.
Statistical Analysis
Each parameter analyzed was done in triplicates. The data were subjected to statistical analyses to verify and evaluate the differences between chemical compositions of honey samples investigated. The data were expressed as mean and standard deviation (n=16) where “n” represents the number of samples. Comparison of means was analyzed using one-way analysis of variances (ANOVA) on a statistical programmed (Statistical Package for Social Sciences SPSS) version 16.0. The difference was considered significant at P ˂ 0.05.
Result
The results were as shown in Tables 1- 5 respectively for Physicochemical properties, Proximate analysis, Macro and Micronutrient elements, Correlation coefficient matrix of nutrient elements quality variables and correlation coefficient matrix of chemical quality variables of the investigated honey samples.
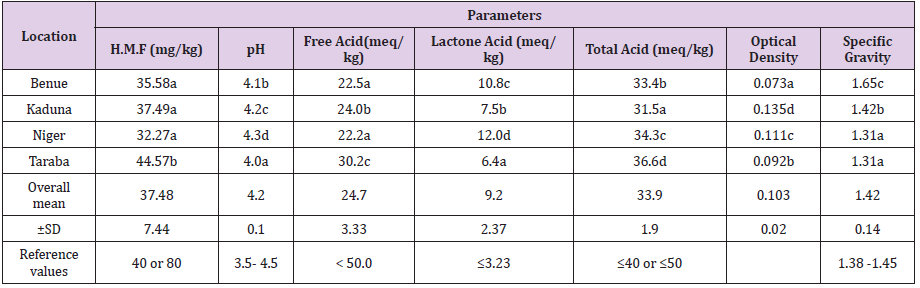
Table 1: Physicochemical properties of honeys of Guinea Savannah Vegetation Zones of Nigeria.
a) a ˗ d Mean in the same column with different superscript differ significantly (P<0.05)
b) ±SD ═ Standard Deviation, • Values are means of three (3) Determinations
c) Reference values ═ Codex Alimentarius (2001); European and Brazilian Honey Regulatory Commission (2000); United State
Department of Agriculture for Honey Grading (USDA 1985).
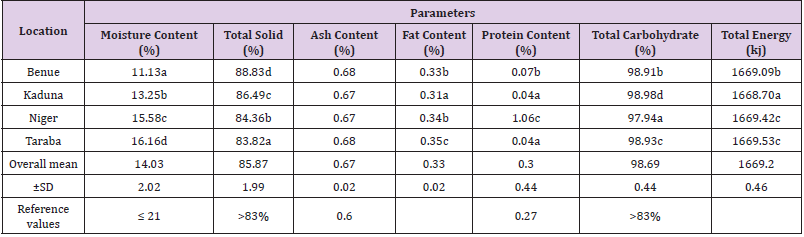
Table 2: Proximate Profile of honeys of Guinea Savannah Vegetation Zone of Nigeria.
Note:
a) a ˗ d Mean in the same column with different superscript differ significantly (P<0.05)
b) ±SD ═ Standard Deviation, • Values are means of three (3) Determinations
c) Reference values ═ Codex Alimentarius (2001); European and Brazilian Honey Regulatory Commission (2000); United State Department
of Agriculture for Honey Grading (USDA 1985 and 1962).
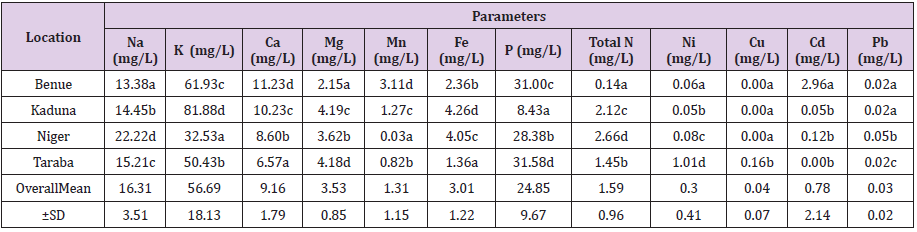
Table 3: Macro and Micronutrient Elements Of honeys of Guinea Savannah Vegetation Zone of Nigeria.
Note:
a) a ˗ d Mean in the same column with different superscript differ significantly (P<0.05)
b) ±SD ═ Standard Deviation, • Values are means of three (3) Determination.
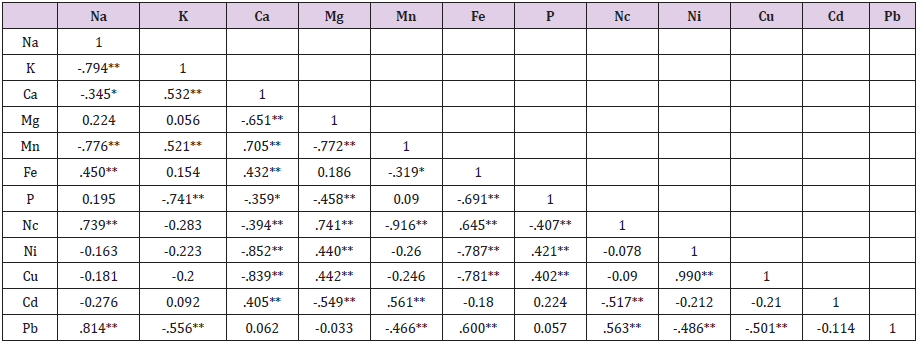
Table 4: Correlation coefficient matrix of Nutrient element quality variables.
Note:
a) **. Correlation is significant at the 0.01 level (2-tailed).
b) *. Correlation is significant at the 0.05 level (2-tailed).
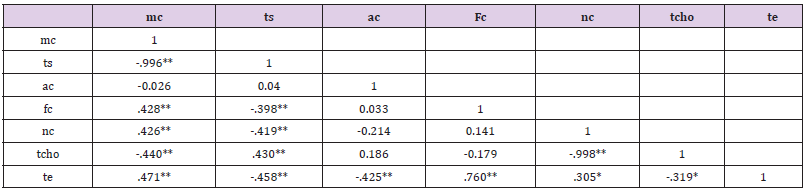
Table 5: Correlation coefficient matrix of Chemical quality variables.
Note:
a) **. Correlation is significant at the 0.01 level (2-tailed).
b) *. Correlation is significant at the 0.05 level (2-tailed).
c) Key: Moisture Content mc, Total Solid ts, Ash Content ac, Fibre Content fc, Nitrogen Content Nc,
Total Carbohydrate tcho, Total Energy te.
Physicochemical Analysis
The mean values of physicochemical characteristics of the
studied honey samples were presented in Table 1. There were
significant variations (P<0.05) among the mean values of all the
parameters of investigated honey samples at the four locations in
the Guinea Savanna zones of Nigeria. Also, significant differences
(P < 0.05) in HMF contents were observed between the analyzed
samples. Taraba sample showed significantly (P <0.05) higher
HMF content (44.57mg/kg) when compared with samples from
Benue, Kaduna and Niger. There was no significant difference (P
>0.05) between the HMF samples of Benue, Kaduna and Niger.
Similarly, there were statistical differences (P <0.05) between the
pH values of tested honey samples. Niger sample is statistically
(P<0.05) higher in pH value (4.3) when compared with the pH
values obtained in Benue (4.1), Kaduna (4.2) and Taraba (4.0)
samples. Taraba sample showed significantly (P<0.05) higher free
and total acid contents (30.2meq/kg; 36.6meq/kg) among Kaduna
(24.0meq/kg;31.5meq/kg), Benue (22.5meq/kg; 33.4meq/kg) and
Niger (22.2meq/kg; 34.3meq/kg) respectively.
However, the mean range and overall mean of the physicochemical
profile of the studied honeys are as stated; Hydroxymethylfurfural
(HMF): 32.27 – 44.57mg/kg, 37.48±7.44mg/kg; pH: 4.0- 4.3,
4.2±0.10; Free Acid: 22.2 – 30.2meq/kg, 24.7±3.33meq/kg;
Lactones Acid; 6.4 – 12.0meq/kg, 9.2±2.37meq/kg; Total Acid:
31.5 – 36.6meq/kg, 33.9±1.90meq/kg; Optical Density: 0.073 –
0.135, 0.103±0.02; S.G:1.31 -1.65, 1.42±0.14. These honey samples
recordedhigher mean values as follows: Taraba; HMF: 44.57mg/
kg; Free acid: 30.2meq/kg; Total acid:36.6meq/kg; Niger: pH:4.3;
Lactones Acid: 12.0 meq/kg; Kaduna: Optical Density: 0.135;
Benue: Specific Gravity: 1.65while, the lowest mean values was
obtained as follows: Niger: HMF: 32.27 mg/kg: Free Acid:22.2 meq/
kg; Specific Gravity: 1.31; Taraba: pH: 4.0; Lactones Acid: 6.4 meq/
kg; Specific Gravity: 1.31.
Proximate Analysis
In Table 2, the mean values of the proximate analysis of the investigated honey samples from different locations are presented. There is a statistical significance (P<0.05) among the mean values of parameters assayed except that of ash content. This could be attributed to the nature of soil on which the plant bearing nectar grew. Taraba sample showed significantly (P< 0.05) higher moisture content (16.16%) when compared with samples from Niger (15.58%), Kaduna (13.25%) and Benue (11.13%). Also, Niger sample showed significantly difference (P<0.05) in moisture content (15.58%) from Kaduna (13.25%) and Benue (11.13%) samples. Significant differences (P <0.05) in total solid content were observed among the samples. Benue sample showed significantly (P<0.05) higher total solid content (88.83%) when compared with Kaduna (86.49%), Niger (84.36%) and Taraba (83.82%) samples, while Niger total solid content(84.36%) is significantly different(P<0.05) from Taraba total solid content(83.82%). Fat content of the analyzed honey samples varied significantly (P<0.05). Taraba sample showed significantly (P<0.05) higher fat content (0.35%) when compared with Niger (0.34%), Benue (0.33%) and Kaduna (0.31%) samples. Niger protein content (1.06%) is higher and significantly different (P<0.05) from Benue (0.07%), Kaduna (0.04%) and Taraba (0.04%) samples, while there were no significant differences (P>0.05) among the protein contents of Kaduna (0.04%) and Taraba (0.04%) samples.
There were significantly differences (P<0.05) among the total carbohydrates and energy contents of the studied samples. Kaduna and Taraba samples indicated significantly(P<0.05) higher total carbohydrate(98.98%) and energy(1669.53%) respectively, when compared with the total carbohydrate contents in Benue(98.91%), Taraba(98.93%), Niger(97.94%) samples, and the total energy contents in Niger(1669.42%), Benue(1669.09%) and Kaduna(1668.70%) samples respectively. The mean range and the overall mean values of the parameters of the studied honey are presented thus: moisture content: 11.13 – 16.16%, 14.03±2.02%; Total solid: 83.82 – 88.83%, 85.87±1.99%; Ash content: 0.67 – 0.68%, 0.67±0.02%; Fat content: 0.31 – 0.35%, 0.33±0.02%; Protein content: 0.04 – 1.06%; 0.30±0.44%; Total carbohydrate: 97.94 – 98.98%, 98.69±0.44%; Total energy: 1668.70 – 1669.53%, 1669.2±0.46%. Similarly, these honey samples recorded the highest mean values among the studied honey; Taraba: Moisture Content: 16.16%; Ash content: 0.68%; Fat content: 0.35%; Total Energy; 1669.53KJ; Benue: Total Solid: 88.83%; Ash content: 0.68%; Kaduna: Total carbohydrate: 98.98%; Niger: Protein content: 1.06%; while, these honey samples recorded lowest mean values, Benue; Moisture content: 11.13%; Kaduna: Ash content: 0.67%; Fat content: 0.31%; Protein content:0.04%; Total Energy: 1668.70KJ; Niger: Ash content: 0.67%; Total Carbohydrate: 97.94%.
Macro and Micronutrient Elements
The mean results of the macro and micronutrient elements of the investigated honey samples were presented in Table 3. Potassium( 81.88 mg/l) was the dominant mineral element in the study, followed by Sodium(22.22mg/l), Phosphorus(31.58mg/l), Calcium(11.23mg/l), Iron(4.26mg/l) Magnesium(4.19mg/l), Cadmium( 2.96mg/l), Total nitrogen(2.66mg/l) and Nickel(1.01mg/l). There were statistical significance differences (P <0.05) in the obtained values across the nutrients. Niger sample showed significantly (P<0.05) higher sodium content (22.22mg/l) when compared with the samples from Taraba (15.21mg/l), Kaduna (14.45mg/l) and Benue (13.38mg/l). Also, there were statistically significant differences (P<0.05) between the Taraba sample (15.21mg/l), Kaduna (14.45mg/l) and Benue (13.38mg/l). Kaduna sample indicated significantly (P<0.05) higher Potassium content (81.88mg/l) when related to Benue (61.93mg/l), Taraba (50.43mg/l) and Niger (32.53mg/l). Significant difference (P<0.05) in Calcium (Ca) content were observed among the analyzed calcium samples. Benue sample showed significantly (P<0.05) higher calcium content (11.23mg/l) when compared with Kaduna (10.23mg/l), Niger (8.60mg/l) and Taraba (6.57mg/l). Kaduna sample showed statistically (P<0.05) higher magnesium content (4.19mg/l) when compared with Benue (2.15mg/l), Niger (3.62mg/l) and Taraba (4.18mg/l).
Manganese, Iron, Phosphorus, Total nitrogen and Nickel results indicated significant differences (P<0.05) in the values obtained from various locations. Accordingly, the mean range and overall mean were as follow; Sodium (Na):13.38 – 22.22mg/L, 16.31±3.51mg/L; Potassium (K):32.53 – 81.88mg/L, 56.69±18.13mg/L; Calcium (Ca): 6.57 – 11.23mg/L, 9.16±1.79mg/L; Magnesium (Mg):2.15 – 4.19mg/L, 3.53±0.85mg/L; Manganese (Mn):0.03 – 3.11mg/L, 1.31±1.15mg/L; Iron (Fe):1.36 – 4.26mg/L, 3.01±1.22mg/L; Phosphorus( P): 8.43 – 31.58mg/L, 24.85±9.67mg/L; Total Protein: 0.14 – 2.66mg/L, 1.59±0.96mg/L; Nickel(Ni): 0.05 – 1.01mg/L, 0.30±0.41mg/L; Copper(Cu): 0.0- 0.16mg/L, 0.04±0.07mg/L; Cadmium(Cd): 0.00 – 2.96mg/L, 0.78±2.14mg/L; Lead(Pb):0.02 – 0.05mg/L, 0.03±0.02mg/L. Similarly, these honey samples documented highest mean values of nutrient elements as; Benue: Calcium: 11.23mg/l; Manganese: 3.11mg/l; Cadmium: 2.96mg/l; Kaduna: Potassium: 81.88mg/l; Magnesium: 4.19mg/l; Iron: 4.26mg/l; Niger: Sodium: 22.22mg/l; Total Protein: 2.66mg/l; Lead: 0.05mg/l; Taraba; Phosphorus: 31.58mg/l; Nickel: 1.01mg/l; Copper: 0.16mg/l; while the honey samples that recorded the lowest mean values were as follows; Kaduna: Sodium: 14.45mg/l; Phosphorus: 8.43mg/l; Nickel: 0.05mg/l; Cadmium: 0.05mg/l; Copper: 0.00mg/l; Lead: 0.02mg/l;Niger: Manganese: 0.03mg/l; Copper: 0.00mg/l; Taraba: Calcium: 6.57mg/l; Cadmium: 0.00mg/l.
Correlation Coefficient Matrix of Nutrient Element Quality Variables
There were significant positive correlations established in the honey samples collected from different locations in the Guinea Savannah Vegetation Zone of Nigeria. At P<0.01 correlation occurred between most of the nutrient elements of the studied honey samples (Table 4). Fe with Na and Ca(r = 0.450, P < 0.01; r = 0.432, P < 0.01); Nc with Na, Mg and Fe(r = 0.739, P < 0.01; r = 0.741, P < 0.01;r = 0.645, P < 0.01); Ni with Mg and P( r = 0.440, P < 0.01; r = 0.421, P < 0.01); Cu with Mg, P and Ni( r = 0.442, P < 0.01; r = 0.402, P < 0.01; r = 0.990, P < 0.01); Cd with Ca and Mn( r = 0.405, P < 0.01; r = 0.561, P < 0.01); Pb with Na, Fe and Nc( r = 0.814, P < 0.01; r = 0.600, P < 0.01; r = 0.563, P < 0.01) while negative correlations P<0.01 existed between Na and K (r = -0.794), Mn (r = -0.776); K and P (r = -0.741), Pb (r = -0.556); Ca and Mg (r = -0.651), P (r = -0.394), Ni (r = -0.852), Cu (r = -0.839);Mg and Mn (r = -0.772), P (r = -0.458), Cd (r = -.0.546); Mn and Nc (r = -0.916), Pb (r = -0.466); Fe and P (r = -0.691), Ni (r = -0.787), Cu(r = -0.781); P and Nc (r = -0.407);Nc and Cd (r = -0.517); Ni and Pb (r = -0.486); Cuand Pb (r = -0.501). On the other hand, significant negative correlations were established at P<0.05 between Na and Ca (r = -0.345); Ca and P (r = -0.359); Mn and Fe (r = -0.319).
Correlation Coefficient Matrix of Chemical Quality Variables of Honey Samples
There is an indication of a high positive correlation at P < 0.01 and P < 0.05 between the chemical qualities of the investigated honey samples (Table 5). This was established at P<0.01 between fc and mc(r = 0.428); nc and mc(r = 0.426); mc and te (r = 0.471), fc and te (r = 0.760) tcho and ts (r = 0.43. P < 0.01) while significant negative correlations at P<0.01occured between mc and ts (r =- 0.996); mc and tcho (r = -0. 440); ts and fc (r = -0.398), ts and nc (r =- 0.419), ts and te (r = -0.458); ac and te (r = -0.425); nc and tcho (r = -0.998). In addition, positive and negative significant correlations were established at P<0.05 between nc and te (r = 0.305) as well as tcho and te (r = -0. 319) respectively.
Discussion
This study observed variation among the mean and overall mean values of physicochemical properties, Proximate profile, Macro and as well as trace nutrient elements of the honey samples in relation to location. The observed statistical significance differences that was obtained in values across the parameters of the studied honey could be ascribed to differences in geographical location, multifloral origin of plant bearing nectar which honeybees visited, climatic variation, extraction and storage methods. The result obtained from the analysis of hydroxymethylfurfural (HMF) content in the honey samples confirms earlier report that indicated the impact of the degree of freshness, overheating at extraction, poor storage condition as well as adulteration with commercial invert syrup on quality of honey (Codex Alimentarius standard, 2001; Bogdanov and Martin, 2002). Increment of HMF, in honey could be due to heat treatment during the processing of honey. Honey does not naturally contain HMF, but it can be derived from the loss of two molecules of fructose. Presence of HMF, in honey is an indication of long storing periods and heating (White, 1992).
Regarding the studied honey, there was significant variation (P<0.05) in obtained HMF, values across the studied honeys. Although HMF, mean value(44.57mg/kg)content of Taraba honey is above the European Legislation maximum value of 40mg/kg, it is within the 80mg/kg declared honey value from countries or regions with tropical ambient temperatures (Codex Alimentarius standard, 2001), also, it is within the Brazilian maximum recommended value of 50mg/kg(Brazilian Regulation for honey, 2000).Other HMF, mean values of investigated honey were within the international allowable limits of 40mg/kg (Codex Alimentarius,2001). This Suggests that the honey quality from Benue, Kaduna, and Niger, locations are fresh, no indication of adulteration, well processed and stored under good temperature. However, the obtained HMF, mean range and the overall mean values (32.27 – 44.57mg/kg, 37.48±7.44mg/ kg), for the studied honey samples are higher than the mean range and overall mean values (10.32 – 12.27mg/kg,10.82±0.46mg/kg, and 4.19±0.73 – 1202.43±25.40mg/kg) obtained respectively by Leticia (2013) for Melipona subnitida and Apis mellifera, Brazil sample and Khalil et al. (2010) for Malaysia sample. The differences in mean values could be due to seasonal climatic variations, geographical location, processing and storage methods.
Generally, honey is acidic in nature disregarding its geographical origin. The average pH of honey was 3.9 with a typical range of 3.4 to 6.1 [1]. Low pH in the acidic range is an indication of good shelf life and excellent stability of honey against microorganisms and natural flavour. The pH means range and the overall mean for the studied honey indicated that all the studied honey samples were acidic and were within the standard limit (3.4 to 6.1), and insures freshness of honey samples. The investigated honey pHmean range were much higher than that of Manuka honey of 3.99±0.02 and may suggest that the studied honeys may have superior antibacterial properties when compared with Manuka honey. The obtained values of the studied honey samples are within acceptable international standard limit (Codex Alimentarius 2001, AOAC 1990; 962.19).
The obtained pH, mean range values was in range with the values obtained by Ndife, et al. [10], who had a pH mean range of 4.10±2.01 to 4.47±1.93, in comparison with an imported U.S.A, honey; and who reported value of 4.10 – 4.70, 4.48±0.26, in studies of honeys produced from various apiary units of the University of Ilorin, Nigeria; but higher than the pH, mean range values obtained by Selene, et al. [11], who had a pH, range of 3.01 to 4.21, in investigation of honey samples from Ceara State, Northeast Brazil; Olugbemi, et al. [16] reported a pH, range of 3.80 to 4.13, with overall mean value of 3.96±0.13, in the study of honeys from Umuahia, Abia State, Nigeria, in comparison with Galey’s Nestle U.K, imported honey; Khalil, et al. [9] recorded a pH, mean range of 3.44±0.04 to 3.89±0.64, with overall mean value of 3.62±0.12, in the study of Malaysian honeys in comparison with Manuka honey. The variations in pH values of honey could be due to different acids found in different floral types or various floral bearing nectar honeybees visited, extraction and storage methods.
A higher free acidity value (>50mEq/kg) in honey is an indication that fermentation has taken place[1]. The recorded mean range values of free acid (Free acidity; is the acidity titratable with sodium hydroxide up to the equivalence point), varies from 22.2 to 30.5Meq/kg. There was statistical variation (P<0.05) in the obtained free acid values among the studied samples. The free acid values of the investigated honey are within the 50.0mEq/kg, Codex Alimentarius (2001) and Brazil 2000, recommended maximum free acidity values; suggesting that the investigated honeys were well processed, stored and stable against fermentation. Thus, confirming that the qualities of studied honey samples are of international standard. The obtained free acid values of the studied honey were lower than the value of free acid obtained by Leticia, et al. (2013) who reported range of free acid from 31.7mEq/kg to 33.19mEq/kg, with a mean of 32.49±1.13mEq/kg, in the study of Melipona subnitida and Apis mellifera, Brazilian sample; Khalil, et al. [9] obtained range of free acid from 29.33±1.44 to 81.83±2.02mEq/kg, with a mean value of 50.59±18.00mEq/kg, in the study of Malaysian honeys in comparison with Manuka honey; Selene, et al.[11], reported range of free acid from 51.03 to 54.50 mEq/kg, in the study of honey samples from Ceara State, Northeast Brazil, and Ndife, et al.(2014), obtained a lower range offree acid value from 1.30±1.04 mEq/kg to 1.55±1.10 mEq/kg, in comparison with an imported U.S.A, honey and higher than the values documented by who reported values of 15.00 – 19.25Meqkg-1, 17.43±1.32Meqkg-1., in studies of honeys produced from various apiary units of the University of Ilorin, Nigeria. The honey samples analyzed by Khalil, et al. [9], and Selene, et al. [11], could have been fermented. This is so because, the content of gluconic acid, produced from glucose by the action of the glucose oxidase enzyme increases during the storage of honey since the enzyme remains in activity after processing, and this increases the acidity of honey during storage with the resultant effect in the decrease of the pH [17].
Also, the mean range and the overall mean values of Lactone acid (Lactones Acid represents the combined acidity which is not directly titratable), were found to be from 31.5 to 36.6 Meq/kg, 33.9±1.90 Meq/kg. The obtained Lactone acid values of the studied honey were above the international recommended standard limit of ≤3.23mEq/kg (Codex Alimentarius, 2001). Meanwhile, the obtained Lactone acid values of Kaduna and Taraba honey samples were in agreement with the range of value of Lactone acid obtained by Khalil, et al. [9], from 4.15±0.56mEq/kg to 9.00±0.87mEq/kg, with overall mean of 6.30±1.83mEq/kg, in the study of Malaysian honeys in comparison with Manuka hone, but higher than the value reported by who documented value of 0.82-2.45Meqkg-1, with overall mean of 1.81±0.56 Meqkg-1, in study of honeys produced from various apiary units of the University of Ilorin, Nigeria.
The obtained mean range and the overall mean values of the total acid (Total acidity, is the sum of the free acidity and the Lactone acidity). The obtained values of the total acidity of the investigated honey are lower than the values recommended by European Standard Draft (≤40mEq/kg) and Codex Alimentarius Draft (≤50mEq/kg), pointing to the high degree of freshness of the tested honey. The obtained total acid value of the tested honey are lower than the results of total acid obtained by Khalil, et al. [9], who reported range from 34.67±1.76mEq/kg to 86.06±2.38mEq/kg, with overall mean of 57.39±16.94mEq/kg, in the study of Malaysian honeys in comparison with Manuka hone, but higher than the value obtained by who recorded range between 16.10-21.70Meqkg-1, with overall mean of 19.16±1.68 Meqkg-1, in studies of honeys produced from various apiary units of the University of Ilorin, Nigeria. Differences in total acid values may be attributed to seasonal variation, geographical locations, and extraction and storage methods.
The Optical Density (O.D) measurement of the tested honey samples recorded mean range and overall mean values of 0.073 to 0.135 and 0.103±0.02 respectively. The optical density results of the tested honeys suggest that the more intense the colour of the tested honey was the higher the absorbance value. The differences in the honey colouration could be attributed to the concentration of carotene and flavonoid contents of the pollen grain of the floral bearing nectar that bee visited. This suggests the botanical and geographical origin of bee honey [18].
Specific gravity of honey is moisture content and floral source dependent (USAD, 1985; EU, 2001). The obtained Specific Gravity (S.G.) mean range and overall mean value of the investigated honeys were from 1.31 to 1.65 and 1.42±0.14 respectively. This is an indication of high viscosity, resulting in reduction in flow upon pumping, settling, filtration, mixing and bottling [1,19]. There was statistical variation (P<0.05) in the obtained values among the tested honey samples. Benue honey, recorded the highest specific gravity 1.65, followed by Kaduna honey, 1.42. Except Benue honey, which recorded a higher S.G. of 1.65, above the international tolerance range limit of 1.38 to 1.45 [1,19]; the S.G, values of Kaduna, Niger and Taraba honey samples, are within the international recommended standard range limit of 1.38 – 1.45 [1,19]. However, the obtained specific gravity results for Kaduna, Niger and Taraba honey samples, agreed with the honey S.G results obtained by Ndife, et al. [10] who recorded S.G. range of 1.42±0.15 to 1.44±0.52, in comparison with an imported U.S.A, honey and Olugbemi, et al.[16] who reported S.G value of 1.3415 to 1.3432, with overall mean 1.3428±0.0014, in the study of honeys from Umuahia, Abia State, Nigeria, in comparison with Galey’s Nestle U.K, imported honey. The differences in the specific gravity of the investigated honey samples could be ascribed to the water content and floral source of the studied honey samples.
Moisture content of honey is an important factor for consideration in relation to stability, storage, exportability, fermentation and granulation. Low moisture content of less than 18% confers on honey longer period of preservation and against osmophilic bacterial activities [1]. Maximum value of 20% is established as the international standard for honey moisture content by the Codex Alimentarius and EU, commissions. Honey with over 20% water content will ferment [20]. Also, honey with carbohydrate content greater than 83%, moisture content less than 17.1% and storage temperature less than 11 oC, will not ferment [1]. Regarding the studied honey samples, the moisture content mean values for all the honey samples were less than the maximum recommended standard limit 20% for good quality honey and 14% ascribed as valuable (Ojeleye, 1999). The investigated honeys were stable against fermentation and could not become acidic easily in storage in the presence of yeast. The studied honey samples can withstand the chances of losing their freshness and can be recommended for mead making.
However, the obtained honey moisture content values were in agreement with the values reported by Ndife, et al. [10] who had range value of 15.69±1.94% to 17.90±2.12%, in comparison with an imported U.S.A, honey; Leticia, et al. [8] who recorded17.86% to 18.66%, in the study of Melipona subnitida and Apis mellifera, Brazilian sample; reported 16.00±2.19%, in the study of biochemical composition of Honey from North-East Nigeria; reported 16.4% to 20.4%, on honey samples from North – East Algeria; Selene, et al. (2013) reported 13.63% to 20.80%, on honey samples from Ceara state, Northeast Brazil; documented value of 9.11 – 17.99%, 13.78±1.57%, on honeys produced from various apiary units of University of Ilorin, Nigeria; also the obtained results were lower than the values obtained by Olugbemi, et al.[16] who reported range from 20.26% to 22.40%, with a mean value of 20.48±1.69%, in the study of honeys from Umuahia, Abia State, Nigeria, in comparison with Galey’s Nestle U.K, imported honey, and Khalil, et al.(2010) reported range between 12.71±0.45% to 22.32±0.32%, with a mean value of 17.72±2.75%, on studied honey samples from Malaysia, in comparison with Manuka honey.
Total solid is a measure of dissolved solids in honey samples. According to the grading system of the United States of Department of Agriculture [19], honey with total soluble solids greater or equal to 81.4% of solids is considered of higher grade (A&B), while that falling between 80% and 81.3% is considered a lower grade C. Regarding the studied honeys, the mean values of the total soluble solids ranged between 83.82% and 88.83%, with overall mean of 85.87±1.99%. Thus, the investigated honeys are of higher-grade A and B (USDA, 1985), and are considered stable with regards to fermentation upon storage (USDA, 1985). The total solid results are in keeping with the result reported by [10] of a range value between 82.10±1.24% to 84.31±1.20%, with a mean value of 82.95±1.20%, in comparison study with an imported U.S.A, honey. However, the obtained result was higher than the result recorded by [16] who reported a range value of 11.33% to 20.34%, with a mean value of 15.94±3.57%, in the study of honeys from Umuahia, Abia State, Nigeria, in comparison with Galey’s Nestle U.K, imported honey of value 19.95%. Differences in reported values could be attributed to variations in geographical locations of sampling area.
Ash content is a reflection of inorganic mineral content and it is a quality criterion for botanical and geographical origin of honey. The values of the ash content of the studied honey range from 0.67% to 0.68%. The obtained ash value of the study was higher than the, and the European honey Commission specified value of 0.6%. This could be that the analyzed honeys contained higher quantities of essential inorganic minerals or be attributed to the soil where the honeybee plants grew [20]. However, reported that the mineral content of blossom honeys is within the range of 0.1 to 0.3% and that of honeydew honeys is up to 1.0%.
The obtained ash value was higher than the values reported by Ndife, et al. [10] who reported mean range value of 0.26±0.05% to 0.38±0.04%, in comparison study with an imported U.S.A, honey; Olugbemi, et al. [16] reported range value of 0.33% to 0.63%, with a mean value of 0.47±0.14%, in comparison with Galey’s Nestle U.K, imported honey of value 19.95% ; reported ash content of 0.47±0.09%, in the study of biochemical composition of Honey from North East Nigeria, but the obtained ash values in this study were lower than the ash values obtained by Selene, et al. [11]who reported a range value from 0.01% to 0.71%, with an average value of 0.19%, in the study of honey samples from Ceara State, Northeast Brazil and who documented ash content of range1.95-8.24%, 4.16±1.78%, on honeys produced from various apiary units of University of Ilorin, Nigeria. Variations in ash content could be due to differences in soil factor, floral, geographical and botanical origin. Physicochemical properties of all the investigated honey samples are within the international allowable limits by the honey regulatory commission.
Food of a higher fat content stands the risk of rancid spoilage during storage [14]. The fat content recorded in this study that ranged from 0.31% to 0.35% is higher than the previous records by Ndife et al. [10] who reported a range of fat value of 0.12±0.01% to 0.20±0.03%, in comparison study with an imported U.S.A, honey, which were lower than the obtained value while, reported value (0.01% to 0.50%) and lower compared to Leticia et al. [8] reported value of between 0.37% and 0.39%. Accordingly, these literatures on fat content of honey suggest that honeys are not good source of fat. The differences in the values of fat could be due to variation in pollen that bees visited.
Generally, the nitrogen content in honey is low, and in an average of 0.04%, and may be up to 0.1 % [21]. The nitrogen content of the studied honey samples varies from 0.04% to 1.06%, with an overall mean of 0.30±0.44 %. The obtained nitrogen content value was lower than the result obtained by Ndife et al. [10] who reported 0.90±0.28% to 1.10±0.41%, in comparison study with an imported U.S.A, honey; reported 0.35% to 1.08%, with a mean value of 0.67±0.25%, in the study of biochemical composition of Honey from North-East Nigeriareported 0.22% to 0.96%, on honey samples from North-East Algeria and Ande et al.(2010), documented 0.55-1.41%, 1.10±0.27%, on honeys produced from various apiary units of University of Ilorin, Nigeria. Differences in the values of protein could be ascribed to botanical origin of honey, plant nectar or pollen from honeybee.
The main constituents of honey are the carbohydrates which constitute about 95% of honey dry weight. The main sugars found in honey are the fructose and glucose [21], reported that honey is a high energy carbohydrate food and that the sugar content in honey is digestible similar to the sugars found in fruits. Also, honey with carbohydrate content greater than 83%, moisture content less than 17.1% and storage temperature less than 11oC, will not ferment [1]. Regarding the total carbohydrate (%) and energy (KJ) contents of the investigated honey samples in the four various locations, total carbohydrate mean varies from 98.91% to 98.98%, with an overall mean 98.69±0.44% and energy mean ranged from 1668.70KJ to 1669.53KJ, with an overall mean 1669.2±0.46KJ. The carbohydrate values of the studied honeys were within international limit of >83 % [1,19]. The obtained results agreed with the values recorded by Leticia et al.(2013) who reported 98.95±019% carbohydrate and 1678.54±12.68KJ energy, in the study of Melipona subnitida and Apis mellifera, Brazilian sample, but were higher than the values reported by [10] who documented 80.80±2.96% to 82.71±3.10% carbohydrate, and 328.06±4.32kcal/100g to 337.04±5.10kcal/100g energy, in comparative study with an imported U.S.A, honey, and reported 82.30±2.03% carbohydrate, with a higher energy value of 1,401.33±33.71KJ, in the study of biochemical composition of Honey from North-East Nigeria. The studied honeys were high energy carbohydrate food.
The total protein content of the analyzed honey samples in this study falls within the range of 0.14mg/l to 2.66mg/l, with an overall mean of 1.58±0.96mg/l. The variations in the protein content can be linked to the differences in soils composition, locations and floral origin. All the proximate composition results of the studied honey samples are within the internationally accepted limit by honey regulatory commissions. The macro and trace mineral elements content in honey samples could give an indication of the environmental pollution and geographical origin of honey [22,23]. Minerals in honey vary according to the botanical origin and soil composition [23]. Calcium is macronutrient essential for plants as well as animals. Iron and Magnesium are micronutrient essential for both plants and animals. Recommended dietary allowance (RDA) for minerals; Potassium: 1600mg to 2000mg for men and women; Sodium: 400mg to 420mg for men and 310mg to 320mg for women; Iron: 10mg for men and 15mg for women; Copper: 900μg for men and women [17]. Thus, honey is a good food supplement.
The mean range of Sodium (Na) content of the studied honey samples from the four different locations varied from 13.38 to 22.22mg/l, 16.31±3.51mg/l. The obtained result agreed with the range value of 0.9 to 26.7mg/100g with a mean value of 5.6±4.8mg/100g reported by [24], on their study of Blossom honey and Honeydew honeys from Northwest Spain; Marcelo et al. (2007), obtained a mean value of 24.5mg/100g in the analysis of honeys from Marche region in Italy, but disagreed with the mean value 3.70±0.50mg/l recorded by [10] when compared with the mean value 16.31±3.51mg/l obtained in this study. The Recommended Dietary Allowance (RDA) of Sodium for men ranged between 400mg to 420mg and for women varied from 310mg to 320mg [1989]. The average amount of Sodium per 100g honey is 2.85mg and per one tablespoon serving 21g is 0.6mg [25]. Minerals in honey vary according to the botanical origin and soil composition.
Potassium is the most abundant mineral among the mineral elements in this study and the obtained values ranged between 32.53mg/l to 81.88mg/l with an overall mean of 56.69±18.13mg/l. The reported values in this investigation agreed with the values obtained by [24]that documented a range of Potassium values from 32.8 to 312.1mg/100g with a mean value of 138.7±62.8mg/100g, on the study of Blossom honey and Honeydew honeys from Northwest Spain;[26], obtained a mean value of 643mg/100g in the analysis of honeys from Marche region in Italy; Ndife, et al. [10], reported mean value of 50.10±0.62mg/100g, in comparison study with an imported U.S.A, honey; while, recorded a lower mean range from 0.626mg/l to 3.152mg/l on the study of honeys from stations in South South Nigeria, in comparison with the Manuka honey. Differences in Potassium values could be due to the nature of soils on which nectar plants thrive and variation in locations. However, the Recommended Dietary Allowance (RDA) of Potassium for men and women ranged from 1600mg to 2000mg (Pamplona, 2006). The average amount of Potassium per 100g honey is 50.0mg and per one tablespoon serving 21g is 11.0mg [25].
The Calcium content in the analyzed honey samples from the four various locations of savanna zones of Nigeria, varied from 6.57mg/l to 11.23mg/l with an overall mean value of 9.16±1.79mg/l. The Calcium content obtained in this study agreed with results recorded by [24], who documented mean range from 2.8mg/100g to 16.6mg/100g, on the study of Blossom honey and Honeydew honeys from Northwest Spain; Marcelo, et al.(2007), obtained a mean value of 116mg/100g in the analysis of honeys from Marche region in Italy; while [10] and (2011), reported lower mean range values 6.81±0.42mg/100g and 0.6337mg/l to 1.9073mg/l respectively. The average amount of Calcium per 100g honey is 4.8mg and per 0one tablespoon serving 21g is 1.0mg (Sweeteners and Desserts, 2005). Minerals in honey vary according to the botanical origin and soil composition [22,23].
The Magnesium content of the investigated honeys ranged between 4.19mg/l and 2.15mg/l with an overall mean of 3.53±0.85mg/l. Differences in Magnesium content is ascribed to differences in soils composition and different floral honeybee visited. The obtained Magnesium results in this study is in agreement with the values reported by Escuredo et al. [24], who documented mean range from 1.4mg/100g to 30.7mg/100g, with a mean value of 7.8±7.9mg/100g, on the study of Blossom honey and Honeydew honeys from Northwest Spain; [26], obtained a mean value of 212mg/100g in the analysis of honeys from Marche region in Italy and Ndife, et al. [10], reported mean value of 50.10±0.62mg/100g, in comparison study with an imported U.S.A, honey. The average amount of Magnesium per 100g honey is 2.0mg and per one tablespoon serving 21g is 0.4mg [25].
The Manganese contents of the honey samples analyzed in this study falls within the range of 0.03mg/l to 3.11mg/l, with an overall mean of 1.31±0.85mg/l. Variations in the obtained Manganese values from four different locations in this study could be due to differences in soils composition, locations and botanical origin [23]. The obtained Manganese values in this investigation are higher than the mean value 0.44mg/100g that Marcelo, et al. [26] reported on the analysis of honey samples from Marche region of Italy. Differences in Manganese values could be ascribed to soils composition, botanical origin. In an average amount of 100g honey, the quantity of Manganese is 0.15mg and an average amount of 21g honey of one tablespoon, the quantity of Manganese is 0.03mg [25].
The obtained Iron values in the analyzed honey samples of this study are significantly different (P<0.05) across the examined samples. Differences in the obtained values of iron in this investigation could be due to soils composition and floral origin. This is an indication of correlation between plant uptake and soil nutrients. The mean values of iron in the studied honey samples ranged between 1.36mg/l and 4.26mg/l, with an overall mean value of 3.01±1.22mg/l. The iron values obtained in this study agreed with the mean values (6.34mg/100g) obtained by Marcelo, et al.[26] on the analysis of honeys from Marche region in Italy, but lower than the results (0.0 – 1.1mg/100g, with a mean value of 0.3±0.2mg/100g) obtained by Escuredo, et al. [24], on the study of Blossom and Honeydew honeys from Northwest Spain; range of mean values from 0.394 to 0.80mg/l, obtained by, on the study of honeys from stations in South South Nigeria, in comparison with the Manuka honey and Ndife, et al. [10] whom reported mean value of 1.12±0.04mg/100g, in comparison study with an imported U.S.A, honey. Differences in the obtained values of iron in this investigation could be due to soils composition, locations and floral origin. In an average amount of 100g honey, the amount of Iron is 0.25mg and an average amount of 21g honey of one tablespoon, the amount of Iron is 0.05mg [25].
Phosphorus content of honey in this investigation varied from 8.43mg/l to 31.58mg/l, with an overall mean of 24.85±9.67mg/l. In this study, the obtained Phosphorus value is in agreement with the reported mean range 3.0 to 31.5mg/100g, with a mean value of 8.8±5.5mg/100g, by [24], on the study of Blossom and Honeydew honeys from Northwest Spain. In an average amount of 100g honey, the quantity of Phosphorus is 5.0mg and an average amount of 21g honey of one tablespoon, the quantity of Phosphorus is 1.0mg [25]. Differences in soils composition, locations and floral origin are ascribed to variations in values of obtained Phosphorus. In this investigation, the mean contents of Nickel in the studied honey samples varied from 0.05mg/l to 1.01mg/l, with an overall mean of 0.30±0.41mg/l. These variations in the obtained values of Nickel could be attributed to differences in soils composition and floral origin [22]. Also, the mean value of Copper in the study ranged between 0.00mg/l to 0.16mg/l, with an overall mean value of 0.04±0.07mg/l. This indicated the relationship between plant nutrient uptake and soils. The Copper results of the analyzed honey samples of this study are lower than the mean range values (0.00 to 3.7mg/100g, with a mean value 0.4±0.8mg/100g) obtained by [24], on the study of Blossom and Honeydew honeys from Northwest Spain; the mean values (0.8mg/100g) obtained by [26] on the analysis of honeys from Marche region in Italy; the mean value(243μg/kg) reported by [12] on the analysis of honeys from Ardabil, in Iran and the mean ranged value(0.057 to 0.168mg/l) obtained by (2011), on the study of honeys from stations in South South Nigeria, in comparison with the Manuka honey. In an average amount of 100g honey, the quantity of Copper is 0.05mg and an average amount of 21g honey of one tablespoon, the quantity of Phosphorus is 0.01mg [25]. Differences in geographical locations, floral origin and soils composition could be attributed to the variations in the values of copper contents of honeys [22,23].
The analyzed honey samples in this study recorded mean ranged values of Cadmium from 0.00mg/l to 2.96mg/l, with an overall mean of 0.78±2.14mg/l. The differences in soils composition and floral origin could account for the variations in the Cadmium values [22]. The reported Cadmium values in this study agreed with the result (27.62μg/kg, and the ranged value from 1.36 to 125.88μg/ kg) obtained by Hassan, et al. [12] on the analysis of honeys from Ardabil, in Iran while the mean Lead values in this investigation ranged between 0.02mg/l and 0.05mg/l, with an overall mean of 0.03±0.02mg/l. The variations in soils composition and floral origin could also be ascribed to the differences in lead obtained values. The abundance of macro nutrient elements of the investigated honey samples from the four locations of savanna zones of Nigeria, is presented in a descending order of quantity as follows: Potassium>Phosphorus>Sodium>Calcium>Iron>Magnesium> Manganese; while the trend of the trace element occurs in a descending order of quantity as follows: Cadmium>Nickel>Copper>Lead.
Kaduna honey sample is richer in Potassium (81.88mg/l), Magnesium (4.19mg/l) and Iron (4.26mg/l); Niger, honey recorded a higher content of Sodium (22.22mg/l), Total Nitrogen (2.66mg/l) and Lead (0.05mg/l); while Benue samples reported higher values of Calcium(11.23mg/l),Manganese(3.11mg/l) and Cadmium(2.96m/l); also Taraba, honey sample contain higher value of Phosphorus(31.58mg/l), Nickel(1.01mg/l) and Copper(0.16mg/l). Similarly, honey samples from the following locations recorded the lowest mineral nutrient elements in the study; Benue, honey: Sodium (13.38mg/l), Magnesium (2.15mg/l), Total Nitrogen (0.14mg/l), Copper (0.00mg/l) and Lead (0.02mg/l); Kaduna, honey: Phosphorus (8.43mg/l), Nickel (0.05mg/l), Copper (0.00mg/l), Lead (0.02mg/l); Niger, honey: Manganese(0.03mg/ l ) , C o p p e r ( 0 . 0 0 m g / l ) ; Ta r a b a , h o n e y : C a l c i u m ( 6 . 5 7 m g / l),Iron(1.36mg/l),Cadmium(0.00mg/l). The presence of trace element in the studied honey is an indication of environmental pollution from varieties of plant bearing nectar and soil factor, geographical origin of honey [22,23]. The levels of potassium(K), Calcium (Ca), Copper (Cu), Iron (Fe), Magnesium (Mg), Manganese (Mn) and Zinc (Zn), have been evaluated in several Nigerian plant leaves [27]. Among these minerals Potassium, had the highest content followed by Magnesium and Calcium. Osuagwu, et al. [27] analyzed the mineral composition of Moringa oleifera Lam, leave in Guinea Savannah of Nigeria, and found the main mineral in this descending order of quantity: Calcium>Potassium>Magnesium>Sodium; although the order differs from the study of the investigated honey samples, the main minerals were the same [28-31].
Conclusion
This study evaluated the physicochemical properties and mineral elements of honeys produced in Guinea Savannah Zone of Nigeria, via: Benue (Naka), Kaduna (Zangokataf), Niger (Gbako) and Taraba (Sardauna); with a view of comparing the quality with those described in Codex Alimentarius and European regulatory commissions for bee honeys. The values of quality parameters of all the investigated honeys were within the acceptable limits of international standards and showed that the studied honeys met the physicochemical and mineral quality requirements established in international market. The moisture content of all the studied honeys is less than 17% and this confers on the samples stability, against osmophilic bacterial activities, long period preservation. Honeys from the four locations of savanna zones of Nigeria, are good for food security, industrial value as raw materials and for export.
Acknowledgement
None.
Conflict of Interest
No conflict of interest.
References
- EU (2001) European Union Council Directives 2001/110/CE relating to honey. Official Journal of European Community L10: 47-57.
- Kaskonienes V, Venskutonis PR, Ceksteryte V (2010) Carbohydrate composition and electrical conductivity of different origin honeys from Lithuania, LWT-Food SciTechnol 43: 801-807.
- EL-Metwally AAE (2015) Factors Affecting the Physical and Chemical Characteristics of Egyptian Bee honey. Ph. D. Thesis, Fac. Agric. Cairo Univ pp. 320.
- Eleazu CO, Iroaganachi M,Okoronkwo J (2013) Determination of the physicochemical composition, microbial quality and free radical scavenging activities of some commercially sold honey samples in Aba, Nigeria: The effect of varying colors’. J Nutr Food Sci 3(2): 189.
- Ouchemoukh S, Louaileche H, Schweitzer (2007) Physicochemical characteristics and pollen spectrum of some Algerian honeys. Food control 18: 52-58.
- Ramirez CMA, Gonz a lez NSA, Sauri DE (2000) Effect of the temporary thermic treatment of honey on variation of the quality of the same during storage. Apiacta 35(4): 162 -170.
- Olaitan PB, Adeleke OE,Ola IO (2007) Honey: a reservoir for microorganisms and an inhibitory agent for microbes. African Health Sciences 7: 157-165.
- Leticia ME (2013) Comparative study of the physicochemical and palynological characteristics of honey from Melipona subnitida and Apis Mellifera. International J of Food Science and Technology 48: 1698-1706.
- Khalil MI, Suleiman SA, Gan SH (2010) High 5-Hydroxymethyl furfural concentrations are found in Malaysian honey samples stored for more than one year. Food Chem Toxicol.
- Ndife J, Kida F, Makarfi T (2014) Quality Assessment of Nigerian honey sourced from different floral locations. Journal of Food and Nutrition Sciences 2(4): 162-167.
- Selena Maria de Morais, Maria da Conceicao Tavares Cavalcanti Liberato, Carlos Emanuel de Carvalho Magalhaes, Islay Lima Magalhaes, Daniel Bomfim Cavalcanti, et al. (2013) Physicochemical properties and mineral and protein content of honey samples from Ceara state, Northeastern Brazil. Food Sci, Technol (Campinas) 33(1) Campinas Jan./Mar. Epub Mar 26.
- Hassan MAI, Monireh K, Abdolrasoul R, Marzieh S, Amir HM, et al. (2015) Heavy metals determination in honey samples using inductively coupled plasma - optical emission spectrometry. J Environ Health Sci Eng13: 39.
- Ramalhosa EE, Gomes TT, Pereira AP, Dias TT, Estevinho LM (2011) Mead production tradition versus modernity. Advanced Food Nutritional Research 63: 101-118.
- Estevinho LM, Feas X, Seijas JA, Vazquez Tatol MP (2012) Organic honey from palynological, Microbiological and bioactive compounds Characterization. Food and Chemical Toxicology 50: 258-264.
- Wakhle DM (1997) Beekeeping technology-production, characteristics and uses of honey and other products. In: Mishra, R.C. (Eds.)., Perspectives in Indian Apiculture, Agro-Botanica, Bikaner, pp. 134-139.
- Olugbemi O, Ikeme CH, Dioha IJ (2013) Physicochemical Analysis of honey from Umuahia, Abia State, Nigeria. Research Journal in Engineering and Applied Sciences 2(3): 199-202.
- Pamplona BC (1989) Exame dos elementosinorganicosencontradosBrasileiros de ApisMettifera e suasrelacoesFisco-biologicas: 131F.
- Ponnuchamy R, Bonhomme V, Prasad S, Das L, Patel P (2014) Honey pollen: Using melissopalynology to understand foraging preferences of bees in tropical South India. PLoS ONE 9(7): 1-11.
- (1985) USDA, United States Department of Agricultural Standards for honey grades of extracted honey, (5th)., In Agricultural marketing service fruit and vegetable Division processed products branch. Department of Agriculture. Washington DC, USA.
- White JW, Riethof ML, Subers MH, Kushnir I (1962) Composition of American honey. U.S. Department of Agriculture Technical Bulletin 1261: 124.
- White JW, Doner LW (1980) Honey composition and properties: Beekeeping in the United States. Agriculture Handbook No. 335. Revised October p. 82- 91.
- Franchini RA,Ferraz de Souza A, Colombara C, Matos R MAR, Matos RC(2007)Rapid determination of hydrogen peroxide using peroxidaseimmobilized on Amberlite IRA-743 and minerals in honey. Journal of Agriculture and Food Chemistry 55(17): 6885-6890.
- Pohl P (2009) Determination of mineral content in honey by atomic absorption and emission spectrometric. Trends in Analytical Chemistry 28(1): 117-125.
- Escuredo O,Seijo M, Fernandez Gonazalez M (2011) Descriptive analysis of rubus honey from the North- west of Spain. International Journal of food Science and Technology46: 2329-2336.
- Sweeteners, Desserts (2005) American Diabetes Association.
- Marcelo EC, Jorge S, Luigi C, Domenico C, Mabel BT (2007) Characterization of Italian honeys (Marche Region) on the basis of their mineral content and some typical quality parameters. Chemistry Central J 1: 14.
- Osuagwu OS, Ega RIA, Okoh T,Oyerinde AA (2014) Comparative studies of the physicochemical properties and mineral elements of Moringa oleifera Lam. leaves in the Guinea Savannah of Nigeria. Inter J Agri Biosci 3(6): 266 – 270.
- Gomes S, Dias L, Moreira L, Rodrigues P, Estevinho LM(2010) Physicochemical, Microbiological and antimicrobial properties of commercial honeys from Portugal. Food and Chemical Toxicology 48:544-548.
- Ojeleye B (1999) Foundation of Beekeeping in the Tropics. CEBRAD Press Ibadan, Nigeria. 225 pp.
- Pamplona R (2006) Encyclopedia of foods and their Healing power. 1: 100-103.
- White J (1992) Quality evaluation of honey: role of hydroxymethylfurfuraldhyde and diastase assays. Ame bee 132(11): 737 - 743.
