 Mini Review
Abstract
Immunoelectron microscopy has been shown to be a useful tool for quantifying distributions of relevant proteins across cellular compartments. This methodology has been recently applied to study the biological response of Heberprot-P in humans, an epidermal growth factor (EGF)-based therapeutic product that enhances healing of chronic wounds in patients with diabetic foot ulcers (DFU) safely and efficaciously. Thus, we were able to investigate the differential EGF receptor (EGFR) distribution in various intracellular compartments of fibroblasts from the granulation tissue of DFU. In agreement with an EGFR functional failure in the diabetic granulation tissue, EGFR was scarcely detected in fibroblasts. Interestingly, EGF treatment of DFU induced an early activation of EGFR (from 15 min to 60 min) in the nucleus of DFU´ fibroblasts. Notably, augmented labeling of EGFR was observed in mitochondria of fibroblasts at later times following EGF therapy (from 6 hours to 24 hours). These findings suggest that while nuclear functions of EGFR prevailed at early times after EGF treatment, major mitochondrial functions of EGFR might also contribute to the therapeutic effect at later times following EGF infiltration. In general, this research demonstrated the value of applying quantitative immunogold labeling distributions of cellular compartments to the study of relevant therapeutic intracellular signaling pathways.
Keywords: Immunoelectron Microscopy; Diabetic Foot Ulcers; Heberprot-P; EGF; EGFR
Mini Review
A methodology to quantify intracellular immunogold localization using transmission electron microscopy (TEM) sections (immune electron microscopy (IEM)) has been previously shown to be a powerful tool for examining relative intracellular distributions of interesting molecules [1,2]. It has been developed based on principles of rigorous sampling, stereological estimation and statistical evaluation procedures. By comparing patterns of compartmental gold labeling within and between different groups of cells, preferential labeling of certain compartments within a cell or shifts in labeling patterns associated with experimental treatment can be evaluated. As spatial distributions of molecules can be mapped in the context of cellular ultrastructure, intracellular trafficking of these molecules may be efficiently monitored while showing details of cell fine structure. Therefore, we hypothesized that this approach may be particularly relevant to study key cellular signaling pathways with therapeutics effects.
Lower extremities ulcerations and the potential for amputation are major complications of diabetes [3]. Consequently, diabetes is considered as the leading cause of lower limb amputations globally [4]. In addition, impairment of the healing process is a hallmark of diabetes [5]. Thus, persistent hyperglycemia and related mitochondrial reactive oxygen species overproduction are involved in chronic tissue damage, aberrant wound healing response and diabetic complications [6]. Fibroblasts play a key role in the wound healing response as they proliferate, express a range of cytokines, growth factors, chemokines and secrete proteases, extracellular matrix proteins and other factors. Importantly, the functions of fibroblasts have been shown to be affected in diabetic foot ulcers (DFU) [7,8]. Moreover, key signaling pathways mediated by the epidermal growth factor (EGF) receptor (EGFR) have been shown to play a central role in wound healing and they are affected in DFUs [9-11].
We have recently applied this methodology to study the biological response to Heberprot-P in humans, an EGF-based therapeutic product that enhances healing of chronic wounds in patients with DFU safely and efficaciously. While EGFR was scarcely detected in fibroblasts derived from diabetic granulation tissue, EGF treatment of DFU induced a strong activation of EGFR in fibroblasts [8]. A key feature of this activation was the early immunolabeling increase of EGFR in the fibroblasts´s nucleus as compared to cells analyzed at later times following EGF treatment. However, at later times after EGF therapy, EGFR was augmented in mitochondria of fibroblasts. These findings indicated for the first time the relationship of EGFR localization in nucleus and mitochondria and the therapeutic effect of a world leading treatment for DFU directly in humans. It also points to the value of quantitative IEM for the study of relevant intracellular signaling pathways.
2-Quantitative Immunogold Labeling Distributions of Cellular Compartments
Several excellent reviews have described the various methods of quantitative IEM and its applications [12,13]. Here we will focus on those stereology-based methods that we have used to analyze EGFR signaling in DFU samples.
Randomized Sampling of Specimens
Several important considerations have to be taken into account when designing quantitative IEM experiments including the intrinsic variability of biological specimens. Importantly, biological structures tend to vary in appearance depending on their position and their orientation. TEM and IEM involve cutting ultrathin sections (40-80 nm thick) to reveal the internal structure of a specimen at a high level of resolution. Major consequences of producing ultrathin physical sections from 3-dimensional structures are:
Figure 1: Workflow for quantitative IEM to study EGFR intracellular traffic. Note: Steps in a multistage random sampling scheme followed by stereology-based quantification. First, a set of specimens are selected from DFU, fixed and cut into serial slices. These are embedded (blocks) and sectioned for TEM followed by on-section immunolabeling. Then, these are sampled in turn to provide fields of view (FOVs) followed by quantification using stereology to count gold particles and test points in volume occupying compartments (VOC) and data handling involving descriptive and inferential statistics. Each step involves randomization of section location (SUR sampling).
Figure 2: Illustrations of multistage SUR sampling cascade for studying EGFR intracellular traffic. Note: Red circles represent selected samples for further sampling. A) The DFU specimen is cut into serial slices and every 6th slice is selected (at least two widely separated slices), and subsequently SUR sampled (not shown) to obtain tissue pieces to prepare embedded blocks for further sampling; B) Each block is overlaid with a lattice of lines (gross lines) and a group of ultrathin sections (thin lines, 1 and 2) from every 2nd slice (red circles) are selected (at least two widely separated groups of ultrathin sections); C) In this example a ribbon of three TEM sections (1-3) is placed on nickel grid and a SUR sample of fields of view from one section is obtained (red circles, section 2).
a) A tiny fraction of each specimen can be examined.
b) There is a loss of dimensional information in the ultrastructural image.
c) The areas, lengths of cell structures observed on the section planes vary depending on the position and orientation of those planes. All these issues support the need to select multiple sampling items that cover a range of positions and orientations within the specimen. Consequently, to provide all parts and every orientation of the specimen an equal chance of selection, a multistage random sampling scheme is required for ultrastructural examination. Figures 1 & 2 show the scheme followed for studying EGFR intracellular distribution in DFU´s fibroblasts. During the work flow for quantitative IEM to study EGFR intracellular traffic, specimens were fixed and dehydrated as described elsewhere [8]. Then, samples were embedded in Lowicryl and polymerized by exposure to ultraviolet light at room temperature for 72 h to produce blocks. Ultrathin sections obtained from these blocks were scanned to generate fields of view (FOVs) for TEM. It has been proposed that in this scheme, each specimen must provide a minimum of two tissue blocks, at least two widely separated ultrathin sections per block and a minimum of two microscopical FOVs per section [12]. Then, the next step is to count particles and allocate them to appropriate compartments. At this step, the use of stereological test probes (see below) allows statistical comparisons between compartments within a cell or a group of similar cells.
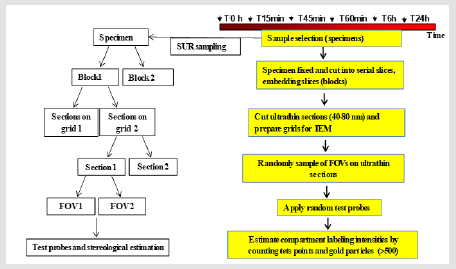
Figure 3: Stereological quantification to test for preferential labeling of volume occupying compartments (VOC) within a cell (Approach 1). Note: Note: This image shows EGFR immunolabeling of a fibroblast-like cell (FLC) from part of a randomly selected field of view of a DFU´s section. Gold particles (arrows) lying on various compartments (nucleus (N), endoplasmic reticulum (ER), golgi complex (GC), mitochondria (M), rest of cytoplasm (RC)) are counted and provide an observed distribution using the ImageJ 1.48v software. To test whether or not any VOC are preferentially labeled, expected distributions of random gold particles can be simulated by randomly superimposing lattices of test point probes (blue crosses) and counting those which fall on profiles of the chosen compartments. Observed and expected distributions of gold particles are compared by means of contingency table and chi-square analysis.
Random sampling of specimens is a critical requirement at each stage of this process (Figure 3) (For a general detailed description, see [13]. Importantly, systematic uniform random (SUR) sampling is considered to be more efficient than independent random sampling, particularly for heterogeneous specimens, because it confer more even coverage across the entire specimen [14,15]. In SUR sampling, the position and the orientation of the first piece are randomized and a selected pattern (the sampling interval) determines the positions and orientations of other items. However, to avoid sampling inefficiency the sampling interval should not coincide with some natural pattern or periodicity within the specimen itself [15].
Defining Compartments
Generally, intracellular ultrastructural compartments include volume-occupying organelles (VOC) (e.g. mitochondria, nuclei, golgi complex, etc) and surface-occupying membranes (e.g. mitochondrial membranes, cisternal membrane of the rough endoplasmic reticulum, etc). It is worthy of note that randomization of positions within the specimen is sufficient when studying only VOC. However, when investigating surface-occupying compartments or a mixture of VOC and surface-occupying compartments both position and orientation must be randomized. The aim of our study involved the investigation of EGFR localization through a set of VOC and thus, the randomization of positions within the specimen was sufficient.
Methods for Quantifying Gold Particles
Two major methods, that had been thoroughly described before [2], were used to study the intracellular trafficking of EGFR [8].
Approach 1: To compare the distributions of gold particles between different compartments within a cell or cell system. The aim of this method is to test whether the observed distribution of gold particles between compartments within a given cell type is random or non-random [2]. Firstly, an appropriate set of compartments (VOC for this study) should be chosen to suit the investigation aim. Second, gold particles lying on compartments must be counted on all sampled fields. Thus, the numerical frequency distribution of these gold counts represents the ‘observed’ distribution of each compartment (No). Then, a convenient way of simulating a random distribution on the surface of a TEM thin section is to take advantage of fundamental stereological principles (Figure 4). They work on the assumption that test points randomly superimposed on randomly located section planes will hit compartments with probabilities determined by their relative sectional areas. The resulting spread of points that hit each compartment represents the distribution which would be expected if gold particles were scattered randomly throughout the cell. Then, the corresponding expected gold distribution of any given compartment (Ne) can be determined as follow: NeNumber of test points hitting that compartment (Tpc)x Total number of gold particles in the cell (Gp)/Total number of test points in the cell (Tp).
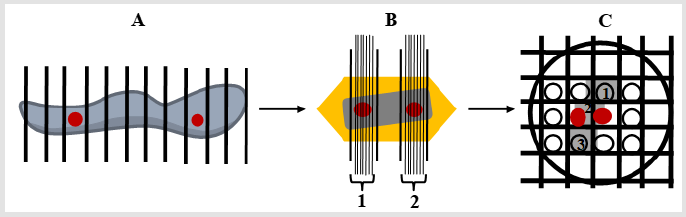
Figure 4: A. Preferential labeling for EGFR labeled by gold particles in different compartments of Fibroblast-like cells (FLCs) analyzed at T15-T60, and at T6-T24 after EGF treatment.
Ne=Tpc x Gp/Tp
From the two distributions, a relative labeling index (RLI) can be calculated for each compartment as follow: RLINo/Ne. RLI is predicted to equal to 1 when there is random labeling and greater than 1 if there is preferential labeling of any given compartment. An alternative way to obtain RLI values is to compare labeling density values (LD) of selected compartments (LDc) with the labeling density of the cell (LDcell): LDc/LDcell. LD values of each VOC can be expressed as No/Tpc while those of the cell as Gp/ Tp. Previously, it has been shown that a two-sample chi-squared (2) test with r-1 degrees of freedom is a useful statistical test of the significance between observed and expected distributions (arranged in columns), within a study group with r compartments (arranged in rows). For any given compartment, the partial 2 is calculated as (No-Ne)2/Ne. Then, total 2 (sum of partial 2 values) should be calculated to determine whether to accept or reject the null hypothesis (of no difference between distributions or that distribution of gold particles is random) for r-1 degrees of freedom. It should be taken into account that this analysis its valid if compartments associated with 1–5 of predicted gold particles (Ne) comprise no more than 20% of the studied compartments and that no Ne value should be <1. If the observed and expected distributions are different, then preferentially labeled compartments can be identified as previously described [2]. Two criteria have been established that should be fulfilled: firstly, the RLI value must be >1 and secondly, the corresponding partial 2 value must account for a substantial proportion of total2 (at about 10%).
Preferential labeling for EGFR in VOC within FLCs: Table 1 show an example showing the application of this approach to quantify EGFR immunolabeling within different compartments of fibroblast-like cells (FLCs). In this study ultrathin sections of granulation tissue were incubated with anti-EGFR mouse IgG monoclonal antibody followed by gold-labeled (15 nm) anti-mouse IgG. All sections were stained and analyzed by TEM as described elsewhere [8] (Figure 4). The example in Table 1 is from a DFU sample obtained at a late time point after EGF treatment (T6). To test whether the observed distribution of gold particles between compartments within a cell is random or not, various VOC were selected for this study. Consequently, gold particles were counted in each cell compartment (No) [endoplasmic reticulum (ER) and Golgi complex (GC) (ER+GC), mitochondria (M), rest of cytoplasm (RC) (included all residual compartments in cytoplasm not of individual interest) and nucleus (N)] using the ImageJ 1.48v software (Website: rsb.info.nih.gov/ij/). Then, a lattice of test points was superimposed on each cell compartment and hit points were counted (‘Test points’, Tpc) in each compartment using the ImageJ 1.48v software as shown in Figure 4. Ne (i.e. random distribution) and RLI for each compartment were calculated as described above.
Table 1 illustrates a two-sample 2 analysis with two columns (No and Ne) and ¨r¨ compartments (arranged in rows) used to compare No and Ne from a FLC analyzed at T6. This is representative of the analysis performed at later time points (T6-T24) after EGF treatment to detect preferential labeling of compartments in a single group of cells (FLCs in this work) (Figure 5A). For the dataset shown in Table 1, the total 2 value is 21.17 and, for 3 degrees of freedom, the probability level is P<0.001. This means that the null hypothesis (of no difference between distributions or that the observed distribution of gold particles is random) must be rejected. Both ER+GC and mitochondria fulfilled the criteria for deciding on preferential labeling of a compartment described above, as they showed RLI values >1 and their corresponding partial 2 value accounted for more than 10% of total 2 (Table 1).
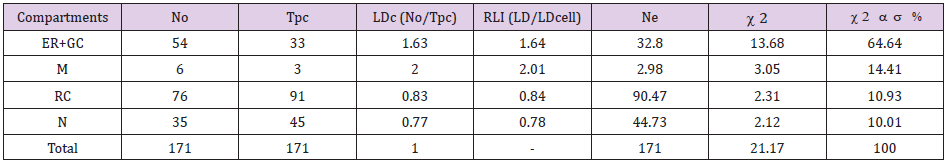
Table 1: Relative labelling index (RLI) for EGFR labeled by gold particles in different compartments of a Fibroblast-like cell (FLC) analyzed at T6 after EGF treatment.
Note: For total chi-squared (2) = 21.17 and degrees of freedom (df)=3 (2-1 columns by 4-1 rows), P<0.001, so the distribution pattern of gold particles is significantly different from random. There is preferential labeling of ER+GC (RLI=1.64 and 64.64% of the total 2) and mitochondria (RLI=2.01 and 14.41% of the total 2). No: Observed gold particles; Tpc: Test Points; LDc: Labeling density of each compartment; LDcell: Labeling density of the cell; Ne: Expected distributions of gold particles. Endoplasmic reticulum (ER); Golgi complex (GC); Mitochondria (M); Rest of Cytoplasm (RC); Plasma membrane (PM); Nucleus (N).
On the other hand, Figure 5A also illustrates the preferential labeling for EGFR labeled by gold particles in different compartments from the groups of FLCs analyzed at T15-T60 and at T6-T24 after EGF treatment. Results are shown only for those compartments satisfying the criteria for preferential labeling. Note that while ER+GC was predominantly labeled in the FLCs studied from T15-T60, ER+GC and mitochondria showed preferential labeling at later times of EGF treatment (T6-T24).
Approach 2: To compare the observed numbers of gold particles on compartments in different cell groups or experimental groups. The aim of this method is to test whether the distribution of gold particles across compartments alters in different groups of cells. The first step would be to choose a set of compartments appropriate to the study aim (VOC in this work). The second step would be to count gold particles on all randomly sampled FOVs from all randomly selected samples for each study group. Importantly, in this case there is no need to take account of compartment size. The numerical frequency of these particles for each compartment represents the No. Then, the observed gold counts can be analyzed by means of a contingency table analysis with ¨g¨ groups (arranged in columns) and ¨r¨ compartments (arranged in rows) that will generate predicted gold particles (Ne) and, hence, partial 2 values, for each group and each compartment. As stated in method 1, compartments associated with 1–5 of predicted gold particles should comprise no more than 20% of the studied compartments and no expected value should be <1. Examination of the total 2 value, for (g-1) x (r-1) degrees of freedom, will indicate whether the gold labeling distributions are different. If they are different, examining the partial 2 values (using the 10% cut-off) will identify the compartments which contribute with a substantial proportion of total 2 (at about 10%).
Testing for Shifts in Compartment Labeling for EGFR in FLCs Taken at Different Times After EFG Treatment: To compare the distribution of EGFR immunolabeling in various compartments of FLCs at different times after treatment with EGF (early T15-T60 and late T6-T24 times), a contingency table analysis was used (Table 2). The null hypothesis of ‘no difference of gold distributions between FLCs at different times after treatment´ was tested. Thus, a contingency table (g columns x r rows) was created (Table 2). In this analysis, Ne for each compartment of FLCs at a specific time were calculated from the product of a column total [total gold particles observed in all cell compartments for FLCs analyzed at a determined time point (T15-T60 or T6-T24)] and a row total [total gold particles observed in a selected compartment of all FLCs analyzed at different time points (T15-T60 and T6-T24)] divided by the grand total (total gold particles observed in all compartments, in all FLCs). For example, Ne (ER+GC) at T15-T60 (236.62) was calculated as follow: total No at T15-T60 (951) x total No for ER+GC at T15-T60 and T6-T24 (473) divided by the grand total (1901). Corresponding partial 2 values and total 2 were calculated as shown above.
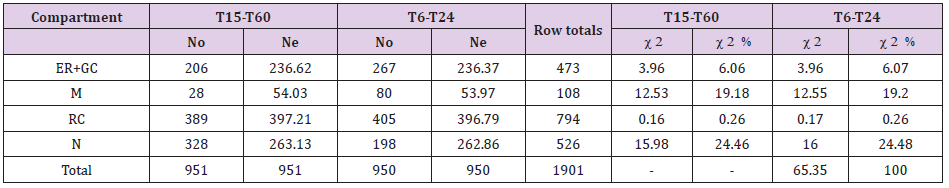
Table 2: Observed and expected distributions of gold particles in organelle compartments of Fibroblast-like cells (FLCs) obtained from T15 to T60 (T15-T60), and from T15 to T60 (T6-T24) after treatment with EGF and calculation of chi-squared () values in contingency table analysis.
Note: For total chi-squared (2) =65.35 and degrees of freedom (df)=3 (2-1 columns by 4-1 rows), P<0.001, (contingency table analysis). So, the null hypothesis (no difference between labeling distributions obtained at different time points) must be rejected. Compartmental 2 values indicate that the major contributors to the difference were the nucleus (24.46% of the total 2) and mitochondria (19.18% of the total 2) at T15-T60; nucleus (24.48% of the total 2) and mitochondria (19.20% of the total 2) at T6- T24. No: Observed distributions of gold particles; Ne: Expected distributions of gold particles. Endoplasmic reticulum (ER); Golgi complex (GC); Mitochondria (M); Rest of Cytoplasm (RC); Nucleus (N).
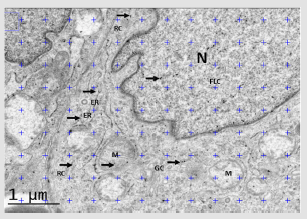
Figure 5A : A. Preferential labeling for EGFR labeled by gold particles in different compartments of Fibroblast-like cells (FLCs) analyzed at T15-T60, and at T6-T24 after EGF treatment. Values of c2 expressed as % (c2 as %) are shown for those cellular compartments meeting the two criteria for preferential labeling: 1) Relative Labeling Index (RLI) greater than 1, and 2) partial c2 values make substantial contributions to the total, >10%. For degrees of freedom (df)=3 (2-1 columns by 4-1 rows), and total c2 values of: T15-T60: c2=13.14, P<0.01; T6-T24: c2=74.02, P<0.001; so the distribution patterns of gold particles is significantly different from random. At T15-T60, ER+GC (RLI=1.45 and 59.45% of total c2); and at T6-T24, ER+GC (RLI=1.45 and 59.45% of total c2) and mitochondria (RLI=1.33 and 10.63% of total c2) showed preferential labeling. c2: chi-squared values. c2 %: chi-squared values expressed as percent. Endoplasmic reticulum and Golgi complex (E); Mitochondria (M); Rest of Cytoplasm (C); Nucleus (N).
For the dataset shown in Table 2 groups are represented by FLCs analyzed at T15-T60 and at T6-T24. Note that for this approach statistical handling can be distorted by large discrepancies in the total numbers of observed gold particles between groups. So, to get similar column sums for total gold counts in each group of cells as shown in the example (Table 2), gold particle counts from the original work were normalized to yield totals of roughly 950 per group. Total 2 for these two groups is 65.35 and for 3 degrees of freedom, the probability level is P<0.001. Therefore, the null hypothesis of no difference in distributions between groups can be rejected.
Analysis of partial 2 values revealed that the nucleus and mitochondria compartments were responsible for the difference (Table 2 & Figure 5B). Data indicate a shift in gold labeling of EGFR from the early to late times after EGF therapy. Thus, fewerthan- expected gold particles were detected in mitochondria while more-than-expected immunogold labeling was shown in nucleus at T15-T60 (Table 2 & Figure 6B). Interestingly, at T6-T24, a shift in labeling showed more-than-expected gold particles in mitochondria and less-than-expected EGFR immunolabeling in the nucleus. This analysis supports the intracellular trafficking of the EGFR from nucleus at T15-T60 to mitochondria at T6-T24.
Nevertheless, a disadvantage of this approach is its limited ability to permit mechanistic interpretations of shifts in labeling patterns [12,16,17]. Thus, a compartment might contain many particles due to either its large size or because it is a small compartment with a high density of particle localization. In such situations, it is recommended to complement these results with the RLI analysis [12] In the EGFR study reviewed here, preferential labeling of EGFR in mitochondria at T6-T24 supports findings of approach 2 showing accumulation of EGFR in mitochondria at later times after EGF infiltration. Therefore, these evidences strongly point to the shift in compartment labeling for EGFR in FLCs analyzed at different times after EFG treatment.
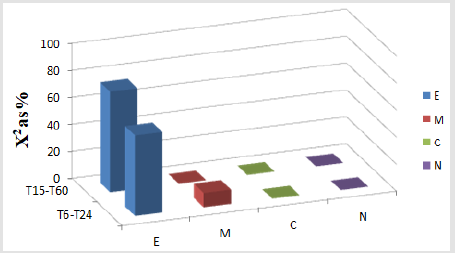
Figure 5B : Ratios of No/Ne are shown for those cellular compartments contributing to differences between labeling distributions obtained at different time points that were analyzed by contingency table analysis. Negative values represent No/Ne ratios below 1. Note that FLCs at T15-T60 have fewer-than-expected gold particles at mitochondria (No/Ne ratio 2 0.52; 19.18% of total 2) and more-than-expected gold particles in nucleus (No/Ne ratio 2 1.25; 24.46% of total 2) while FLCs analyzed at T6-T24 have more-than-expected gold particles at mitochondria (No/Ne ratio 2 1.48; 19.20% of total 2) and fewer-thanexpected gold particles in nucleus (No/Ne ratio 2 0.75; 24.48% of total 2). Endoplasmic reticulum and Golgi complex (E); Mitochondria (M); Rest of Cytoplasm (C); Nucleus (N).
Conclusion
Development of rigorous sampling, stereological estimation and statistical evaluation procedures have strengthened quantitative analysis of IEM images [12]. EGFR is a multifunctional regulator in various subcellular organelles including plasma membrane, cytoplasm, mitochondria and nucleus [18]. Different roles of EGFR may depend on its subcellular localization and specific cellular microenviroment. By applying the methodology described in this review to the study of intracellular dynamics localization of EGFR, we have recently described that intralesional EGF therapy induces the activation and nuclear translocation of EGFR in FLCs early after EGF administration (8). Further characterization of distributions of immunogold labelling for EGFR at later times after EGF treatment showed increased labeling of EGFR in mitochondria and decreased immunolabeling in nucleus. These findings suggest that EGFR´s functions in nucleus prevailed at early times while they predominated in mitochondria at later times following EGF infiltration. The use of the two quantitative methods described here demonstrated that they complement each other, thus supporting their value for the study of intracellular signalling pathways of therapeutic value in vivo.
Acknowledgment
None.
Conflict of Interest
No conflict of interest.
References
- Mayhew TM, Lucocq JM (2008) Developments in cell biology for quantitative immunoelectron microscopy based on thin sections- A review. Histochem Cell Biol 130: 299-313.
- Mayhew TM, Lucocq JM, Griffiths G (2002) Relative labelling index: A novel stereological approach to test for non-random immunogold labelling of organelles and membranes on transmission electron microscopy thin sections. J Microsc 205: 153-164.
- Armstrong DG, Cohen K, Courric S, Bharara M, Marston W (2011) Diabetic foot ulcers and vascular insufficiency: our population has changed, but our methods have not. J Diabetes Sci Technol 5(6): 1591-1595.
- Morbach S, Furchert H, Groblinghoff U, Hoffmeier H, Kersten K, et al. (2012) Long-term prognosis of diabetic foot patients and their limbs: amputation and death over the course of a decade. Diabetes Care35(10): 2021-2027.
- Berlanga-Acosta J, López-Saura P, Guillen-Pérez I, Guillen-Nieto G, Acevedo-Castro B, et al. (2013) Type 2 Diabetes Mellitus (T2DM): Biological Overview from Pathways to Organelles and its Translation toward a Torpid Wound Healing Process. J Diabetes Metab 4(7): 285.
- Brownlee M (2005) The pathobiology of diabetic complications: a unifying mechanism. Diabetes 54: 1615-1625.
- Berlanga-Acosta J, Schultz GS, Lopez-Mola E, Guillen-Nieto G, García-Siverio M, et al. (2013) Glucose Toxic Effects on Granulation Tissue Productive Cells: The Diabetics Impaired Healing. BioMed Res Int 2013: 15.
- Falcón-Cama V, Fernández-Mayola M, Mendoza-Mari Y, Acosta-Rivero N, García-Ojalvo A, et al. (2016) Epidermal Growth Factor based Therapy Promotes Intracellular Trafficking and Accumulation of its Receptor in the Nucleus of Fibroblasts from Diabetic Foot Ulcers. J Diabetic Complications Med. 1(3): 111.
- Berlanga-Acosta J (2011) Diabetic lower extremity wounds: the rationale for growth factors-based infiltration treatment. Int Wound J8(1742-481X (Electronic)): 612-620.
- Buckley A, Davidson JM, Kamerath CD, Wolt TB, Woodward SC (1985) Sustained release of epidermal growth factor accelerates wound repair. Proc Natl Acad Sci USA 82(21): 7340-7344.
- Yu FS, Yin J, Xu K, Huang J (2010) Growth factors and corneal epithelial wound healing. Brain Res Bull 81(2-3): 229-235.
- Mayhew TM (2015) Quantitative immunocytochemistry at the ultrastructural level: A stereology-based approach to molecular nanomorphomics. Cell Tissue Res 360(1): 43-59.
- Mayhew TM, Lucocq JM (2015) From gross anatomy to the nanomorphome: stereological tools provide a paradigm for advancing research in quantitative morphomics J Anat 226: 309-321.
- Gundersen HJG, Jensen EB, Kieu K (1999) The efficiency of systematic sampling in stereology reconsidered. J Microsc 193: 199-211.
- Mayhew TM (2008) Taking tissue samples from the placenta: An illustration of principles and strategies. Placenta 29: 1-14.
- Borjigin G, Yamamoto S, Sugiyama T, Nishiumi T, Suzuki A (2006) Changes in the immunogold electron-microscopic localization of calpain in bovine skeletal muscle induced by conditioning and high-pressure treatment. Biosci Biotechnol Biochem 70: 1249-1254.
- Schmiedl A, Ochs M, Muhlfeld C, Johnen G, Brasch F (2005) Distribution of surfactant proteins in type II pneumocytes of newborn, 14-day old, and adult rats: An immunoelectron microscopic and stereological study. Histochem Cell Biol 124: 465-476.
- Han W, Lo HW (2012) Landscape of EGFR signaling network in human cancers: Biology and therapeutic response in relation to receptor subcellular locations. Cancer Lett 318(2): 124-134.
