 Mini Review
Mini Review
In this paper, the author analyzes and outlines the physical characteristics of glucoses which can be used to understand and predict their moving direction, trend, and magnitude. Therefore, healthcare professionals can help diabetes patients to control their disease conditions and its complications.
Methods
Since 5/5/2018, the author utilized both finger-piercing and test strip (Finger) and continuous glucose monitoring device (Sensor) to collect his glucose data in parallel. He has collected four glucose data per day via Finger and 75 times via Sensor. By 10/18/2019, within a total of 532 days, he has collected 46,816 data which include finger glucose, sensor glucose, carbs/sugar intake amount, walking steps, and weather temperature. He then performed various tasks including glucose decomposition, data segmentation, and synthesis analyses by using those collected data to get the following conclusive and useful information.
Result
Part 1: Glucose Waveforms (1-4)
Figure 1 depicts glucose patterns comparison (daily average, FPG, and PPG) between finger and sensor. The low correlation coefficients between finger and sensor for daily glucose, FPG, and PPG (-32%, 25%, and 23%) indicate that they have no similarity at all, even the average glucose values have significant deviations, except FPG.
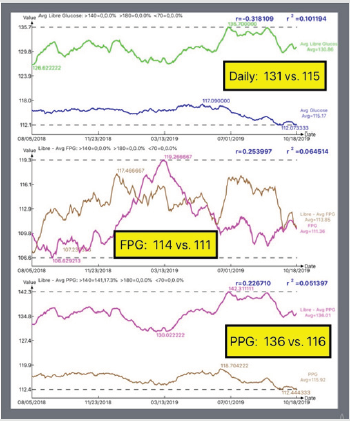
Figure 1: Comparison between Finger and Sensor (Daily glucose, FPG, & PPG).
From Figure 2, FPG waveform looks like a “salad bowl” with its bottom occurring approximately from 3am to 5am, while PPG looks like a mountain with its peak at 60 minutes after the first bite of meal (not the conventional knowledge of two hours afterwards). The synthesized daily Sensor glucose waveform is a continuous curve with a big valley at the beginning (FPG), followed by three mountains (PPG), and ending with a relatively flat plain (pre-bed without snacks or fruits).
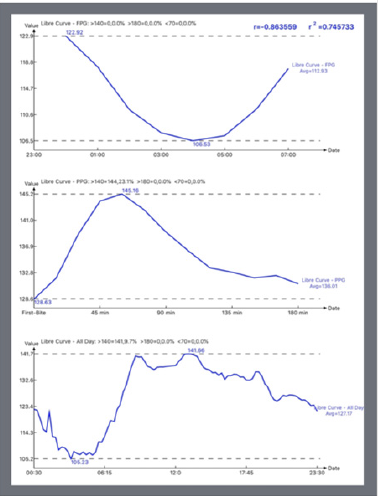
Figure 2: Synthesized FPG, PPG, and Daily Glucose.
Part 2: Daily 7 Glucose Segments
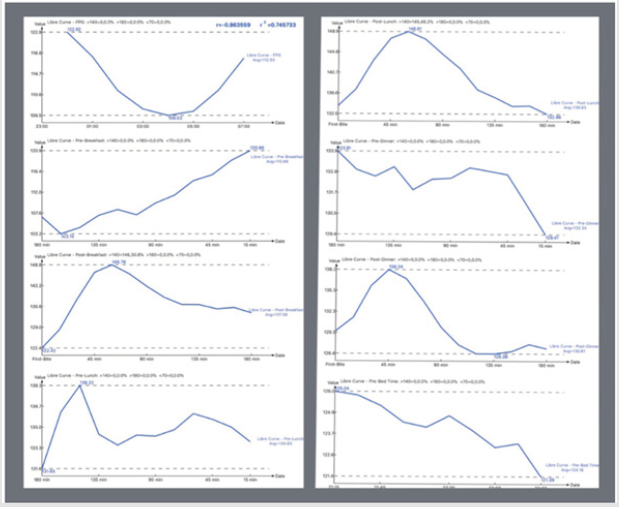
Figure 3: 7 glucose segments.
Figure 3 shows the daily glucose waveform’s seven segments. It starts with FPG (00:30-07:45) which partially overlapped with prebreakfast (05:00-07:45), followed with breakfast, pre-lunch, lunch, pre-dinner, dinner, and ending with pre-bed. The average glucose values are included in each diagram.
Part 3: Daily Synthesized Sensor Glucose Data and Curve
Figures 4 & 5 displays two daily Sensor glucose fluctuations: one using customized software and the other using Microsoft Excel from the tabulated data in the middle.
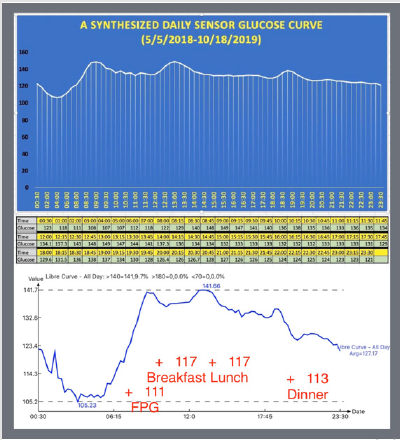
Figure 4: A synthesized daily glucose curve including 7 segments.
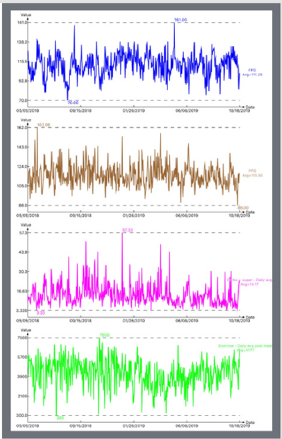
Figure 5: Finger FPG, PPG, and carbs/sugar intake with walking steps.
Part 4: Finger Glucose Data Plus Daily Carbs/Sugar Intake and Post-Meal Walking Steps
The average Finger daily data are:
PPG: 116 mg/dL
FPG: 111 mg/dL
Carbs/sugar: 14.2 grams
Walking per meal: 4,177 steps
Part 5: Conversion Factors Between Carbs/Walking and PPG Figure 6 shows a few calculated analysis results:
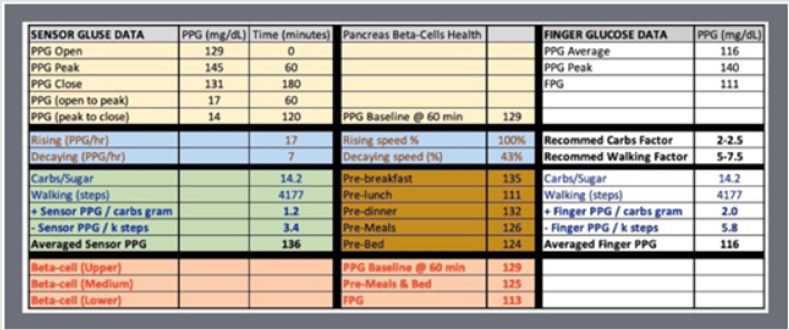
Figure 6: Important information from the glucose study.
(5-1) Sensor PPG:
Average Sensor: 136 mg/dL
Peak Sensor: 145 mg/dL
Rising speed: 17 mg/dL per hour
Decaying speed: 7 mg/dL per hour (43% of Rising speed)
See Figure 5:
Carbs/Sugar intake: 14.2 grams
Post-meal walking: 4,177 steps
PPG vs. Carbs/sugar conversion:
+1.2 mg/dL per gram
PPG vs. 1,000 steps conversion:
-3.4 mg/dL per 1,000 steps
(5-2) Finger PPG:
Average Finger: 116 mg/dL
See Figure 5:
Carbs/Sugar intake: 14.2 grams
Post-meal walking: 4,177 steps
PPG vs. Carbs/sugar conversion:
+2.0 mg/dL per gram
PPG vs. 1,000 steps conversion:
-5.8 mg/dL per 1,000 steps
(5.3) Pancreatic beta cells health state:
Upper bound (Baseline of PPG): 129
Medium range (Pre-meals/bed): 125
Lower bound (FPG): 113
Conclusion
There are a lot of vital information concealed in glucoses. As long as we learn how to decompose and analyze them, we can examine and reveal many hidden facts and useful hints on how to help diabetes patients to control their condition and its complications. Truly knowing glucose is the very first step in understanding diabetes. Lifestyle management, including diet and exercise, are equally important in controlling this disease; therefore, patients should not immediately accept the belief that taking multiple medications as its only solution since they can control diabetes symptoms effectively but cannot cure this disease.
Competing Interests
The author declare that they have no competing interests.
References
- Hsu Gerald C (2018) Using Math-Physical Medicine to Control T2D via Metabolism Monitoring and Glucose Predictions. Journal of Endocrinology and Diabetes 1(1): 1-6.
- Hsu Gerald C (2018) Using Signal Processing Techniques to Predict PPG for T2D. International Journal of Diabetes & Metabolic Disorders 3(2): 1-3.
- Hsu Gerald C (2018) Using Math-Physical Medicine and Artificial Intelligence Technology to Manage Lifestyle and Control Metabolic Conditions of T2D. International Journal of Diabetes & Its Complications 2(3): 1-7.
- Hsu Gerald C (2018) Using Math-Physical Medicine to Study the Risk Probability of having a Heart Attack or Stroke Based on Three Approaches, Medical Conditions, Lifestyle Management Details, and Metabolic Index. EC Cardiology 5(12): 1-9.
