 Research Article
Abstract
We have experimentally investigated the orientational ordering in a magnetic dispersion of cylindrically shaped γ-Fe2O3 nanoparticles in cyclohexanone, using small angle neutron scattering in the presence of both shear flow and a magnetic field. The shear rate ranged from 0 to 4000 s−1, and the vertical magnetic field was varied from 0 to 180 Oe. The anisotropy in the small angle scattering clearly shows the orientational order of nanoparticles. The order in the shear flow can be described by the Onsager orientational distribution function, whereas the order in the field can be described by the Maier-Saupe orientational distribution function. The order parameter S shows that orientational order appears in the dispersion when the field is ≥ 80 Oe. At higher fields of 120 to 180 Oe, we find evidence for the formation of large-scale clusters at low shear rates ∼ 1s−1, followed by a break-up of these clusters into smaller-scale clusters at intermediate shear rates 420 s−1, and a final state of shear induced orientational order at high shear rates ∼550- 4000s−1. These results show that the nanoparticles exhibit three different types of nematic order depending on the combination of the applied magnetic field and shear stress.
Keywords: Magnetic Nanoparticles; Magnetorheological Fluids; Small Angle Scattering; Magnetic Data Storage; Magnetogenetics
PACS Numbers: PACS: 82.70.-y, 75.50. Mm, 83.50. Ax, 28.20.Cz
Introduction
Magnetic dispersions of nanoparticles have applications in magnetic data storage devices such as magnetic tapes and disks. These dispersions are known to have complex rheological and mechanical properties in the presence of shear flow in magnetic fields [1]. Especially, rodlike ferromagnetic nanoparticles are more suitable for magnetic data storage applications because they offer the possiblity of additional control of orientation due to their shape anisotropy [2-5]. During manufacturing of magnetic tapes the dispersions are subjected to shear flow for coating and a magnetic field for aligning the nanoparticles. Thus, there is a need to understand the orientational ordering of nanoparticles with size polydispersity. A quantitative measure of the orientational ordering of nanoparticles as a function of shear rates and applied magnetic field, together with a theoretical basis to understand the hydrodynamic behavior of nanoparticles in the dispersions, is essential for the development of better magnetic tape and disk storage media.
Biofunctional nanoparticles are of interest for magnetic control of cellular processes with applications in nano- and regenerative medicine [6,7]. In magnetogenetics, magnetic fields are used in conjection with targeted biofunctional nanoparticles to trigger molecular stimulai at distance. Research on magnetomechanical stimulation is reported using 300 nm iron oxide nanoparticles with a coating of antibodies in a magnetic flux density of 25-120mT [8]. Magneto-biochemical stimulation sutdies are conducted using 100nm iron oxide nanoparticles with a 10 nm polymer and carboxylic acid shell in a magnetic flux density of 150mT [7]. γ-Fe2O3 nanoparticles embedded in organic and inorganic matrices are attracting interest in magnetic hyperthermia and in vitro osteoblast cell studies [9]. Further research on the magnetic control of nanoparticles such as how the size polydispersity affects the nanoparticle orientation is desirable for a better understanding of field distributions and field gradients.
Small Angle Neutron Scattering (SANS) combined with a Couette shear cell is a proven technique for investigating shear induced ordering, alignment and breakup in complex fluids such as cylindrical micelles in solution [10]. Earlier SANS experiments on Fe metal nanoparticle dispersions showed that a small field of 180 Oe and a shear flow of 4000s−1 can alignrodlike Fe metal nanoparticle (mean particle length of 200 nm and a mean diameter of 25nm) dispersions with size polydispersity [11,12]. A quantitative measure of the degree of orientational order of nanoparticles in a shear flow and magnetic field can be obtained by applying the Onsager theory and Maier-Saupe theory of liquid crystals. A mean-field theoretical analysis has shown that Brownian motion, anisotropic hydrodynamic drag, a steric potential, and magnetic dipolar interaction all play roles in the orientational ordering of nanoparticles [13,14]. γ-Fe2O3 nanoparticle-based materials are of interest in the magnetic data storage industry [15].
In this study, we investigate the orientational ordering of γ- Fe2O3 nanoparticles with an average particle length of 300nm and average diameter of 50nm with size polydisersity, in a dispersion with cyclohexanone as solvent. SANS experiments were performed with a dispersion of 5% volume fraction of γ-Fe2O3 nanoparticles in cyclohexanone in a Couette shear flow and an imposed vertical magnetic field. This paper is organized as follows. The properties of γ-Fe2O3 nanoparticles and the SANS experiment are briefly described in Experimental. The SANS experimental results, data analysis and the discussion of results are presented in Results and Discussion. Finally, a summary of the present SANS investigation is given in Conclusion.
Experimental
Magnetic dispersion with a 5% volume fraction of accicular cobat modified γ-Fe2O3 nanoparticles in cyclohexanone were prepared using a method similar to that described in the literature [16]. To inhibit aggregation, Polyvinylchloride copolymer (Nippon Zeon MR110, Mn = 12000) containing 0.7 wt.% SO4 and 0.5 wt.% OH functional groups was used as the wetting resin [11]. The amount of the copolymer used in the dispersion was about 8% of the weight of the nanoparticles. The resin introduces a shortrange repulsion between the particles. The acicular cobalt modified γ-Fe2O3 magnetic nanoparticles have an average length of 300 nm, average diameter of 50nm including a polymer shell, and a size poly- dispersity. The particles are ferromagnetic with a coercivity of ∼683 Oe and a saturation magnetization of ∼85 emu/g. The cobalt content in our dispersion is ≤ 0.05 vol. %. For brevity, we refer to these particles as γ-Fe2O3 particles. Small angle neutron scattering from the dispersions was measured using the 30m NG3 SANS instrument at the NIST Center for Neutron Research, Gaithersburg, Maryland (Figure 1).
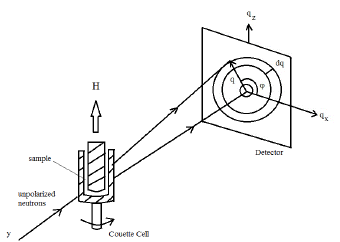
Figure 1: Small angle neutron scattering experimental setup showing the geometry of the Couette cell, the neutron beam, the netron detector and the direction of the applied magnetic field.
The experimental set up consists of a Couette shear cell in the radial geometry and with shear flow in the x-direction [17] and a Helmholtz coil that produces a magnetic field of 180 Oe along the z-direction, i.e., perpendicular to the plane of shear flow. The gap in the Couette shear cell was set to 0.5mm. The Couette shear cell consists of an inner quartz cylindrical stator with an outer diameter of 60mm for 0.5mm gap and an outer quartz cylindrical rotor with an inner diameter of 61mm. Approximately, 11ml sample volumefills the .5mm gap in the cell. A schematic of the experimental setup is shown in Figure 1 Neutrons of 0.6 nm wavelength and a sample-to-detector distance of 13.1 m were chosen to produce values of the horizontal scattering vector q = 4πsinθ/λ, where θ is the scattering angle, in the range of 0.044 to 0.34 nm−1. The shear rate γ˙ is given by ∂vx/∂y, where vx is the flow velocity. Neutrons were incident on the sample along the y-direction. The magnetic field is applied along the vertical (z)-direction, i.e., in the vorticity direction. Scattered neutrons were detected in the x-z plane by an area-sensitive detector. SANS measurements were performed under a range of experimental combinations of shear flow and/or magnetic field.
The shear rate was increased with the beam on. The shear rate was increased contineously between each set of measurements and the rate was held constant for each measurement duration of ∼10min with about 1 min waiting time so that the nanoparticle dispersion could relax to the new state. For each measurement, the SANS intensity data were collected as two-dimensional contour plots in the qx - qz plane. Each data set was corrected for detector background, detector sensitivity, scattering from the empty cell, and transmission. The intensity was scaled to absolute units of cross-section per unit volume as is done in conventional SANS data reduction [18]. We define ψ as the angle between the direction of the scattering vector q and the positive x-axis. The scattered neutron intensity I(ψ), which is a function of the azimuthal angle ψ, is obtained by integrating the scattered neutron counts at the magnitude of the scattering vector q = 0.08 nm−1, with a dq = 0.0045nm−1, using the NIST SANS data reduction program [18]. I(ψ) was first obtained for different values of the scattering vector and compared.
Qualitatively, they are the same for all q values, with an oscillatory intensity when there is orientational order in the dispersion. We chose q = 0.08nm−1 because it yields better azimuthal resolution in addition to a higher signal-to-noise ratio. I(ψ) thus obtained has two contributions, one is the scattering by the nanoparticles and the other is scattering in the solvent. The contribution from the solvent is isotropic and does not depend on either the shear rate or magnetic field. Note that 75% of the scattering length density contrast of the iron atoms arises from the nuclear contribution and the remaining 25% arises from the magnetic contribution [19,20]. Since the magnetic moment and the magnetization easy axis of the particle are both expected to be along its long axis, their contributions give a measure of the orientation of the particles in the dispersion.
Results and Discussion
Scattering Vector Dependence of SANS Intensity - Particle Size Estimate
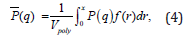
In general, the scattering intensity I(q) is proportional to the SANS differential cross- section as given by [21]:
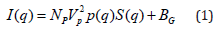
where NP is the number density of the scattering centers, VP is the volume of one concentra- tion center, P(q) the particle form factor (or shape factor), S(q) is the inter-particle structure factor, and BG is a constant background. Therefore, I(q) contains information on the shape, size, and interaction(s) between the scattering centers in the dispersion. By modelling P(q) and S(q) one can obtain information on the particle sizes and the interparticle interactions, respectively. The magnetic contribution is zero on average because the particles are randomly oriented. In a dispersion with a volume fraction of 5 % γ-Fe2O3 particles, there may be a small contribution from the structure factor. However, this contribution is expected to be important only at lower q values. Here we are mostly interested in the high q range where we can model the scattering intensity with the form factor. Therefore, for high q, dilute particles concentrations, and randomly oriented particles, the structure factor S(q) at high q can be taken as unity. For cylindrically shaped core shell particles of length L, core radius r, and shell thickness t, the single particle form factor is given by [22]
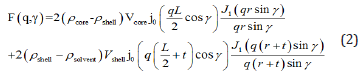
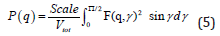
where γ is the angle between the cylinder axis and the scattering vector q. Here Vcore= πr2L is the volume of the particle core, ρcore is the neutron scattering length density (nSLD) of the core, ρshell is the nSLD of the shell which is a polymer, ρsolvant is the nSLD of the solvent, j0(x) = sin(x)/x, and J1(x) is the first order Bessel function of x. Polydispersity of the radius p of the particles is defined as (< r2 > − < r >2)/ < r >. The scattering intensity is calculated by first doing an orientational average over the cylinder form factor, which is then averaged over a log-normal distribution of the cylinder radius r [18]. Polydispersity in particle size results in damping of the oscillations in the form factor at high q values [22-24]. The polydispersity of radius p is thus included by integrating the cylinder form factor, P(q), over a log-normal distribution of cylinder radius. The integration is normalized by the second moment of the radius distribution. The scattering intensity per unit volume is given by
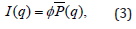
where ϕ is the particle volume fraction, and P (q) is the size averaged form factor. P (q) is given by
where P (q) is the orientation-averaged form factor of a cylinder of length L and radius r [10, 25–29], f(r) is the log-normal distribution of the radius, and Vpoly is the polydospersity volume. P(q) is given by
where Scale is the proportionality factor, Vtot=π(r + t)2(L + t) is the volume of the core and the shell, with t being the shell thickness. The best fit to this model, displayed as a solid line in Fig. 2, yields the diameter 2r = 24.4 ± 2 nm, length L = 315 ± 30 nm, a shell of ∼10 nm, and the polydispersity of radius p ∼ 0.44. The size of the particles estimated from SANS is comparable to the average sizes (2r ∼ 50 nm, and L ∼ 300 nm) of the particles and suggests that the selected q-range is sensitive to ordering of various sizes of the particles in the distribution.
Shear Induced Orientational Ordering
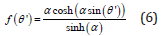
The application of shear in the experiment results in the orientational ordering of nanoparticles along the flow direction, which is in the horizontal plane. This order can be described by a nematic phase similar to that of liquid crystals and other rodlike structures [30]. In the nematic phase the nanoparticles exhibit long range orientational order but no translational order. To describe the nematic order, we chose the preferred direction to be the vorticity direction in the shear flow, which is the same as the direction of applied magnetic field, i.e. the z-axis, that is defined as the director. We define the angle between the particle long axis and the director as θ′. The nematic order is often characterized by the orientational distribution function (ODF) f (θ′), which is a single-particle distribution function and describes the distribution of orientations of the particles about the director. For the nematic order of nanoparticles in the dispersion, the Onsager orientational dis- tribution function [31] can be written as:
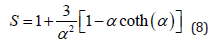
where α is the distribution parameter. Then the nematic order parameter S of a system is given by
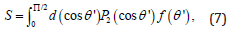
where P2(x) is the Legendre polynomial of variable x. Combining Eq. 6 and Eq. 7 and integrating, we get an analytical expression for S as
We use the approach of Savenko and Dijkstra for determining the nematic order parameter S and orientational distribution function from small angle scattering [12,32]. In this approach, the small angle scattering intensity as a function of the angle ψ, which is the angle with the positive qxaxis of the SANS 2D plot, can be related to the ODF f (θ′) using the Leadbetter formula [33-36]. Here qx is parallel to the x-axis in our notation as in Ref. 8. If we consider the Onsager ODF defined above for f (θ′), then we get:
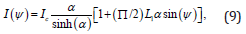
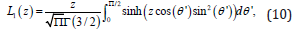
where L1(z) is the modified Struve function of z of order 1, and is defined as [36]
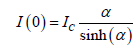
where Ic is a proportionality constant. The intensity at ψ=0 is given by
We define the shear rate increasing cycle as the set of measurements in which the shear rate of a particular scan was higher than the shear rate of the previous scan. Similarly, the shear rate decreasing cycle is defined as the set of measurements in which the shear rate of a particular scan was lower than that of the previous scan.
Figures 1- 3 shows the azimuthal angle dependence of the neutron scattering intensity I(ψ) in the dispersion at four selected shear rates in the range of 0 s−1 to 4000 s−1, with zero-applied magnetic field. The intensity is isotropic when the dispersion is at zero shear rate because the particles are randomly oriented in the absence of an external torque. When the shear rate is increased to 310 s−1, the nanoparticles tend to align in the flow and the scattering intensity develops an anisotropy along the qz direction with sinusoidal oscillations which have maxima at ψ = 90◦ and 270◦. The anisotropy in the intensity is a clear indication of the orientational order of nanoparticles and thus the formation of a nematic phase. With increasing shear rate, the amplitude of the oscillations increases monotonically.
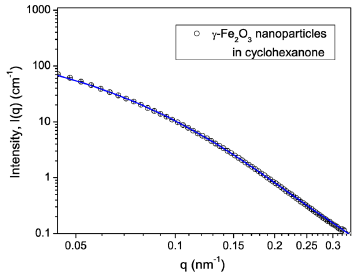
Figure 2: (Color online) SANS intensity I(q) dependence upon the scattering vector q in 5 vol.% γ-Fe2O3 nanoparticle dispersion. The error bars are equal to one standard deviation. The solid line is the best fit using the form factor of core-shell cylinders with polydispersity in the radius defined by Eq. (1)-(5).
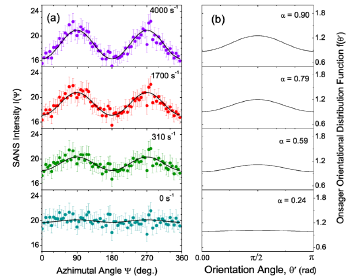
Figure 3: (Color online) (a) SANS intensity I(ψ) at various shear rates. The solid line is the best fit by the azimuthal angle dependence of scattering intensity defined by Eq. (9). (b) Onsager orientational distributions for the best fit values of α for the data shown in panel (a).
The solid lines in Figure 3(a) are best fits using Eq. (9). Figure 3(b) shows the plot of the Onsager orientational distribution corresponding to the α value given by the best fit of the intensity to Eq. (9). The Onsager orientational distribution parameter α and the order parameter S are displayed in (Figures 4a & 4b) respectively, for both the shear rate increasing cycle and for the shear rate decreasing cycle. Both α and S increase sharply with increasing shear rate below a few hundred s−1, and then tend to show a lower increase when the shear rates are in the thousand s−1 range. α reaches a value of 0.9 and S a value of 0.05 at the highest shear rate of 4000 s−1, considered. The values are marginally higher in the shear rate decreasing cycle, indicating that the orientational disorder is not completely reversed with the decrease of the shear rate.
Orientational Ordering in a Magnetic Field and Hysteresis
In the absence of shear flow, the orientational distribution of particles induced by the magnetic field can be described by the orientational distribution function of uniaxial fer- romagnetic particles [35], which is similar to the Maier-Saupe orientational distribution function [32,34]:
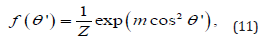
where m is a parameter that gives a measure of the orientational distribution of the particles and Z is the normalization constant such that π/2 dθ′sinθ′f (θ′) =1. From this normaliza- tion, we obtain the relation between Z and m as
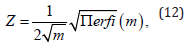
where erfi(x) is the imaginary error function of variable x. Then the nematic order parameter S of a system is given by
where P2(x) is the Legendre polynomial of variable x. The small angle scattering intensity as a function of angle ψ, the angle with the positive qx-axis of the SANS 2D plot is related to the Maier Saupe ODF f (θ′) by the following equation [34]:
where Ib is the q independent scattering contribution and erf(x) is the error function of variable x. Note that the SANS experiments were always performed with a steady shear flow. Combining Eq. 11, Eq. 12, Eq. 13 and integrating, we get an analytical expression for S in the case of magnetic field induced orientational order as
When the dispersion is in an applied magnetic field, the steric interaction and the dipolar interaction between the magnetic particles are expected to contribute to the orientational order. Our SANS experiments with the 5% γ-Fe2O3 in cyclohexanone dispersion in the field clearly show anisotropy in the qz direction, indicating the alignment of nanoparticles in the vertical direction in real space. (Figures 4) to 11 show the results of orientational distribution parameter m, and order parameter S, obtained by fitting the I(ψ) for an applied field H = 20 to 180 Oe, using Eq. 14. This orientational order in the dispersion in the magnetic field can be described as a nematic phase with vertical arrangement of the nanoparticles. Experiments on the dispersion in both the field increasing cycle and field decreasing cycle were conducted under conditions of zero shear rate to investigate the field dependence of the orientational order. Figure 5 shows the SANS intensity as a function of azhimuthal angle for H = 60 Oe and H = 180 Oe in the field increasing cycle, and for H = 60 Oe in the field decreasing cycle. A clear hysteresis is observed in the SANS intensity with the onset of order with the field ≥ 80 Oe in the field increasing cycle, which is retained in the field decreasing cycle all the way to a zero-applied field H. The m values returned by the best fit to Eq. 14 are 1.33 ±0.05 at 180 Oe, 1.2 ±0.05 at 60 Oe (decreasing cycle), and m ∼ 0 at 60 Oe (increasing cycle).
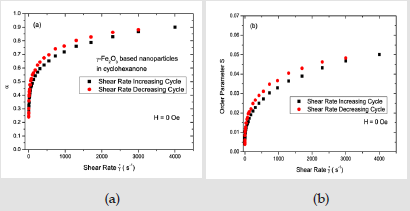
Figure 4: (Color online): Shear rate dependence of (a) the Onsager distribution parameter α and(b) order parameter S in 5 % volume fraction γ-Fe2O3 nanoparticle dispersions with zero-applied field.
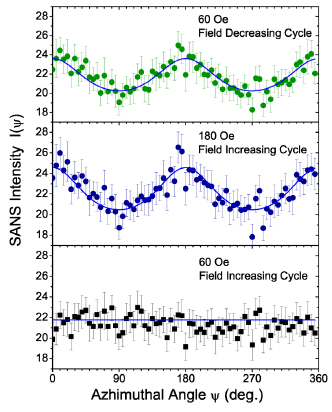
Figure 5: (Color online): SANS intensity I(ψ) in the field increasing cycle at 60Oe and 180 Oe, and in the field decreasing cycle at 60 Oe at zero shear rate.
The scattering intensity at all field values can be fit with Eq. (14). The orientational distribution parameter m and the order parameter S extracted from the best fits are shown in Figure 6 as a function of applied magnetic field. In the field increasing cycle, the anisotropy is negligible below a characteristic field value of ∼60 Oe. Therefore, there is no evidence for orientational order in the dispersion. The anisotropy in the scattering appears at a field strength of ≥80 Oe in this cycle. The anisotropy of the scattering intensity increases with the field as the number of particles ordering parallel to the field increases. The order parameter S increases with further increasing of the applied field and saturates at a value of about 0.19 with a field of 180 Oe. The values of the order parameter S in the field when H ≥ 100 Oe in the field increasing cycle and H >0 the field decreasing cycle) are larger compared the highest value of the order parameter S ∼ 0.5 found at the highest shear flow rate of 4000 s−1 is indicative of both ordering of more particles as well as agglomeration of particles in the presense of the magnetic field.
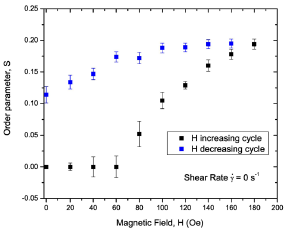
Figure 6: (Color online): Order parameter S dependence of the magnetic field at zero shear rate.
The particle volume fractions used in our dispersions are much lower than the necessary value of 50% for phase separation in the dispersion of particles having an aspect ratio of 7 and does not support the agglomeration through steric interaction [37]. Agglomeration occurs in our dispersions through magnetic dipolar interaction, as the dispersion has a small volume fraction of acicular (needle-like) magnetic particles. Magnetic interactions can lead to the formation of anisotropic aggregates with the antiferromagnetic ordering of magnetic particles at small volume fractions [38]. Agglomeration based models can explain the field induced ordering of nanoparticles in magnetic fluids [39]. The loss of order in a zerofield and that below ∼80 Oe in the field increasing cycle can be attributed to the antiferromagnetically aligned agglomerates. We believe that the agglomeration process occurring in our dispersions is driven by magnetic interactions, in particular the dipolar interaction.
The irreversibility of the order parameter with the field indicates that the particles mutually induce dipole moments even when the magnetic field is reduced to zero, and then attractive forces between the particles dominate over the repulsive forces. The attractive forces between the particles support the possibility of antiferromagnetically aligned agglomerates at zero or near zero fields. The applied magnetic field flips the alignment of particles from an antiferromagnetic to ferromagnetic configuration in some of the agglomerates and this results in a higher degree or ordering, and thus the increase of the order parameter S with the magnetic field. The hysteresis in the order parameter S with the field indicates that the particles mutually induce dipole moments even when the field is reduced to zero and attractive forces dominate over the repulsive forces. The attractive forces between the particles gives rise to antiferromagnetically aligned agglomerates at zero or nearzero fields.
Orientational Order in a Shear Flow and a Magnetic Field
Figure 7 shows the MaierSaupe orientational distributional parameter m and the order parameter S for shear rates less than 10s−1. Taking the uncertainty into account, we note that both m and S are approximately zero, suggesting the lack of orientational order in a field of 40 Oe. As the shear rate is increased, we find that both α and S increase gradually and reach 0.9 and 0.049, respectively. These values indicate orientational order of nanoparticles in the horizontal plane. Figure 8 displays m, α, and S values as a function of shear rate in a field of 80 Oe. When the applied field is increased to 80 Oe, m increases to 1.3 and S increases to 0.19 at zero shear rate. These values show that a field of 80 Oe is strong enough to induce a significant amount of orientational order in the vertical direction in the dispersion. The order in the field is maintained up to a shear rate of 100 s−1.
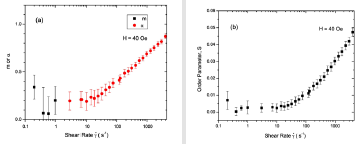
Figure 7: (Coloronline): Distribution parameters m and α, and order parameter S as a function of shear rate in a field of 40 Oe.
When the shear rate is further increased, the particles align in the horizontal plane as indicated by the increasing trends found in the α and S values, which reach ≈0.9 and ≈0.05, respectively, at the highest shear rate of 4000 s−1. Figure 9 shows m, α, and S values as a function of shear rate in a field of 120 Oe. We find that m and S continue to increase with increasing field. For example, m is close to 1.75 and S is about 0.26 when the shear rate is 0.2 s−1. When the shear rate is increased, we see a two-step drop in m and S values; a steep decrease between the shear rates of 0.2 and 1 s−1, followed by a gradual decrease between the shear rates of 1 and 240 s−1. We suggest that the steep decline seen in m and S is due to changing sizes of large-scale clusters of nanoparticles such as chains and other anisotropic shapes. The gradual decrease of m and S with shear rates between 1 and 240 s−1 may be associated with alignment of small-scale clusters of nanoparticles. When the shear rate is 240 s−1, order in the dispersion is completely lost, resulting in random orientations. At shear rates greater than 240 s−1, the orientational order develops in the horizontal direction as the particles align in the shear flow.
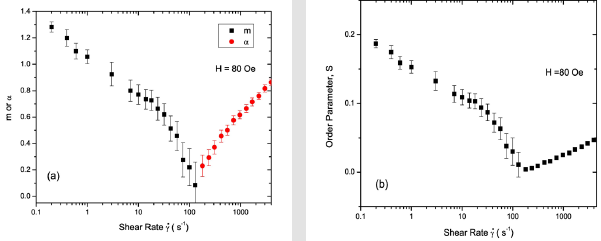
Figure 8: (Color online): Shear rate dependence of distribution parametersmand α, and order parameter S in a field of 80 Oe
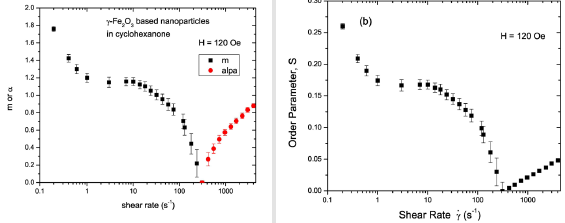
Figure 9: (Color online): Shear rate dependence of orientational distribution parameters m and α, and order parameter S in a field of 120 Oe.
The α and S values found at the highest shear rate of 4000 s−1 in a field of 120 Oe are the same as those observed in the field of 80 Oe, suggesting that the field at this shear rate has almost no effect on the degree of orientational order in the dispersion. Figure 10 shows the SANS intensity as a function of ψ in the nanoparticle dispersion with an applied field of 180 Oe, for selected shear rates between 0 and 420 s−1. The panels on the right display the Maier- Saupe orientational distribution function for the m values given by the best fit to Eq. 13. Figure 11 shows the SANS intensity versus ψ plot for selected shear rates between 970 and 4000 s−1. The panel on the right shows the Onsager oreintational distribution parameter α given by the best fit to Eq. 9. Figure 12 displays the shear rate dependence of m, α, and S values for the applied field of 180 Oe. The order parameter S is ∼0.28 at a shear rate of 0.2s−1 in 180 Oe, which is ∼27% higher than the S value found at the same shear rate in 120 Oe.
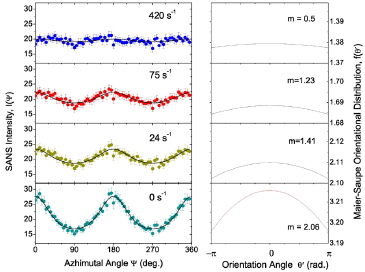
Figure 10: (Color online) Left: SANS intensity I(ψ) in a field of 180 Oe. The error bars are equal to one standard deviation. The solid line is the best fit to the ψ dependence of scattering intensity using the Maier-Saupe orientional distribution of nanoparticles, defined by Eq. (13). Right: Maier- Saupe orientional distributions for the best fit values of m.
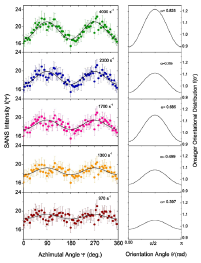
Figure 11: (Color online) Left: SANS intensity I(ψ) as a function of shear rate. The error bars are equal to one standard deviation. The solid line is the best fit by the ψ dependence of scattering intensity using the Onsager orientional distribution of nanoparticles defined by Eq. (13). Right: Onsager orientational distributions for the best fit values of α.
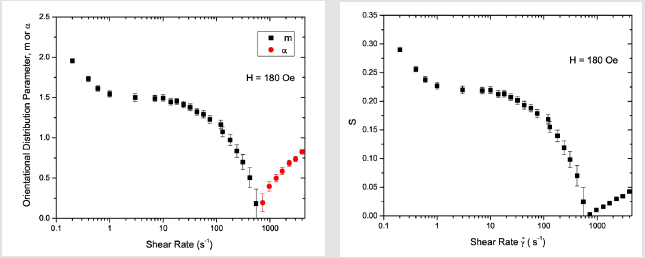
Figure 12: (Coloronline): Shearrate dependence of orientational distribution parameters morα and order parameter S in 5% volume fraction γ-Fe2O3 nano particle dispersion sinafield of 180 Oe.
The values of m and S in 180 Oe at any given shear rate are also relatively higher than those found in 120 Oe, but the trends in the shear rate dependence of these parameters are similar to those found in a field 120 Oe. The relatively higher S values below a shear rate of 1s−1 in 180 Oe may be attributed to further increasing trends of clustering of nanoparticles or more anisotropic shapes such as elongated chains at a higher magnetic field. The ratio of field induced order to shear induced order cross-over takes places at a shear rate of about 420 s−1, which is higher compared to the crossover shear rate in 120 Oe. As in the case of the 120 Oe field data, we find the ordering of large- scale clusters below a shear rate of 1 s−1 and the ordering of smaller scale clusters above this shear rate.
Conclusion
Shear and magnetic field induced orientational ordering of cylindrically shaped and 5% vol. fraction Co doped γ-Fe2O3 nanoparticles, dispersed in cyclohexanone, is investigated using small angle neutron scattering (SANS). Analysis of the anisotropy in SANS intensity shows that a higher degree of orientational order can be achieved in a magnetic field when the field is larger than 80 Oe. The larger size of the γ-Fe2O3 particles (∼300 nm in length) as compared to Fe metal particles (∼200 nm in length) [11,12] seems play a role in the higher degree of alignment and order in the magnetic field. When the dispersion is sheared together with an applied magnetic field (120 Oe or higher) in the vorcivity direction, we find a two-step transition from field induced order to shear induced order. We suggest that the complex structures of nanoparticles such as chains occur at the origin of the first transition at a shear rate of ∼1s−1. At higher shear rates, the chains are likely to break down into smaller sized clusers and orient in the shear flow. We hope that the present work will stimuate new research to further investigate the clustering of particles in magnetic field, for example using SANS combined with the polarization analysis of the scattering intensity. Onsagar or MaierSaupe orientational distribution functions, which are used in the present analysis, have been designed for describing uniaxial symmetries. Future work can also explore an analysis of orientational order of magnetic nanoparticles using less symmetric distributions.
Funding
Oak Ridge National Laboratory is managed by UT-Battelle, LLC, for the US Department of Energy under the Contract No. DEAC05- 00OR22725. This project was supported by United States Department of Energy through grant number DE-FG02-02ER45966, and National Science Foundation Materials Research Science and Engineering Center program through grant DMR-0213985. This work was based in part on activities supported by the National Science Foundation under Agreement No. DMR-9986442.
Complainace With Ethical Standards
On behalf of all the authors, the corresponding author declares that there is no conflict of interest.
Acknowledgements
We would like to acknowledge Dr. L. Porcar and Dr. B. Hammouda for help during the SANS experiments.
References
- Odenbach S (2004) Recent progress in magnetic fluid research. J Phys Condens Matter 16: R1135.
- Jubert PO, Alighieri G (2012) Micromagnetic modeling of particulate tape media with increasing perpendicular orientation. J Appl Phys, Begell House, New York.
- Berkovsky BM (Ed.) (1996) Magnetic Fluids and Applications Handbook, Begell House, New York.
- Larson RG (1999) The Structure and Rheology of Complex Fluids. Oxford University Press, New York.
- Roskov KE, Atkinson JE, Bronstein LM, Spontak RJ (2012) Magnetic field-induced alignment of nanoparticles in electrospun microfibers. RSC Advances 2: 4603-4607.
- Monzel C, Vicario C, Piehler J, Coppey M, Dahan M (2017) Correction: Magnetic control of cellular processes using biofunctional nanoparticles. Chem Sci 8(12): 7330-7338.
- Hoffman C, Mazari E, Lallet S, Le Borgne R, Marachi V, et al. (2013) Static and dynamic balance performance in patients with osteoporotic vertebral compression fracture. Nat. Natechnol 26(2): 199-205.
- Rotherham M, El Haj AJ, (2015) Remote Activation of the Wnt/β-Catenin Signalling Pathway Using Functionalised Magnetic Particles. PLoS One 10: e0121761.
- Ramos Guivar JA, Morales MA, Litterst FJ (2020) Ceremics International 46: 10658-10666.
- Lin MY, Hanley HJM, Sinha SK, Straty GC, Peiffer DG, et al. (1996) Phys. Rev. E, 53: R4302.
- Krishnamurthy VV, Bhandar AS, Piao M, Zoto MI, Lane AM, et al. (2003) Phys Rev E 67: 51406.
- Krishnamurthy VV, Mankey GJ, He B, Piao M, Wiest JM, et al. (2008) Orientational Distributions and Nematic Order of Rodlike Magnetic Nanoparticles in Dispersions. Phys Rev E 77(3): 031403.
- Bhandar AS, Wiest JM (2003) Monodomain dynamics for rigid rod and platelet suspensions in strongly coupled coplanar linear flow and magnetic fields. J Colloid and Interface Sci 257: 371-382.
- Bhandar AS, Piao M, Lane AM, Wiest JM (2003) J Colloid and Interface Sci 268: 246-257.
- Chakrabarti S, Mandal SK, Chaudhuri S (2005) Cobalt doped γ-Fe2O3 nanoparticles: Synthesis and magnetic properties. Nanotechnology 16: 506-511.
- Lee YS, Chae BS, Lane AM, Wiest JM (2003) Colloids and Surfaces A: Physiochem and Eng Aspects. 224: 23-31.
- Straty GC, Muzny CD, Butler BD, Lin MY, Slawecki TM, et al. (1998) The Los Alamos Neutron Science Center neutron rheometer in the cone and plate geometry to examine tethered polymers/polymer melt interfaces via neutron reflectivity. Nucl Inst Meth Phys Res A 408: 511.
- Kline SR (2006) Reduction and analysis of SANS and USANS data using IGOR Pro. J Appl Cryst 39: 895-900.
- Wagner W, Wiedenmann A, Petry W, Geibel A, Gleiter H (1991) J Mater Res 6: 2305-2311.
- Shull CG, Wilkinson MK (1955) Neutron Diffraction Studies of the Magnetic Structure of Alloys of Transition Elements. Phys Rev 97(2): 304-310.
- King SM (2000) In Applications of Neutron Scattering to Soft Condensed Matter. BJ Gahrys (Ed.), Gordon and Breach, Amsterdam pp. 77-105.
- Guinier A, Fournet G (1955) Small-Angle Scattering of X-Rays. John Wiley and Sons, New York.
- Kotlarchyk M, Chen MH (1983) Analysis of small angle neutron scattering spectra from polydisperse interacting colloids. J Chem Phys 79: 2461-2469.
- Sheu EY (1992) Small-Angle X-ray Scattering Studies of Soot Inception and Growth. Phys Rev A 45: 2428-2438.
- Hayter JB, Penfold J (1984) Structural properties of the evolution of CTAB/NaSal micelles investigated by SANS and rheometry. J Phys Chem 88: 4589-4593.
- Pedersen JS, Schurtenberger P (1996) Scattering Functions of Semiflexible Polymers with and without Excluded Volume Effects. Macromolecules 29: 7602-7612.
- Pedersen JS, Schurtenberger P (1996) Cross‐Section Structure of Cylindrical and Polymer‐Like Micelles from Small‐Angle Scattering Data. I. Test of Analysis Methods. J Appl Cryst 29: 646-661.
- Truong MT, Walker LM (2002) Quantifying the Importance of Micellar Microstructure and Electrostatic Interactions on the Shear-Induced Structural Transition of Cylindrical Micelles. Langmuir 18: 2024-2031.
- Literell KC, Gallas JM, Zajac GW, Thiyagarajan P (2003) Structural studies of bleached melanin by synchrotron small-angle X-ray scattering. Photochem Photobiol 77(2): 115-120.
- Bolhuis P, Frenkel D J (1949) Tracing the phase boundaries of hard spherocylinders. Chem Phys 106: 666-687.
- Onsager L (1949) The Effects of Shape on the Interaction of Colloidal Particles. Ann NY Acad Sci P51: 627-659.
- Savenko SV, Dijkstra M (2004) Sedimentation and multiphase equilibria in suspensions of colloidal hard rods. Phys Rev E 70: 11705.
- Leadbetter A, Norris E (1979) Distribution functions in three liquid crystals from X-ray diffraction measurements. Mol Phys 38(3): 669-686.
- Davidson P (1996) Tuning Oxygen Permeability in Azobenzene-Containing Side-Chain Liquid Crystalline Polymers. Prog Ploym Sci 21: 893-950.
- Blums E, Cebers A, Maiorov MN (1997) Magnetic Fluids. de Gruyters, New York.
- Macleod AJ (1993) Numerical Evaluation of Special Functions. Mathematics of Computation 60: 735-747.
- de Gennes PG (1974) The physics of liquid crystals. Clarendon Press, Oxford.
- Cebers A (1983) Magnetohydrodynamics 19: 1.
- Morozov KI (1987) Magnetohydrodynamics 23: 37-44.
