 Research Article
Abstract
An adapted aerobic – anaerobic training ratio can improve short term VO2max, but can limit long-term improvements aerobic and the anaerobic threshold changes. Twelve (n=12) international competitive male cross-country (G1) and biathlon athletes (G2) with a median age of 23 (21–27) years old were included as study subjects. Two VO2max tests (n=2) were conducted in the study period (93 days), further approached as test 1 (T1) during day 1 and test 2 (T2) during day 93. Several training sessions were conducted over 3.800 km volume. Lack of changes regarding VT1–VT2 group values were obtained between T1–T2 tests. Yet, through an individual approach, both high aerobic (p=0.03, r =0.62, CI95%=0.04 to 0.89) and low aerobic training (p=0.04, r=-0.65, CI95% = -0.90 to -0.03) were correlated with VT in G2. No similar results were obtained in G1 training group (p>0.05). Volume training, unlike early high intensity training, induces changes over the athletes’ exercise capacity. Aerobic training will induce an improved relative oxygen consumption, while both aerobic and anaerobic training can increase peak VO2 value, when implemented during the following 30-60 training days.
Keywords: Aerobic; Anaerobic; Ski; Training; VO2
Introduction
During recent competitive activities, several questions are raised regarding the athletes’ exercise capacity and training methodology. Training activity is constantly adapted based on both volume and effort intensity changes. However, several papers had an objective to improve and generate new overcoming data regarding individual exercise capacity and training methodology improvements but few concluded new outcomes [1-3]. By comparing two different training methods, this study is not an experimental one. Conducting an experimental training methodology can be difficult in competitive senior athletes over an Olympic year, as described in our case. Starting from several relevant results [2,4] training periodization is the main long term influence factor over both cross country skiing and roller skiing performance due to continuous physiological training induced changes. Of particular importance is the lack of change over the last 15 – 20 years over individual maximal or sub maximal testing results, whereas performance has improved significantly by doubling the average speed in different stages and competitive activities [5]. Unlike other endurance sports, such as running, classic roller skiing induces a higher VO2peak and VO2max ratio, over sub-techniques, which involve a lower muscle mass use [6]. Hoogsteen et al. [7] confirmed that excess cardiac output can be measured in cross country ski and roller ski training. However, based on Sandbakk et al. [8] outcomes, the performance will benefit from VO2max value, which reaches up to 15% differences over both classical (diagonal stride, double poling with a kick, double poling and herringbone) and skating skiing (G2, G3, G4, G5) [5]. The technique is permanently adapted over the training or competition track profile, inducing frequent changes in effort intensity.
Exercise capacity is described by a greater oxygen uptake as seen in several papers, which used different training methodologies over endurance athletes [9]. According to Guth et al. [10] an enhanced cardio pulmonary capacity will represent the basic training foundation, while various factors will relate the final training or competition outcome. Along training, the main objective is to prepare the athlete for the pre competition phase in which high intensity effort will occur. Both pulmonary system, oxygen uptake and transport along cardiovascular output and skeletal muscles will influence individual performance. From a physiological perspective, pulmonary gas exchange will follow normal O2 saturation and blood pH values, whereas limiting in some cases aerobic power over physical effort. According to Holmberg et al. [11], both static and dynamic lung volumes can reach 5 to 20% improvement over training while an increased cardiovascular output will improve regulation over vascular conductance Calbet et al. [12]. As a result, the main training objective will follow similar physiological improvements, whereas Sandbakk Ø et al. [5] believe that the ability to transform metabolic energy efficiently into speed is a key determinant of performance.
General cross-country ski training consists of 700 – 850 hours of annual training, whereas more than 75% of the volume is attributive to low intensity effort, 5 – 15% to moderate intensity and 5 – 10% to high intensity effort. Even if general training data described a high aerobic volume, suggestive information over individual performance seems to relate that an improved performance is seen by conducting both moderate and high intensity effort during all season. The volume attribute to each training stage is rather adapted from one athlete to another. Further on based our hypothesis an adapted aerobic – anaerobic training ratio, with an enhanced aerobic and low anaerobic volume can improve short term VO2max, but limit long-term effect over both aerobic and anaerobic thresholds while reducing performance or relating lack of progress. Therefore our objective is to initiate several VO2 measurements and a median training monitoring period to test the current hypothesis by performing a day by day training performance analysis.
Material and Methods
A cross sectional study was conducted over June – September 2017, as representing the 2017 – 2018 season general training period. To take part and publish the current results we obtained the University Ethical Committee approval along both the athletes and the Federal Management acceptance.
Participants
To be included as study subjects, the individuals had to fulfil the following criteria: (I.) male cross country ski, roller ski or biathlon athlete, (II.) >18 years old, (III.) currently competing at professional national or international level (IV.) along general medical acceptance. Due to lower age (<18 years old) two individuals (n=2) were excluded from the study group. Twelve (n=12) competitive male cross country and biathlon athletes (n=5 vs. n=7) with a median age of 23 (21 – 27) years old were included as study subjects. As part of the methodology, the biathlon athletes were included in sample 1 (G1), while the roller skiing athletes were included in sample 2 (G2). The two samples (G1 and G2) followed a different training program over 93 days, as part of the general 2017- 2018 roller skiing training season. The main differences between G1 and G2 were related to both volume and exercise intensity. As a result sample 1 (G1) reached 3500 km volume, while sample 2 (G2) training volume was 4500 km over the study period (93 days). In both G1 and G2 groups, individual volume differences (±15%) were measured.
Measures
Two VO2max tests (n=2) were conducted in the study period. The first test (T1) was conducted during day 1 of 93 days, whereas the second test (T2) was conducted over day 93 of 93. Over the training period, several training sessions were conducted at a temperature monitored between +10 and +20°C, over a median training volume of 3.800 km (G1 + G2), in the following training intensity guidance: low aerobic training (80%), high aerobic training (15%) and anaerobic training (5% of VO2max). As illustrated in Figure 1, the athletes took part in a competitive 15 km roller skiing competition, as to conclude individual performance over three months training period.
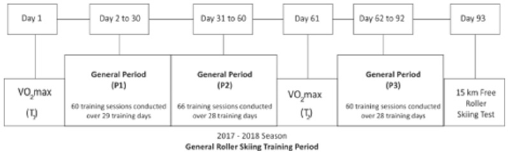
Figure 1: Study protocol illustration detailing P1 – P3 training period.
Maximal oxygen consumption test (VO2max)
The VO2max tests (T1) were conducted by applying the Bruce Maximal Testing Protocol. [13] The test was conducted through Cosmed Quark CPET equipment (Rome, Italy) and Cosmed T150 (Rome, Italy) running treadmill, during seven (n=7) different effort stages. Each stage lasted three minutes. The first testing stage (stage 1) consisted of 2.7 km speed, 5 METS, and 10% grade, while over the last stage (stage 7), a maximum running speed of 9.6 km/h, 20 METS and 22% grade was reached. The testing time depended on the athletes’ exercise capacity. Prior the VO2max analysis, the athletes performed a 20 minutes warm up, reaching 50-85% of HRmax. The main device was calibrated before each test with know O2 (16%) and CO2 (4%) concentrations, while the flow meter was calibrated in the start of each test.
During T1 and T2 test, the following parameters were assessed: VO2peak, (relative maximum oxygen consumption, ml/kg/min), VT1 (aerobic ventilatory threshold, b/min), VT2 (anaerobic ventilator threshold, b/min) along with VE (Ventilation, L/min), VCO2 (carbon dioxide production, ml/min), VE/VO2 (ventilatory equivalents for oxygen, ml/min), PetO2 (end-tidal oxygen tension, mmHg) and PetCO2 (end-tidal carbon dioxide tension, mmHg). Using VO2max test data, the following training zones were confirmed through the V slop method [14]: Warm up aerobic zone, Training Zone 1, (Z1, 45-65%); Aerobic zone, Zone 2 (Z2, 66-80%); High Aerobic, Zone 3 (Z3, 81-87%); Anaerobic, Zone 4 (Z4, 88-93%) along Anaerobic Power, Zone 5 (Z5, 94-100%) similar to Seiler and Tonnessen [15]. Effort intensity was used to confirm the athletes’ training objective. Anthropometric measurements were conducted before each test, including both body weight (kg) and height (cm), by using a calibrate scale.
Training Monitoring
Over the study period, 186 training sessions were analysed by using Global Positioning Systems, Polar V800 (Kempele, Finland), and Polar H7 Bluetooth Monitor (Kempele, Finland), as monitoring: training time (hh:mm:ss), distance (kilometres, km), heart rate (HR, b/min; % of HRmax), positive (+Dif, meters) and negative altitude gain (-Dif, meters).
15 km Skating Roller Skiing Test Course
During day 93, the athletes took part in a 15 km competitive activity. The action was held over a 4 km track placed +1300 m above sea level, with a positive gain of 148 meters and a negative gain of 69 meters per lap. The test consisted of 3.75 laps, 555 m positive difference and 258.75 m negative difference gain. The start between athletes was programed at 30 seconds intervals.
Statistical Analysis
GraphPad Prism 5.0 software was used for statistical analysis. The Standard Deviation (SD), the coefficient of variation (CV%), along with the median (median) value were used in the descriptive analysis. During the inferential statistics, D`Agostino Pearson omnibus normality test was used to obtain data normalization, while the Spearman test was applied in order to identify a correlation between two different parameters. One sample t test was used to assess the differences between T1 and T2 test parameters, while Kruskal-Wallis test was applied in order to measure the evolution over P1-P3 training period. We considered a p value<0.05 as being statistically significant, with a standard Confidence Interval set at 95% (CI95%). T1 and T2 cardiopulmonary differences were analysed as a positive or a negative percentage (+/- %) from the maximum value measured in either of the two tests. The statistical analysis was conducted by using individual G1 and G2 samples, or by using a single sample (G1 + G2), to evaluate the main exercise capacity changes, based on training differences.
Results
During T1, median body (72 vs. 73.6 kg) and height (176 vs. 175 cm) were similar in both G1 and G2 samples (p>0.05).
Athlete Training Data
Of the training volume, strength training was performed over 10.25% (409.28 minutes) whereas Trail Running 23.03% (875.14 km), Nordic Walking, 2.33% (88.54 km), Road Cycling, 17.53%, (666.14 km), Classic Roller skiing (10.83%, 411.54 km) and Free Roller skiing (35.75%, 1358.5 km) were monitored as main training activities in the main study group of G1 and G2. During 197.73 hours training the study group reached a median volume of 3.500 km and 4.500 km (G1 vs. G2) distance. Of the volume, High Intensity Training (HIT) was conducted over 3.5% (122.5 vs. 157.5 km) in G1 vs. G2. High aerobic training reached 11.63% (407.05 vs. 523.35 km) whereas 83.25% (2.913,75 vs. 3.746,25 km) were conducted over low aerobic training in G1 unlike G2. Over the training period several differences were monitored between G1 and G2 as illustrated in Table 1. The main training differences were used as performance improvement indicators.
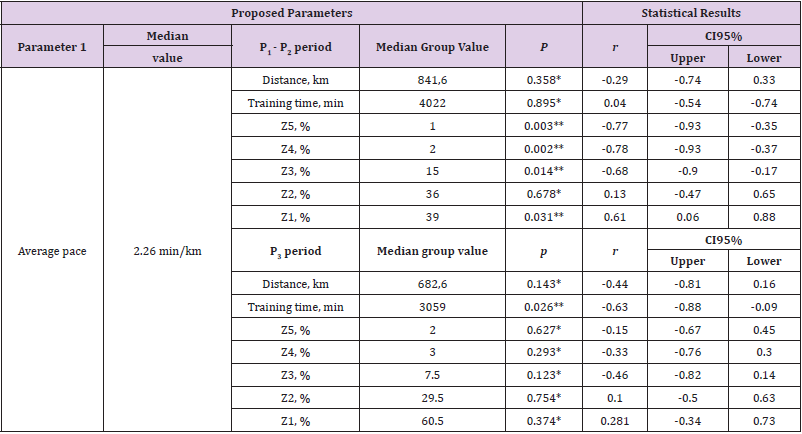
Table 1: Descriptive data over the P1 – P3 training period.
Note: P1 = training period 1 between day 1 and day 30, P2 = training period 2 between day 31 and day 60, p = probability level, p = < 0.01**, *p < 0.05, Z5 = anaerobic power training zone, Z4 = Anaerobic training zone, Z3 = High aerobic training zone, Z2 = Low aerobic training zone, Z1 = Warm up zone.
Relative VO2max changes over T1 - T2 training period
The median group VO2 value was significantly different during T2 unlike T1 measurement (69.23 vs. 79.29 ml/min/kg). The median group difference reached +8.86 ml/kg/min over T2 as against T1 result (p = 0.01). However, no significant differences (p>0.05) were monitored during T2 between G1 and G2 test results (Table 2). VO2 changes over T2 test were correlated to the training volume (p = 0.02, r=0.67, CI95%=0.119 to 0.906). The volume difference between the two samples was 22.3% in G2 vs. G1 (4500 vs. 3500 km) associating changes in peak VO2max value over G2 vs. G1 during T2 test (80.01 vs. 78.89 ml/min/kg). A higher volume along a positive difference gain in G2 (+13.430 m) was significantly correlated to VO2 (p=0.01, r=0.69, CI95%= 0.91 to 0.15). Over training specificity, during P1 – P 2 period, Cycling (20% vs. 30%) (p=0.02), Nordic walking (0 vs. 5%) (p = 0.019, r = -0.68, CI95% = -0.91 to -0.15) along skating roller skiing volume (27% vs. 25.8%) were correlated to peak VO2 value in G1 vs. G2. (p = 0.04, r= -0.60, CI95% = -0.88 to -0.01). No significant correlations were obtained over VO2peak and training intensity (p>0.05) during P1 – P 2 periods, in both G1 and G2 samples Over T2, VE was significantly correlated to training specificity. As a result, VE was significantly correlated to both classic (6%) and skating roller skiing training (26.5%) during P1 (p=0.031, r=0.64, CI95% = 0.07 to 0.89). Secondary training activities such as running and cycling failed to influences VE (p>0.05) over T2 testing, whereas carbon dioxide output was significantly correlated to VT1 (p = 0.027, r= -0.65, CI95% = -0.90 to -0.09). However, high aerobic training during P2 was significantly correlated to VCO2 and VE/ VO2 (p = 0.03, r = 0.64, CI95% = 0.07 to 0.08), while positive (p = 0.0482) and negative (p = 0.0496) difference gain were correlated to VCO2 (p = 0.027).
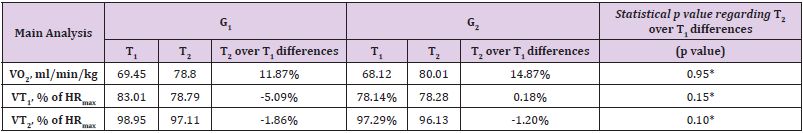
Table 2: Comparative data regarding VO2 and VT changes over T1 and T2 tests.
Note: G1 = sample 1, G2 = sample 2, T1 = VO2max test 1 over day 1, T2 = VO2max test 2 over day 63, VT1 = ventilator threshold 1, VT2 = ventilator threshold 2, p = probability level, p = < 0.01**, *p < 0.05, VO2 = maximum rate of oxygen consumption.
Ventilatory Threshold Improvement Over T1 - T2 Training Period
Lack of changes regarding VT1 – VT2 group values (G1 + G2) were obtained between T1 – T2 tests. Yet, through an individual approach both high aerobic (p = 0.03, r = 0.62, CI95% = 0.04 to 0.89) and low aerobic training (p = 0.04, r= -0.65, CI95% = -0.90 to -0.03) were correlated with the VT in G2. No similar results were obtained in G1 training group (p>0.05) as seen in Table 3. High aerobic training volume (>5%) was significantly correlated to VT1 (-2.94%) during P1 stage. As a result, both high aerobic (p = 0.020) and low aerobic (p = 0.026) training intensity were significantly correlated to VT1. As a result, minimum changes during T2 vs. T1 test results are confirmed through +0.18% vs. -5.09% in G2 vs. G1. Even though there were no significant (p>0.05) differences in VT2 values (T1 vs T2), the changes between the two tests (-1.23%) were related to other training outcomes. Among them, the anaerobic training volume was significantly correlated to VT2 values over T2 outcomes (p = 0.05, r = 0.87, CI95% = 0.56 to 0.96). Unlike volume, training intensity was of particular importance over both P1 - P2 periods, as illustrated in Table 3. P1 and P2 training volume was significantly correlated with VT1 (p=0.001). Over P1, both the number of training sessions (p = 0.39, r = -0.65, CI95% = -0.90 to -0.04) and anaerobic training volume was significantly correlated (p = 0.046) to further VT1 changes. Yet, VT2 measurement was significantly correlated to VO2 values (p = 0.01, r = 0.92, CI95% = 0.71 to 0.97).
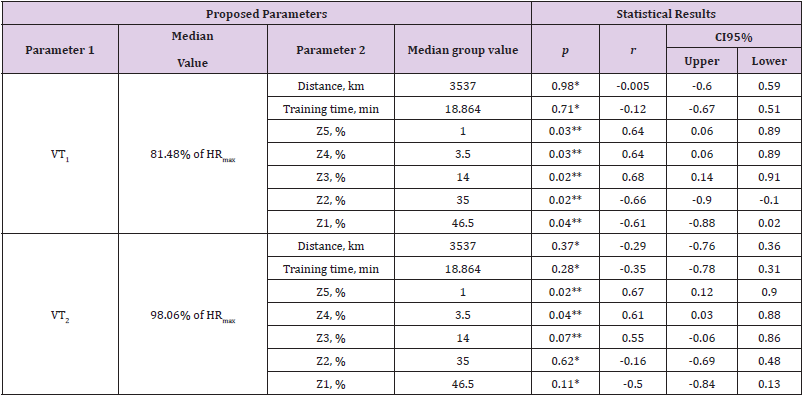
Table 3: Training intensity influence, during P1 - P2 period, over T2 results (G1 and G2).
Note: VT1 = ventilator threshold 1, VT2 = ventilator threshold 2, p = probability level, p = < 0.01**, *p < 0.05, r = Pearson productmoment correlation coefficient, CI95% = confidence interval of 95%, Z5 = anaerobic power training zone, Z4 = Anaerobic training zone, Z3 = High aerobic training zone, Z2 = Low aerobic training zone, Z1 = Warm up zone.
Competitive, High Intensity Effort Analysis
Track time was significantly correlated to the training outcomes. As a result, anaerobic – aerobic training ratio was significantly correlated to individual performance, as illustrated through average pace in Table 4. Over P1 – P 2 period, anaerobic training was correlated to the average pace unlike aerobic training which showed no significant relationship to individual performance. Further on, except for effort time, no correlations were obtained between P3 training and individual performance (p>0.05).

Table 4: Training intensity influence over high intensity roller skiing effort in the study group (G1 and G2).
Note: P1 = training period 1 between day 2 and day 30, P2 = training period 2 between days 31 and 60, P3 = training period 3 over days 62 – 92, r = Pearson product-moment correlation coefficient, CI95% = confidence interval of 95%, p = probability level, ** = p< 0.01, * = p< 0.05, Z5 = anaerobic power training zone, Z4 = Anaerobic training zone, Z3 = High aerobic training zone, Z2 = Low aerobic training zone, Z1 = Warm up zone
Discussion
Following the study outcomes, effort capacity was improved in G2 unlike G1 sample. The main improvements were related to both training intensity and volume whereas G1 training methodology focused on both high aerobic and anaerobic training volume, while improving effort capacity over G2 training methodology, which focused on high aerobic and low anaerobic volume. Based on the current findings the questions raised are related to the athletes’ exercise capacity development and metabolism adaptation in G1 and G2, as studied earlier by Sandbakk et al. [5], over both general and specific training.
Exercise Specificity
Roller skiing and biathlon exercise is performed by using similar techniques, characterised through an increased oxygen consumption and power output [16-18]. According to Hartmann et al. [4] several differences can be observed between cross country and biathlon training periods. The differences are related to training volume and intensity, due to shooting in one as against other activity. Yet, training technique will be similar. Training specificity seems to influence effort capacity based on both G2 vs. G1 performance and training outcome. Further on, Cycling, Trail Running and Nordic Walking were included as training methods in our paper, imposing an improved effect over individual performance, as against Solli et al. [2] which failed to obtain improvements in individual performance based upon non-specific training sessions. During P1, in G2 unlike G1, non-specific training methods along specific skating roller skiing resulted on an improved aerobic capacity as against classic roller skiing sessions. This approach is different to Stöggl et al. [19] who obtained an improved overall performance over classic technique training. The differences between the two methods are related to exercise intensity by influencing oxygen demand, optimal tissue oxygenation and metabolism adaptation over comparative low intensity training periods [20].
Training Methodology
Two training methods, known as the threshold-training and the polarized training [21] were used in the study methodology. Of them, the threshold training was conducted near VT2, whereas the polarized training either under or above, but not near VT2, as described earlier by Stöggl et al. [22]. Threshold training, specific applied in G2 sample, improved effort capacity, as against G1 polarized training program which consisted high volume of low aerobic activity (55 – 75% of VO2max). Physical effort capacity improvements were related to both changes in volume and high intensity training, as shown in G2 unlike G1 whereas both VO2 and VO2peak, along VT1 and VT2 improved in G2, unlike G1. Comparing both the VO2 change and the competition outcome, we can observe an improper anaerobic exercise staging, which influenced both VE, PetO2 and relative VO2 value, similar to Patel et al. [23] results, which programed both anaerobic and aerobic training over a medium training period. However, during 93 days training period, low aerobic training was correlated to a drop in exercise capacity as seen in G1 as against G2.
Aerobic power has been considered of particular importance in individual performance. As a result, the pulmonary system, along the maximum cardiac capacity, oxygen transport and skeletal muscle can influence the final outcome. As we have seen in G2 training methodology, aerobic training reached 80% of the volume, similar to Seiler et al. [21] training methodology, while encountering differences regarding anaerobic training volume. In Seiler and Kjerland paper (2006) [21], 5 to 10% of the volume was held between VT1 and VT2, whereas 15-20% of the volume increased over VT2 intensity. One similar training method, published by Stöggl et al. [19] improved exercise capacity based on anaerobic power development, as against our training methodology, in which an enhanced performance resulted of a well-adapted low - high aerobic and anaerobic effort. However, we believe that excessive sympathetic stress cannot be totally confirmed through the HR monitoring systems, and therefore important training recovery data could be unknown.
Soli et al. [2] confirmed that general aerobic power is related to high aerobic training, opposite to G1 training directions and final outcomes. High aerobic training influenced VT1 in G2, while the final competitive result was negatively correlated to high intensity training, limiting high aerobic training volume, whereas improving low aerobic volume over P1 – P2 period, without similar results in P3. The average pace during the competitive effort was influenced by both aerobic and anaerobic volume, unlike Ateş et al. [24] outcome which described 10 to 15% high intensity effort (90 - 100% of VO2max). An increased high aerobic training volume was correlated with VT1 increase in G2, unlike G1, but without any influence over individual performance during high intensity effort. As described by Holmberg [25], excess high aerobic training could have imposed excessive sympathetic stress in G2, unlike G1. An important performance drop can be described in such situations due to improper protein synthesis, while inducing cellular stimulation over preserving individual autonomic balance. However, such data was not part of the current paper results.
Limitations
Conducting a VO2max test within a group of cross country and biathlon athletes on a running treadmill, can reduce VO2peak due to lack of effort specificity, as illustrated by Losnegard et al. [26]. Cross-country skiing will represent a more important specific activity, unlike roller skiing and running. From the available data [27,28], motor-control is obtained through specific training, regardless of the sport. As a result, testing specificity will be of particular importance and if possible, further studies should measure the oxygen relative value by performing a specific cross country ski test, whereas improving the number of athletes and recovery systems, along cardio-pulmonary assessment, muscular fibre recruitment over medium – long term training.
Conclusion
Volume training, unlike early high intensity training, induces changes over the athletes’ exercise capacity. Specific roller skiing activities’ may have an important role in developing both specific strength and aerobic capacity. However, non-specific activities improved general aerobic capacity, while limiting the technical development of the athlete. Aerobic training will induce an improved relative oxygen consumption, while both aerobic and anaerobic training can impose a greater peak VO2 value, when implement over the following 30-60 training days. Therefore our hypothesis is confirmed based on the current results which confirmed that anaerobic training improve short term VO2max values, without a long term effect over both aerobic and anaerobic thresholds. Based on the current outcomes, 80% low aerobic, 15% high aerobic and 5% anaerobic volume facilitated an early effort capacity improvement in G2 unlike G1. Yet, relative oxygen consumption and anaerobic capacity will confirm the actual training capacity, through ventilation, relative oxygen consumption and ventilatory threshold assessment during specific or non-specific testing. Training periodization should sustain an appropriate balance between both volume and intensity training. However, an improved effort capacity should be further asses by using a specific method while using a larger study group.
Acknowledgment
To conduct the current research the authors used highperformance research equipment from the Centre for Advanced Medical and Pharmaceutical Research (CCAMF) - UMFST G.E. Palade Tg. Mures, Romania. Partial results of this paper are used in the first authors PhD thesis.
Conflicts of Interest
The authors declare no conflict of interest
References
- Sandbakk Ø, Sandbakk SB, Ettema G, Welde B (2013) Effects of intensity and duration in aerobic high-intensity interval training in highly trained junior cross-country skiers. J Strength Cond Res 27(7): 1974-1980.
- Solli GS, Tønnessen E, Sandbakk Ø (2017) The training characteristics of the world’s most successful female cross-country skier. Front Physiol 8: 1069.
- Tnønessen E, Sylta Ø, Haugen TA, Hem E, Svendsen IS, et al. (2014) The road to gold: Training and peaking characteristics in the year prior to a gold medal endurance performance. PLoS One 9(7): e101796.
- Hartmann H, Wirth K, Keiner M, Mickel C, Sander A, et al. (2015) Short-term Periodization Models: Effects on Strength and Speed-strength Performance. Sports Medicine 45(10): 1373-1386.
- Sandbakk Ø, Holmberg HC (2017) Physiological capacity and training routines of elite cross-country skiers: Approaching the upper limits of human endurance. International Journal of Sports Physiology and Performance 12(8): 1003-1011.
- Holmberg HC (2015) The elite cross-country skier provides unique insights into human exercise physiology. Scand J Med Sci Sport 25 Suppl 4: 100-109.
- Hoogsteen J, Hoogeveen A, Schaffers H, Wijn PFF, Van Der Wall EE (2003) Left atrial and ventricular dimensions in highly trained cyclists. Int J Cardiovasc Imaging 19(3): 211-217.
- Sandbakk O, Ettema G, Holmberg HC (2014) Gender differences in endurance performance by elite cross-country skiers are influenced by the contribution from poling. Scand J Med Sci Sport 24(1): 28-33.
- Nevill AM, Brown D, Godfrey R, Johnson PJ, Romer L, et al. (2003) Modeling maximum oxygen uptake of elite endurance athletes. Med Sci Sports Exerc 35(3): 488-494.
- Guth LM, Roth SM (2013) Genetic influence on athletic performance. Curr Opin Pediatr 25(6): 653-658.
- Holmberg HC, Calbet JAL (2007) Insufficient ventilation as a cause of impaired pulmonary gas exchange during submaximal exercise. Respir Physiol Neurobiol 157(2-3): 348-359.
- Calbet JAL, González-Alonso J, Helge JW, Søndergaard H, Munch-Andersen T, et al. (2015) Central and peripheral hemodynamics in exercising humans: leg vs arm exercise. Scand J Med Sci Sports 25(S4): 144-157.
- Badawy MM, Muaidi QI (2019) Cardio respiratory response: Validation of new modifications of Bruce protocol for exercise testing and training in elite Saudi triathlon and soccer players. Saudi J Biol Sci 26(1): 105-111.
- Beaver WL, Wasserman K, Whipp BJ (2017) A new method for detecting anaerobic threshold by gas exchange. J Appl Physiol 60(6): 2020-2027.
- Seiler S, Tonnessen E (2016) Intervals, Thresholds, and Long Slow Distance: the Role of Intensity and Duration in Endurance Training. Sportsci.org 3: 32-53.
- Starczewski M, Żmijewski P, Witek K, Klusiewicz A (2019) Physiological Aspects of Different Roller Skiing Techniques in Field Conditions. J Hum Kinet 66: 111-120.
- Stöggl T, Müller E, Ainegren M, Holmberg HC (2011) General strength and kinetics: fundamental to sprinting faster in cross country skiing? Scand J Med Sci Sport 21(6): 791-803.
- Stöggl R, Müller E, Stöggl T (2017) Do maximal roller skiing speed and double poling performance predict youth cross-country skiing performance? J Sport Sci Med 16(3): 383-390.
- Stöggl TL, Björklund G (2017) High intensity interval training leads to greater improvements in acute heart rate recovery and anaerobic power as high volume low intensity training. Front Physiol 8: 562.
- Sandbakk O (2017) The evolution of champion cross-country-skier training: From lumberjacks to professional athletes. Int J Sports Physiol Perform 12(2): 254-259.
- Seiler KS, Kjerland GØ (2006) Quantifying training intensity distribution in elite endurance athletes: Is there evidence for an “optimal” distribution? Scand J Med Sci Sport 16(1): 49-56.
- Stöggl TL, Sperlich B (2015) The training intensity distribution among well-trained and elite endurance athletes. Frontiers in Physiology 6: 295.
- Patel H, Alkhawam H, Madanieh R, Shah N, Kosmas CE, et al. (2017) Aerobic vs anaerobic exercise training effects on the cardiovascular system. World J Cardiol 9(2): 134-138.
- Ateş B, Çetin E (2017) Roller-Ski Aerobic High-Intensity Interval Training Improves the VO2max and Anaerobic Power in Cross-Country Skiers. Int J Appl Exerc Physiol 6(2): 27-33.
- Holmberg HC, Rosdahl H, Svedenhag J (2007) Lung function, arterial saturation and oxygen uptake in elite cross country skiers: Influence of exercise mode. Scand J Med Sci Sport 17(4): 437-444.
- Losnegard T, Hallén J (2014) Elite cross-country skiers do not reach their running VO2max during roller ski skating. J Sports Med Phys Fitness 54(4): 389-393.
- Fuelscher IT, Ball K, MacMahon C (2012) Perspectives on learning styles in motor and sport skills. Frontiers in Psychology.
- Stöggl R, Müller E, Stöggl T (2015) Motor abilities and anthropometrics in youth cross-country skiing. Scand J Med Sci Sport 25(1): e70-81.
