 Research Article
Abstract
In this study a novel method has been used for quantifying the arrangement of the reconstructed points of biological signals in the phase space. We use this structure as a novel biometric feature for real-time ECG identification. Most proposed methods in ECG identification are based on the reduced features derived from ECG characteristic points or simplifying calculation and increasing the classification accuracy. However, detecting characteristic points is an arduous procedure, particularly at low signal-to-noise ratios. Also, long term data or multiple leads are needed to increase the classification accuracy which seems to be impractical and time consuming. In this study, we introduce a novel method for ECG biometrics based on a geometrical method including the amplitude and phase information of one-lead ECG in the phase space portrait. This fast biometric method has high accuracy even with the presence of noise. Human identification by quantifying similarity and dissimilarity in reconstructed points of a person’s heart cycle with a single heart cycle of other people. Our results in a 33-subject group showed that threshold classification reached 99.38% and identification rate acquired 100%.
Keywords: Biometrics; Human identification; Electrocardiogram (ECG); Phase space reconstruction; Proposed method; Threshold classification
Introduction
The ECG signal is a non-invasive and cheap measurement of the heart electrical activity which is reflected as a electric potential variation on the skin. ECG analysis is a standard tool for ECG arrhythmia diagnosis. ECG signal can be used as a specific pattern for biometrics besides the other common methods such as fingerprint or xerography of iris. Identifying using the ECG is important for security since it is recorded from the body of a living creature. Designing a system based on biometrics includes two stages: suitable feature extraction from the ECG signal and using biometric algorithms for constructing classifiers for pattern recognition in the selected groups. In [1]. demonstrated the feasibility of ECGbased human identification by supervised classification over significant principal components of several morphological features including amplitudes, durations and areas of the P,Q,R,S,T waves and the ST segment. Using 12 features from one lead achieved the same number of correct classifications among 20 persons as well as using 360 (30×12 leads) features. In some reports only durations of characteristic waves and intervals between characteristic points were selected as discriminant features [2] applied discriminant analysis with two features from P duration, PQ interval, QRS duration and QT interval to identify the registered ECGs from nine subjects by selecting the smallest Mahalanobis distance. Best classification was achieved using the combination of QRS duration and QT interval [3] extracted 15-time intervals from a heart beat and further reduced feature dimension to 12 by the Wilke’s lambda method. Classification by linear discriminate analysis on 29 subjects achieved 81% heartbeat recognition rate and 100% individual identification rate [4] proposed a two-step identification scheme.
A template match method was first applied to find possible candidates. A decision-based neural network with inputs of seven temporal and amplitude features was then used to complete final verification. The experiment on 20 subjects showed 95% successful rate by template matching, 80% by neural network and 100% by combing two methods. In [5] applied quartile discriminant measurement to reduce the number of ECG features from 17 to 11, thereby achieving an identification rate of 95% for a large population (169 subjects).[6] proposed a two-dimensional heart vector determined from amplitude values of leads I–III composition. Sum of the squared distances between two heart vectors, their first temporal derivatives, and second derivatives was used to discriminate two ECGs, either from the same or from different subjects. [7] proposed a technique based on heart rate variability and some other temporal features with only a group of five subjects. A QRS complex based approach with its fourth order Legendre Polynomial as the signature is also proposed by [8] with good accuracy [9] has proposed methods using fiducial points and without fiducial points by AC/DCT technique for two groups with 13 subjects in each. Classification is done based on linear discrimination analysis and neural network-based technique. In AC/DCT method similarity between the subjects is measured based on normalized Euclidian distance and a nearest neighbor is used as the classifier. But this ECG morphology-based approach may fail when appearance of two ECGs is similar [10] use a wavelet distance measurement technique for classification of 50 subjects with accuracy 89%. In, [11] have proposed a technique for person identification by making the classification based on the similarities and dissimilarities on electrocardiogram phase space. A PCA/LDA based approach is also suggested by [12].
A non-fiducial feature-based technique is reported by [13] using spectral coefficients computed through linear predictive coding (LPC) and classification is done using neural networkbased approach. Double fold approach is proposed by [14] where the parameters of the pulse active ratio (PAR) feature vector are represented by a four-digit PIN number. Authentication is made for 20 subjects first by verifying the PIN number and finally by ECG feature vector matching. [15] have proposed a technique for individual identification based on chaotic electrocardiogram signals. Then, the root mean square, Lyapunov exponent and correlation dimension are used as the key variables in neural network training and utilized in the identification scheme. For increasing the accuracy of ECG based biometric [16] proposed analysis by data modeling. Most of the reported methods either suffers from lack of good accuracy or requires complicated mathematical procedures for processing and classification. Moreover, some of the previous works use 12 lead ECG for biometric authentication which is impractical to use in real biometric system in spite of good result. However, nearly the disadvantage of all methods reported in real time is the Lack of data or need to long data aiming the identifying individuals.
In this study, we believe that the reconstructed trajectory geometric structures include rich information for classifying signals is nonlinear. Of course, there is a lack of analytical tools to extract such information. In this paper we provide a method for quantifying the ordering of reconstructed points from biological signals in phase space and in continuation we use this structure as new biometric features by ECG. Instead of reducing the signal features extracted from the ECG, a cardiac cycle of the ECG signal in a two-dimensional phase space quantifies from each person .The reconstructed phase space can be used directly as an individual feature, that not only it maintain the main characteristics but also takes as a topology model of the ECG and just to gain R points is sufficient to reconstruct the ECG cycle and avoided to obtain the peak of T, S, Q, P. In this paper, a geometrical structure used to quantify the similarity and difference between the ECG phase space shapes. Performance of the proposed methodology, using a total of ECG data obtained from 33 patients has been investigated, and finally an offer a classification threshold with a quick and simple diagnostic algorithm.
Relevant Studies
Database and Pre-processing
To implement this study, we have used the MIT-BIH Arrhythmia Database. This database is available in Physio Net website and includes 48 ECG records of 47 subjects (records 201 and 202 are related to someone) consisting of 25 males ages 32-89 years and 22 women, ages 23-89 years. Each recording lasted about 12 hours and includes the high and low lead. Generally, in this study, were used from high lead that has more pronounced complex in appearance and each was recorded with a depth of 11 bit digital and sampled by Frequency of 360 Hz. In this study has used the 33 records having normal heart rhythm that is sinus rhythm for identification. To maintain order and geometric structures rebuilt parts, no denoising and filtering has been done on the selected ECG signal. Removing of the base and gain of machine done based on information recorder on all selected records. For simplicity of ECG signal Segmentation to the cardiac cycle the interval between two consecutive R peaks, has been considered as a complete cycle. Among the 333 selected records we extract a total of 459 cardiac cycles, among them have been selected 15 cycles of each person. However, all cardiac cycles corresponding to each record selected so that all cycles have normal heart rhythm that is sinus rhythm. Also, intuitively cycles are selected so that they have minimal deviation from the base line. Each cardiac cycle we change to 300 samples. All digital processing stages have been performed by MATLAB version (7.13.0564) R2011b [17].
ECG Phase space reconstruction with one Lead
Phase space Dimension: In this study we have reconstructed the ECG signal in the two-dimensional phase space, because the sample distribution in the 2D phase space has appropriate information for analysis and to show the distinction between different states. On the other hand, 2D phase space reconstruction can be simply analyzed with low computation therefore is faster in speed.
Phase space Time-Delay Embedding Method: There are several methods for estimating τ, whose detailed explanations were provided by small. To calculate the delay, the fact that the outer trajectories, exterior loops, in the RPS correspond to the QRS complex was considered 49. Small delay values do not allow these loops to expand, and they distribute around the y = x line. Moreover, very large values cause these loops to overlap each other. Thus, well-structured trajectories in the RPS are not available. Therefore, we used the area enclosed by the outer loops, Aloops, as a criterion for choosing an appropriate embedding delay, or reconstruction lag. The procedure for this method was as below:
Increase the reconstruction lag from an initial value equal to one (τ =1) until the first local maximum of Aloops is reached (where Aloops becomes maximum for the first time and will decline with a further increase in delay). The mean value of delay found by applying the above method on the training dataset was selected as the embedding delay. The value of the reconstruction lag obtained for our database was four [18].
Point Sequences in Phase Space: Time is implied in the phase space [19]. This means that the trajectory in the phase space has direction and therefore the samples reconstructed in the phase space will be sequential. In this study, we use the geometrical arrangement of the points so that the sequence of the points in the phase space will be considered
Planning a Problem to Quantify the Reconstructed point Arrangements from Biological Signals in the Phase Space
To illustrate the proposed method, we have used an experiment and planned a problem. We have made an experiment and have a few points on the phase plane. For example, we have 12 black points on the phase plane which belong to are first experiment and are the desirable points, 12 red points and 12 green points which respectively belong to the second and third experiments (Figure 1). The question is what criterion can be used to compare the point arrangement in the three set of points?
The point is that the similarity between each of the red and green set of points with the black set of points is studied by quantity and quality simultaneously using a geometrical method.
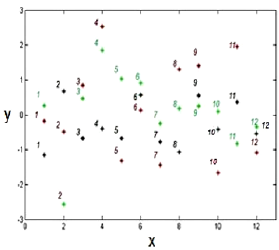
Figure 1: The produced points from three experiments and there arrangement in the phase space
The question is what criterion can be used to compare the point arrangement in the three set of points?
Proposed Method
As mentioned above, time is implied in the phase space. Therefore, in the used method the time behavior of the trajectory and the sequence of point reconstruction in the phase space have been considered and all points in the phase space have been numbered. On the other hand, having three points we can form a triangle. In the first step, between all the available points in Figure 1, black points number 1 and 2; red point 1 and green point 1 have been chosen. Connecting black points 1 and 2 with the green point as shown in Figure 2a will shape a triangle with the area S1. Connecting the same black points to the red point will shape a triangle with area S2 shown in Figure 2b. The similarity criterion is the area of each triangle. The lower the area of the triangle represents more similarity. As seen in Figure 2c, connecting the two black points to green point number 2 will form a triangle with area S1. Connecting the two black points to red point number 2 forms a triangle with area S2 as shown in Figure 2d. The next step is to connect black points 3 and 4 and the points 3 and 4 of the red and green sets. We form the triangles connecting black points 3 and 4 with the red point 3 and green point 3. Continuing to connect the two black points with red point 4 and green point 4 and calculating the area of the formed triangles. These steps are continued until all 12 points of each set have been used.
Finally summing all the areas of the green triangles (as shown in Figure 2e) and all the areas of the red triangles separately (as shown in Figure 2f) is used as the similarity criterion between the red and green points with the black points. The point in making the triangles while considering both the quantity and quality of the point arrangement is that we have the quantity and quality of the arrangement of the two desired black points 1 and 2. The third point is made by repeating an experiment and its arrangement to the two desired points is considered as a factor of distance (quantity) and angle (quality) Figure 3.
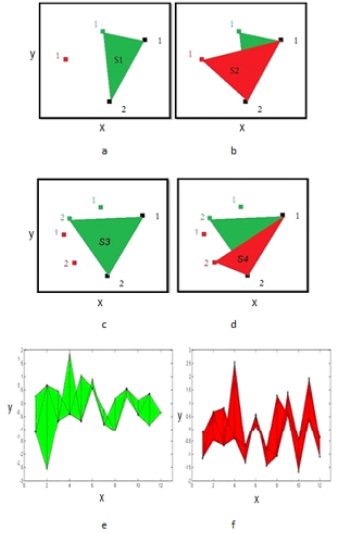
Figure 2: Shows how to form a triangle in the phase space. Figs. a, b, c and d show the arrangement for forming the triangles for the red and green points to black points (optimum points). Figs. e and f show the similarity of each series of green and red points to the black points resulted from total area of red and green triangles.
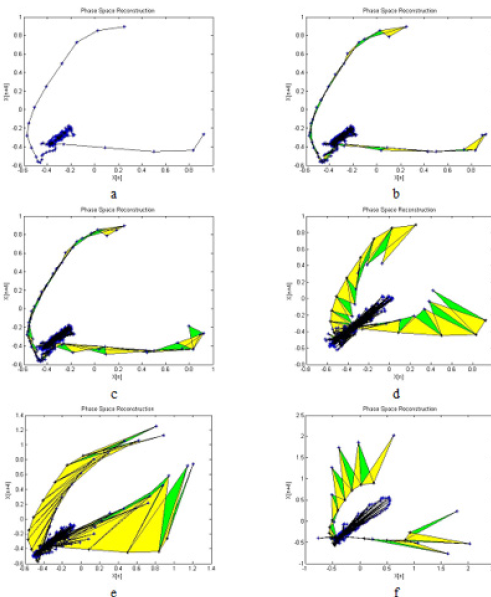
Figure 3: Shaping the triangles of six ECG cycles and the reference ECG cycle is shown Figs. a, b and c belong to accomplishing the proposed method between the reference ECG cycle of the specific person and other ECG cycles of the same person in the phase space. The most equality is obtained between the reference ECG cycle and itself which no triangle is created in the phase space. Figs. d, e and f pertain to performing the proposed method between the reference ECG cycle of the specific person and ECG cycles from 3 other people. These points shape large area triangles showing low likeness between the reference and other ECG cycles.
Using the proposed method as an ECG biometric feature
In this study, we have divided each ECG signal into heart beats containing every five distinct point of an ECG heartbeat. We only use one heartbeat of a specific person as a comparison basis in the phase space which creates is desired points. The next step is to add other subject’s ECG heart beats to the phase space. The cycles belonging to that specific person are differentiated using the proposed method with high accuracy. The important point is that the variations of each person’s heartbeat in the phase space should be individually considered. Fig. 3 shows the examples of proposed method administration in phase space.
Threshold Classification
We have achieved the highest accuracy in classifying ECG cycles using adaptive thresholding. Adaptive thresholding means that the threshold is chosen as a case dependent parameter. Our goal is to design a system for biometrics in the least possible time; therefore, we need low computation and high accuracy. We suggest an algorithm to specify the threshold for each case based on statistical characteristics extracted from the proposed method. We form a database for each subject named X containing the results from the proposed method. Each data base includes the comparison of the 5 heart cycles. The proposed algorithm for training the classifier is defined as followed:
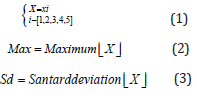
The adaptive threshold for each case is calculated from the following relationship:

K has been constant experimentally obtained is equal 2.5.
Results
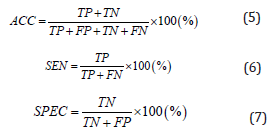
To evaluate the best classification results, we have used accuracy (ACC), sensitivity (SEN) and the specificity (SPEC) of the classifier which are calculated as below:
TP, FP, TN and TP definitions based on ECG cycle diagnosing related to a specific subject is shown in the Table 1. Table 2 refers to the mean of obtained results. Table 3 shows the names of used records, the number of personal needed heart cycles for the purpose of training, test of unit-classifier and the result of personal heart cycles classification.
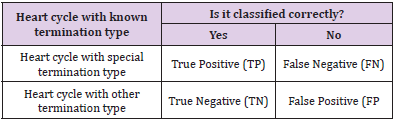
Table 1: Definitions of TP, TN, FP, and FN based on identification of a specific person’s heart cycle.
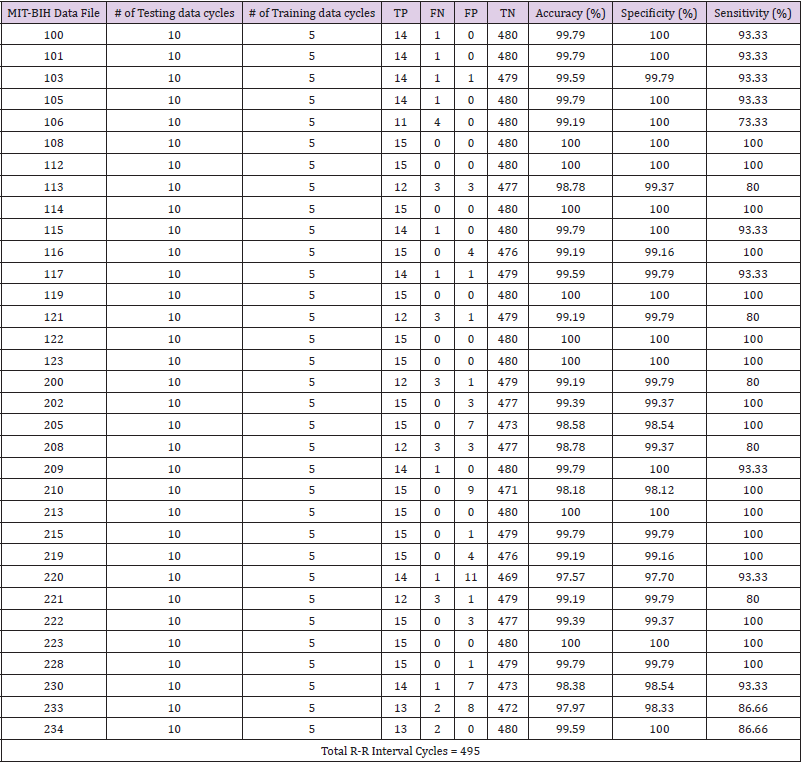
Table 2: Classification results of identifying each person’s heart cycles.
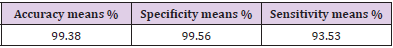
Table 3: Refers to the mean of obtained results.
Discussion and Conclusion
Mast common methods for ECG biometrics use specific points of the ECG signal. Determining these specific points with the existence of noise is difficult. The low accuracy of the classifier or complication of the classifier and computation is the main disadvantage of most reported methods. Also, some studies have used 12 leads of ECG for biometrics which reported good accuracy but seems to be impractical. Most methods used are not real-time or need long data for ECG biometrics. Reconstructing biomedical signals in phase space produces the most possible information of the output. Reconstructing biomedical signals in phase space using the reconstruction technique, a time series can be reconstructed with more dimensions so the trajectory which shows the dynamic features of the system can be analyzed. In the time domain, which is based on absolute values, only the quantity of the samples is considered whereas reconstructing the signal in phase space which is based on relativity. This method not only considers the quantity of the sample but in addition has the information of the quality of samples. Our purpose of quality means the phase information of the signal. We believe the geometrical structures of the reconstructed signals in phase space have rich information for classifying nonlinear signals although the shortcoming of analytical methods for such information can be felt. In this study, the proposed method is a novel method for quantifying the reconstructed point arrangement of biological signals in phase space considers both the quantity and quality of the arrangement. In this study we have shown the ability of ECG biometrics on the MIT-BIH Arrhythmia database. The efficiency of the mentioned method using a threshold classifier has been shown in Table 2 for 33 subjects. This structure has been chosen as a high accuracy and fast biometric feature even in the presence of noise. We have made no filtering on the signals for keeping the order and geometrical structure of the reconstructed points. Also, we offer a threshold classifier with a simple and high accuracy algorithm based on statistical characteristics.
The ability of ECG biometrics on the MIT-BIH Arrhythmia database. The efficiency of the mentioned method using a threshold classifier has been shown in table 2 for 33 subjects. This structure has been chosen as a high accuracy and fast biometric feature even in the presence of noise. We have made no filtering on the signals for keeping the order and geometrical structure of the reconstructed points. Also, we offer a threshold classifier with a simple and high accuracy algorithm based on statistical characteristics. The use of this method can be practically increased by showing the real-time distance between two consecutive R intervals. Also using a time bounded moving average can eliminate the baseline while keeping the geometrical structure in reconstructing the phase space.
References
- Biel L, Pettersson O, Philipson L, Wide P (2001) ECG analysis: a new approach in human identification. IEEE Trans Instrum Meas 50: 808-812.
- Kyoso M, Uchiyama A (2001) Development of an ECG identification system, in: Proceedings of the 23rd Annual International Conference of IEEE EMBS pp. 3722-3723.
- Israela SA, Irvineb JM, Cheng Ba, Wiederhold MD, Wiederhold BK (2005) ECG to identify individuals. Pattern Recognition 38: 133-142.
- Shen TW, TompkinsWJ, Hu YH (2002) One-lead ECG for identity verification, in: Proceedings of the 24th Annual International Conference of IEEE EMBS pp. 62-63.
- Shen TW (2006) Quartile discriminant measurement (QDM) method for ECG biometric feature selection, in: Proceedings of International Symposium of Biomedical Engineering, Taiwan pp. 10394.
- Wubbeler G, Stavridis M, Kreiseler D, Bousseljot RD, Elster C (2007) Verification of humans using the electrocardiogram, Pattern Recognition Lett 28: 1172 -1175.
- Irvine JM, Wiederhold BK, Gavshon LW, Israel S, Mc Gehee SB, et al. (2001) Heart rate variability: a new biometric for human identification. In: Proceedings International Conference Artificial Intelligence pp. 1106-1111.
- Khalil I, Sufi F (2008) Legendre polynomials based biometric authentication using QRS complex of ECG. ISSNIP pp. 297-302.
- Wang Y, Agrafioti F, Hatzinakos D, Plataniotis KN (2008) Analysis of human electrocardiogram for biometric recognition, EURASIP Journal on Advances in Signal Processing Article ID 148658.
- Chan ADC, Hamdy MM, Badre A, Badee V (2008) Wavelet distance measure for person identification using electrocardiograms. Transactions on Instrumentation and Measurement 57(2): 203-248.
- Fang SC, Chan HL (2009) Human identification by quantifying similarity and dissimilarity in electrocardiogram phase space. Pattern Recognition 42(9): 1824-1831.
- Boumbarov O, Velchev Y, Sokolov S (2009) ECG personal identification in subspaces using radial basis neural networks. In IEEE International Workshop on Intelligent Data Acquisition and Advanced Computing Systems: Technology and Applications pp. 446-451.
- Cheang Loong JL, Subari KS, Besar R, Abdullah MK (2010) A new approach to ECG biometric systems: a comparative study between LPC and WPD systems. World Academy of Science Engineering and Technology 4(8): 617-622.
- Safie SI, Soraghan JJ, Pertopoulakis L (2011) ECG based biometric for doubly secure authentication. In: 19th Europian Signal Processing Conference (EUSIPCO 2011) pp. 2274-2278.
- Chen CK, Lin CL, Chiu YM (2011) Individual Identification Based on Chaotic Electrocardiogram Signals, in: 6th IEEE Conference on Industrial Electronics and Applications pp. 1765-1770.
- Pal S, Mitra M (2012) Increasing the accuracy of ECG based biometric analysis by data modeling. Measurement 45(7): 1927-1932.
- physionet.org.
- Parvaneh S, Hashemi Golpayegani MR (2012) Predicting the spontaneous termination of atrial fibrillation based on Poincare section in ECG phase space. Proceedings of the Institution of Mechanical Engineers, Part H: Journal of Engineering in Medicine 226(1): 3-20.
- Hilborn RC (2001) Chaos and Nonlinear Dynamics: An Introduction for Scientists and Engineers, (2nd Edn.)., Oxford University Press, New York, USA.
