 Case Report
Abstract
Covid 19 became a pandemic in early 2020 and gave opportunity to investigation from an engineering prospective. The idea of aerosol particulates that carry the SARS virus was becoming increasingly more prevalent at the start of 2020 and prompted the investigation into flow characteristics of Covid 19. Information within this datum is from a wide background and develops a general understanding of the virus and how the particles flow under environment conditions. Simulation data acquired from Ansys fluent gave the opportunity to investigate the flow conditions and constraints of the novel Corina virus within this report. Transmission and mitigation of the Covid 19 under different environmental conditions were investigated with CFD simulation. Investigations were conducted with flow analysis of 5μm particulates inside a room occupied by one or two occupants with and without Airconditioning system. The results indicated that a widespread distribution is possible within classroom settings and that controlling the flow of air would prove beneficial to minimising the spread of infection.
Keywords: COVID 19, Transmission, Mitigation, Temperature, Humidity, CFD Simulation
Abbreviations: ACE2: Angiotensin- Converting Enzyme 2; UV: Ultraviolet; UVC: Ultraviolet C; DDPCR: Droplet Digital Polymerase Chain Reaction; RNA: Ribonucleic Acid; PIV: Particle Image Velocimetry ; RH: Relative Humidity; AT: Air Temperature; TCM: Tissue Culture Media
Introduction
SARS-CoV-2 (CoV-2) was first discovered in Wuhan china in late 2019 and became a worldwide pandemic in March 2020 that resulted in dramatic change to healthcare, work, retail and general lifestyle changes. Many areas of medical and public operations are prime to be vulnerable to inception of CoV-2 without critical information of the procedures and mitigation tactics that would allow for minimal virus transmission across persons. The information gathered and discussed within this document relays critical information regarding SARS-Cov2. Within the data the fundamental working principles are described and general parameters of the virus are discussed. The Information collected was gathered within the 2019-2020 period of the Cov-2 pandemic with interest to help the progression through this time period. The viruses such as coronaviruses are common throughout mammals and avian animals. Discovery of these specific types of viruses has been recorded since the early 1960s, some evidence from previous coronavirus studies will be drawn upon to fill the gaps of the new novel Sars-Cov2 coronavirus data.
Data suggests that the SARS-CoV-2 can be excreted from the body via the respiratory system and through the faecal matter of infected people. Particulates that are emitted from the lungs and emitted via sneezing and coughing, defines the parameter to collect data regarding the ranges of transmission that the virus particles can travel within an area. It is understood that the CoV-2 is emitted into the atmosphere when coughed from a person with other particulates and fluids that are normally present when coughing or sneezing. Factors of humidity and temperature are major factors in the dispersion of the virus as the lower humidity level allows for further spread of the virus and is in correlation with winter flu season data. High probability that the CoV viruses are able to be classified as airborne particles, shows that CoV-2 can survive in suspended air for a significant amount of time and be passed from person to person at distances further than 2m. Investigations of this phenomenon in relation to CoV viruses was conducted within the use of simulation software Ansys Fluent to extrapolate data and illustrate the spread of CoV2 within the report.
The goal of the simulation was to discover efficient understanding of the flow of viruses so that methods of removing the aerosol virus particles can be taken efficiently and effectively to minimise the chance of infection.
Inhalation of the coronavirus particulates is understood to be the most common method of infection, other oral methods are possible. However, this method appears to be the main contraction of SARS-CoV-2. The location of Angiotensin- Converting Enzyme 2 (ACE2) receptors are found throughout the body such as heart, kidneys, lungs and gastrointestinal tract, thus giving opportunity to viral infection. However, the data suggests that the main point of entry is within the lungs [1]. CoV-2 virus enters the respiratory system, attaching to the alveoli where the ACE2 receptors are located [2]. Documented evidence from [3] concludes that the current SARS-CoV-2 access its hosts cell through alveoli. Smaller particles of ≤ 5 μm in size will remain in suspended in air, allowing for the virions to bypass the mucociliary apparatus and proceed further into the lungs until reaching the alveoli and ACE2 receptors [4].
Virus Transition Mitigation
Negative pressure rooms are designed to be set to a lower pressure than the outside environment in order to allow the flow of air only move from the outside in, thus keeping the contaminated air within the designated zone [5]. [6] discussed the effectiveness of utilising the negative pressure system to construct zones to minimise the small particles (<2.5μm) escaping the work zone. The negative pressure reduce the particles escape from the contaminated area by 58%. Documented evidence that this can contain the spread of infectious diseases such as, measles, chickenpox, anthrax, influenza and SARS [7].
Personal Protective Equipment (PPE)
[7] extracted data from 21 studies that regarded effectiveness of face masks, the evidence shows that there is an effect on minimising the overall rate at which the infection is transmitted. Medical and N95 masks produce a significant reduction to the risk of infection. Masks for general consumers should be note that they are not an impenetrable barrier to stopping the viral infection [8]. Masks for personal home can be made from MERV 14/13 filter material to be inserted between cloth layers [9].
Electrostatic Filtration
Filtration mechanisms are diffusion, interception, impaction, gravitational and electrostatic attraction [10]. The electrostatic factor can greatly increase the efficiency of the filter, capturing aerosol particles. [11] indicated that face masks with electrostatic properties work at high efficiency for filtering out airborne particles in the range of 40μm and lower. The data within the investigation indicated that the electrostatic effect begins to weaken, resulting in an efficiency loss over time [10,11]. [9] indicates that the N95 mask has higher efficiency to maintain the charged efficiency. The method that the masks are treated for secondary use is a factor to maintaining properties of the masks. Sterilisation with alcohol removes majority of the electrostatic from the mask, heat treatment retains a large portion of efficiency of the mask as seen in Figure 1.
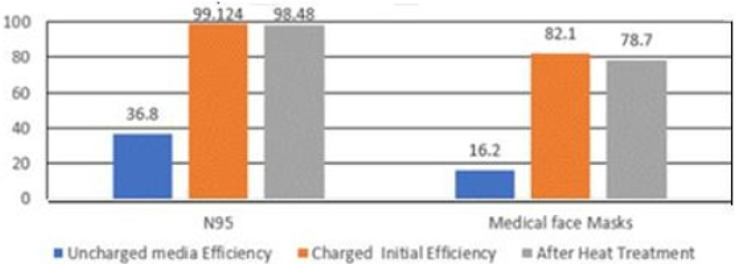
Figure 1: Electrostatic efficiency of N95 and Medical Face Masks (Tsai, 2020).
Surface Sterilisation Methods
[12] discussed a range of cleaning methods to remove CoV-2 from surfaces including the hydrogen peroxide, heat, Ultraviolet (UV) radiation and gamma/ X-ray irradiation. Thermally destroying the coronavirus is possible with temperatures ranging from 55°C to 60°C and further guarantee with higher temperature exposure [13]. Ultraviolet C light (UVC) is capable of inactivating the coronaviruses at an intensity of >90μW/cm^2, however a time of 60 minutes was needed [14].
Coronavirus Transmission
Transmission from Cough and Sneeze
SARS-COV-2 data from [15] suggests that viral load from sputum was found to contain a significantly high amount of pathogen particles. [15] analysis and testing method known as Droplet Digital Polymerase Chain Reaction (DDPCR), informing of virus particle quantity. They analysed 95 samples via ddPCR. The results show that a higher trace of infectious Ribonucleic Acid (RNA) was produced from sputum samples. Transport characteristics of saliva droplets by coughing was conducted tests by [16] as illustrated in Figure 2 for the average velocity of sputum coughed from the human body. The collection of data within the Particle Image Velocimetry (PIV) experiment was to generate the average velocity of a cough at 11.2 m/s. Further results ranging from 1.5m/s to 28.8m/s are also concluded in other experiments. [17,18].
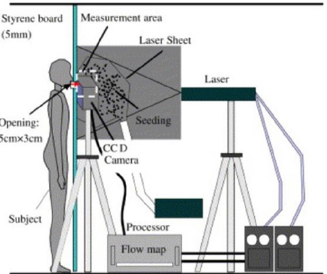
Figure 2: PIV Experiment (Zhu, et al., 2006).
Figure 3 displays that particulates are able to travel a considerable distance, further than 10 meters with a wind speed of 0.3m/s [19]. states that a concentration of particles equivalent to 100 per cm3 in volume can travel within a 3 metre distance (red cline) and that within a 15 metre distance (yellow line) the volume is reduced to 40 per cm3. [20] published data on influenza type viruses which showed that they are able to travel greater than 1 metre from an infected person which supported the possibility of aerosol transition. Data on Influenza H1N1 and H3N2 and B Viruses was used in their study. The results showed that particles were captured in a water based sampler located more than 2 metres away from an infected person. H3N2 virus was also detected as far as 3.7m in further studies from [21].

Figure 3: Concentration field of aerosol particles from a single source. Air velocity 0.3m/s, atmospheric Diffusivity 05m2/s. Concentration of Aerosol Particles in Area Bubbles: 100/cm3 (red line), 40/cm3 (yellow line) and 20/ cm3 (green line) (Gorbunov, 2020).
Airborne Transmission
Transmission of influenza RNA viruses from breathing can be feasible [22]. Patients with influenza admitted significant viruses particles in the small aerosol range of < 5μm. [23] investigated the difference between coughs and exhalations of RNA virus. The principle regards the fact that breathing is predominantly a continuous action, opposed to coughing that is intermittent. The estimations life span of aerosol particles of SARS-CoV-1 and 2 maintained in the air have been documented to last more than 3 hours [24]. The supporting evidence that the novel corona virus is able to be transmitted via airborne methods to the mouth, nose and eyes intensifies the pandemic, thus making the SARS-CoV-2 virus a more resilient virus to mitigate [25]. The WHO (2020) concludes the fact that the SARS-CoV-2 virus has been found to have a diameter of < 5μm, as a result of the evaporation process of larger droplet nuclei transmitted from an infected person. The further statement from the [26] states that the possible airborne transition of Cov-2 is dependent on, temperature and humidity factors that govern the rate of evaporation before the particulates can reach the floor. [27] discuses particles that range from 10 μm in still air are suspended in the air for 5 minutes once released from a cough at 1 meter above the floor. The thermal plume from a human body is greater than the settling velocity of a 50-μm droplet” [27].
Transmission from Surfaces
[24] documented the different life expectancy between SARSCoV- 1 and 2 in air and also on a range of materials. The data reveals that CoV-2 is more stable and lives longer throughout the range of materials, in comparison to CoV-1 which decays at a slightly faster rate across cardboards, stainless steel and plastic [24]. However this is only a slight variance across the board and the data also suggests that the expectancy CoV-1 lasts longer on the copper. The previous study indicated that copper has a known factor of exceptional antibacterial properties can be understood from the work of [28].
Environmental Effect on Transmission of the Virus
The Relative Humidity (RH) and Air Temperature (AT) generate a range of possibilities of corona virus transmission, from survival of the virus in specific conditions to distances that can be travelled through the air. Studies suggest that warmer and more humid climates reduce the life expectancy of the virus [29]. This phenomena was also observed by other researchers in analysis of o viruses similar to SARS, such as influenza virus, Venezuelan ewuine encephalitis virus and vaccinia virus when the RH was changed [30-33]. Experimental data of the survival of SARS-CoV-2 within two types of medium, artificial saliva and Tissue Culture Media (TCM) in medium and high humidity was investigated by [34]. Figure 4 present the data collected from the experimental measurements illustrates the life expectancy of aerosol CoV-2 particles suspended in air over time for different humidity factor at temperatures of 19-22°C. The findings by [34] and other relevant data regarding humidity and enveloped RNA reactance to humidity show a correlation of the decrease in virus survival and the increase in humidity. This supports the general knowledge and analytical data that acute respiratory distress syndrome ARDS, flu and pneumonia are more common in the winter months, as the lower humidity factor, thus allowing for longer survival of virions suspended in air [35].
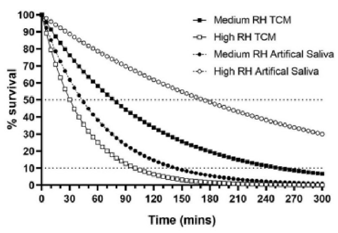
Figure 4: Theoretical survival of SARS-COV-2 in a dynamic aerosol (Smither, et al., 2020).
Adaptive Environment Research
[36] concluded from their study a neutral comfort level of temperature is 29.2°C in hot months of the year and 22.4°C in the coldest months. Their results were noted to be deviated from the ASHRAE Standard 55 of 26.9°C. However this is noted that the temperatures are also taken from the maximum hot and cold times of the year. Humidity factors were also discussed in the work of [36] and was shown to have a mean monthly RH of 60-80%. [37] found that children from the ages of 7-11 preferred the temperature to range between 20.9°C and 20.2°C depending on the sessional conditions. This study sampling time was carried out from July 2017 to May 2018. They noted that the outside temperatures throughout this study ranged from 0.7°C-25.1°C and RH of 43%- 94%, this information was generated from a local weather station that also stated the range of air speeds in the region from 0.05 m/s – 9.6 m/s over the studies time frame. [38] conducted observations in multiple university buildings in Coventry and Edinburgh. The general conclusion from the study taken in Coventry and Edinburgh infers that the comfort temperature of the lecture rooms were 22°C and 23°C for the studios within the universities when RH of 85% and air speeds of 2m/s at both universities [38-40].
The CFD Investigation of Flow in Enclosed Environment
The investigation of the flow of CoV-2 within generic environments such as an open space, classroom, hallway or sports hall will be governed via the respected literature discussed previously. The use of Ansys Fluent was the primary tool to simulate the flow structure and to illustrate the differences in change of location of the particles within occupied office/classroom. The starting simulated result will consider the distance that the particulates can travel from a cough or sneeze. The investigation of this area will give clarity of the SARS and other virion transmission methods within a general environmental setting. From the literature that sputum from a cough travels at an estimated range of 5-30 m/s. The initial testing in this research will utilise 10m/s in order to gather base line data for the overall simulations. Utilising this approach will conclude with the work of [19] and at least investigate the possible distance travelled by the CoV-2 virus from a cough or sneeze.
The possibility to understand the flow of CoV-2 particles in school classrooms, hallways, staircases and other public areas should be investigated for future development within these criteria. Environmental factors are also to be considered as the variation as these cases differ in range throughout each yearly cycle, data within this field shall allow for quicker and reliable information when dealing with future pandemics of similar nature.
Flow conditions and particle movement of the CoV-2 virus was investigated, geometric constraints were generated before applying meshing elements. Once the mesh is refined to its maximum elements and all relevant geometry Is allocated assignments names the simulation will progress to the solution parameters. The defined problem set will then be governed by the requirements of the simulation intent, thus achieving results from simulation.
Mesh of the Hallway
The mesh illustration can be seen in Figure 5, the mesh consists of the working volume area of the simulation, the hallway is 3m wide and 11m long with an extruded height of 1.5m. The highlighted box in green is the section of the geometry that is in reference to a person and mouth. The height of the box highlighted in green is 1.5 meters, use of non-realistic height to illustrate a human shape was utilised to minimise computational time and mesh elements. The mesh elements of 485000 for this simulation. Meshing selection options allowed for complex meshing of mouth opening that is a circular section with a radius of 3cm as if the mouth was at its widest position, this opening was also chambered like a venturi and to the narrowing of the throat as shown in Figure 6. The venturi was designed to allow the injection of CoV-2 particles represented as water liquid within the simulation to enter the system through the green surface in the direction of the red arrow. Multiple versions of the venturi were tested from different size ranges to splitting the interaction area of the injection port or adding further injection ports to the venturi. However, no noticeable change within the simulation was present. The control option to allow for the mesh to cover all objects without suppression was allocated to force more elements to the Venturi section as seen in Figure 6. This allowed for the smaller geometry to have priority over the rest of the mesh thus, this area has a finer mesh element concentration.
Figure 5: Computational domain for hallway.
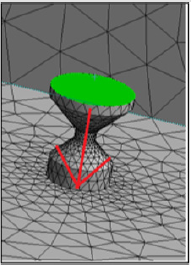
Figure 6: Venturi mesh and flow direction.
The CFD Simulation
A transient solution that allows for injections of water droplets at a given velocity to exit from the opening of the mouth section were defining features that the simulation required. The floor and human body were allocated as a solid object that collect the particles when they land on the surface. The outer geometry boundary was constrained for a stable envelope around the testing area, thus eliminating outside factors such as wall convections and air flow. Internal air characteristics were then defined as an ideal gas in conjunction with the random walk simulation profile for the water liquid droplets to be injected into the air. The droplets diameter for the projected water spray was 5μm. Thus, to simulate CoV-2 with a velocity of 10 m/s that would be emitted from the venturi which simulate the cough from a mouth. The injection time span from 0s to 0.5s was utilised to simulate the release of particles in that time frame to mimic a cough. All temperatures remained at 300K for this initial testing solution to minimise the simulation time and the computational demand on the computer. The amount of injections was also taken to initiate the base line test modal regarding droplets travel distance. Initialization of the simulation and allocation on time dependent parameters of the time steps that were 1000 and time Step size 0.01s gave an overall simulation time of 10s. This would allow for the cough to take place and the droplets emitted from the mouth to be tracked within the simulation.
Results and Discussion
Room with One Person
From the image Figure 7, it can be noticed that the 5μm particles travel up to a minimum of 3-5 meters before falling to the ground due to gravity or dissipating in the general vicinity. This indicates that the possibility for the CoV-2 particles to travel further distances than originally expected at the start of the pandemic of 2020. Further environmental factors such as airspeed and direction will have further effects on this result however, they are not present within this simulation analysis in Figure 7. The velocity magnitude of the particles from the simulation is observed to be at a maximum when leaving the mouth and thus slowing down over the distance travelled. The simulation data was conducted in ideal conditions with no consideration of outside environmental effects to illustrate and understand the flow of CoV-2. The analysis concludes that the possibility of particulates of size 5μm can travel further than 1 or 2 metres, this makes dealing with CoV-2 a more stringent task to mitigate. Further factors to consider implementing into this simulation would be to allocate air flow and directions within the hallway to simulate adverse conditions, further amendments would include heat flux from radiators and human body heat to further understand the flow characteristics. The humidity of the air shall also be a decisive factor as this limits the distance travelled by the particles providing the RH is at a higher value.
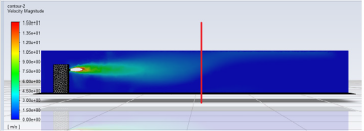
Figure 7: The contour of Velocity Magnitude.
Room with Air Conditioning System (AC) and Occupied by 2 People
This section of the report displays the information of CoV-2 particles with interaction between an inlet air flow from an AC unit. The intention for this section of the investigation is to understand the flow path of the particulates when interacting within a small classroom. The limiting factors within this simulation is that the room could not be of typical size. However, the principle of initial injection on particles and interaction with that air flow in the room will be relevant data to move on to further studies within this matter. Most of the simulation parameters are the same as the hallway solution with the same particle size and use of water droplets to mimic the CoV-2 virus. The Mesh domain as seen within Figure 8 consists of a 5m by 3m room with a hight of 2m, this volume area was able to create a reliable mesh with elements in the range of 490000 this was fine tuned in order to meet the maximum element limit. The objects that are highlighted in green are the AC unit located at the top of the room on the front wall. The other green sections are representations of 2 humans one will be the person that emits a cough and the other is to illustrate interactions with particulates within the room. Two box sections are also present to represent tables as if the location is at the front of a classroom with direct flow from the AC system.
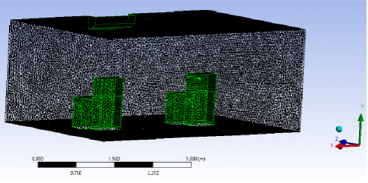
Figure 8: The contour of Velocity Magnitude.
The simulation for a room with AC also utilised the transient solution method like the hallway method. The changes in this model was the geometric parameters and the addition of an inlet section that produces an air inlet at 3m/s and injected air temperature from the AC unit was also 300k. The illustrative person on the right hand side of the room was designated as the CoV-2 infected person that would emit a cough at 10 m/s and with particle diameters of 5μm. The opening of the mouth was changed from 6cm to 3cm however a venturi system was still implemented within this simulation. Constraints regarding the wall were allocated so that particles could reflect from the wall and to not trap them to the surface thus limiting the required injection particles coughed in order to minimise the computational requirements of the calculation.Particulates tracked within the simulation were projected from the mouth at a rate of 10 m/s and projected forward on to the wall as show in Figure 9. The data illustrates the interaction of the particulates emitted from the cough and being redirected towards the rear of the room via the air flow from the AC unit. From Figure 9, it can also be noted that due to the angle of air flow from the AC unit the particles are projected towards the floor.
Figure 9: Pathlines of flow in the room with AC unit and Cough Particle. (the air flow from the AC unit towards the floor).
Figure 10 depicts both the virus particles and air flow from the AC unit, note that the air flow towards the rear of the domain is not represented of open room but rather a small walled off room as seen in Figure 10. Setting parameters to allow for the flow to escape the boundary would show slightly different pathways however not substantial enough to indulge that endeavour. The air flow angle from the AC is a chamfered edge at 45o allowing for the particles to be pushed downwards. The information demonstrated from the simulation of the room with AC indicates that methods of Figure 10 depicts both the virus particles and air flow from the AC unit, note that the air flow towards the rear of the domain is not represented of open room but rather a small walled off room as seen in Figure 10. Setting parameters to allow for the flow to escape the boundary would show slightly different pathways however not substantial enough to indulge that endeavour. The air flow angle from the AC is a chamfered edge at 45o allowing for the particles to be pushed downwards. The information demonstrated from the simulation of the room with AC indicates that methods of
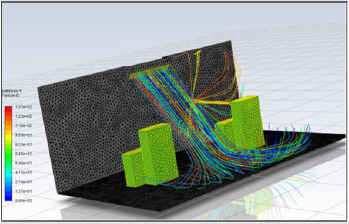
Figure 10: Pathlines of flow in the room with AC unit and cough particle. (the air flow from the AC unit with 45o towards the floor).
Conclusion
Particles Removal and Filtration
The simulation analysis has highlighted opportunity to discuss the possible underline thinking that lay out of windows doors and AC units effect the particulates in the air. Control measures are used for work environments and Intensive care units to restrict particles from leaving a room with the use of a negative pressure environment [5,6]. Future implementation of air flow control strategies when designing or remodelling building to reduce spread of future infection should become part of a consensus in a design charter to prevent and mitigate future pandemics with similar characteristics to CoV-2. Further analytical data would be a preferred approach to understanding each environment or building design to ensure appropriate ventilation and air particulates can be removed from rooms with minimal inhalation risks. Maintaining control over air flow in rooms where a large mass of people are present will be key to minimising risk. Directing particle flow from rooms safely towards ventilation systems will create opportunity to reduce infection risks and to eliminate virus particles within the air. Implementing a filter system into a controlled air flow path and air vent could catch virus particulates and to redream them inert. This approach could prove to be instrumental to minimising infection throughout schools, offices and work areas. Attaching filters or designing rooms with filtration systems that can capture particles and sterilise the filter automatically could be a decisive implementation.
Applying materials like what is used in N95 masks were the electrostatic charge increases the efficiency of the filtration could allow for further intervention to controlling and maintain the charge if it was housed within a system. From the work of [39] that informs and demonstrates this phenomenon of electrostatics in N95 mask material which is a waterproof polyester fabric, other options are also available. Production of a system that can maintain the integrity of the filter via maintaining the electrostatic effect and eliminating virus particles regular would produce a clean and efficient system to minimise recirculation of virus particles. A wide range of options are available depending on requirements and constraints within a given design. However, jinnia et al. (2020) relayed information in response to eradication of CoV-2 and other virus particles for the purpose of refurbishing and reusing PPE equipment. For example, a filter system than maintains its charge and cleanses the material from virus particles with UVC light would benefit the overall filter systems and operator that would oversee changing filters.
Surface Treatment and Cleaning
Eradication of virus particles that are trapped on surfaces are unable to be filtered out by such systems are valid concern as it is understood that CoV-2 and other viruses are able to live on surfaces for prolonged period of time [24]. A suggested approach to removal of viruses from surfaces and controlling environmental cleanliness in school, offices and workplaces would be to maintain air flow control and force virus particles to the floor and lower surfaces. The opportunity to deploy automated cleaning robots that can be programmed to work in set paths and working hours would provide additional countermeasures. Using advised cleaning products regularly on commonly used surfaces and pathways can prevent indirect contamination to objects and transmission to oral regions thus preventing infection. Deploying automated robots would allow for programmed control over the system with a network of multiple robots and regarding stations in order to maintain continues operation. These suggested arguments towards controlling inaction of CoV-2 and other pathogens has stemmed from the air flow simulation analysis and literature within this report. The consensus is that ideas and information towards minimising the transmission of viruses provides a key role towards future mitigation tactics and to prevent future pandemics becoming a greater world threat.
The Current Pandemic
The current CoV-2 pandemic has demonstrated poor understanding towards the virus and how it interacts with a variety of environments. Previous SARS and other virus that have spread, indicated similarities that are key to the knowledge of CoV- 2. However, researchers are still in high demand for information in regard to the overall topic. Within the 2020 pandemic a mass influx of data regarding medical and engineering information on CoV-2 has spiked a rise. The understanding that more investigations towards the information that are in conflict would benefit towards clarifying the general problem. Information such as particle sizes and humidity effects can been seen and documented throughout medical and engineering literature. This clarifies that the temperature variable alongside the humidity factors within the environment impacts life expectancy and plausible particle travel distance. Aerosol particles have also been documented and investigated to clarify that the CoV- 2 virus can be transmitted via person to person through airborne methods.
This is presumed to be a underlined mode of infection compared to surface transmission of larger collectives of virions. However, the required infectious dose is still not understood and limits the data in this area. If the infectious dose of CoV-2 could be quantified the possibility to calculate the time required to be in the vicinity of an infected person could be possible. However, this limit is also independent on each infected person emission of virus particles. The indication that manipulation of air flow in rooms and other environments gave opportunity to discuss the possible methods in minimising the transmission of particles. The ideas extrapolated within this paper are merely suggestions that could be used for further investigation in to minimising the spread of CoV-2. The filtering rooms and cleaning surfaces more frequently are key factors to minimising infection. However, the purpose in relaying the information within this paper was more inclined to question and insight thought into future development of building and implantation strategies for later development.
Future investigation regarding Air flow of particles with factors such as weather conditions, AC location, ventilation systems, temperature, geometric environment factors and RH will generate a wider understanding and allow for clarity in development of countermeasures to CoV-2. Further simulations with larger scale models would provide a wider range of investigation than what has been relayed within this paper. However, the requirements for computational power and memory were key factors to the limitations of the simulated results within this report. The information has given clarity to the particulates and the possible distance that could be reached in stagnant conditions. The secondary simulation was at a smaller scale and could simulate a singular injection with inlet air speed of 3m/s. This section illustrated that the positioning of AC systems or open windows and doors can create positive or negative airflow patterns in regard to inhalation of virus particles.
References
- Astuti I (2020) Severe Acute Respiratory Syndrome Coronavirus 2 (SARS-CoV- 2): An overview of viral structure and host response. Diabetes & Metabolic Syndrome: Clinical Research & Reviews 14(4): 407-412.
- Verdecchia P, Cavallini C, Spanevello A, Angeli F (2020) The pivotal link between ACE2 deficiency and SARS-CoV-2 infection. European Journal of Internal Medicine 76: 14-20.
- Hoffmann M, Kleine-Weber H, Schroeder S, Krüger N, Herrler T, et al. (2020) SARS-CoV-2 cell entry depends on ACE2 and TMPRSS2 and is blocked by a clinically proven protease inhibitor. Cell 181(2): 271-280.
- Wonderlich ER, Swan ZD, Bissel S, Hartman AL, Carney JP, et al. (2017) Widespread virus replication in alveoli drives acute respiratory distress syndrome in aerosolized H5N1 influenza infection of macaques. The Journal of Immunology 198(4): 1616-1626.
- Lee JK, Jeong HW (2020) Rapid expansion of temporary, reliable airborne- infection isolation rooms with negative air machines for critical COVID-19 Patients. American Journal of Infection controle 48(7): 822-824.
- Mousavi E, Bausman D, Fallah Yakhdani H (2020) Renovation in hospitals: An experimental study of negative pressure and filtration. Science and Technologu for the Built Enviroment 26(3): 377-386.
- Liang M, Gao L, Cheng C, Zhou Q, Uy JP, et al. (2020) Efficacy of face mask in preventing respiratory virus transmission: a systematic review and meta-analysis. Travel Medicine and Infectious Disease 36: 101751.
- Eikenberry SE, Mancuso M, Iboi E, Phan T, Eikenberry K, et al. (2020) To mask or not to mask: Modeling the potential for face mask use by the general public to curtail the COVID-19 pandemic. Infectious Diease Modelling 5: 293-308.
- Tsai P (2020) Preformance of masks and discussion of the inactivation of SARS- CoV-2. Engineered Science 10: 1-7.
- Chen CC, Lehtimäki M, Willeke K (1993) Loading and filtration characteristics of filtering facepieces. American industrial Hygiene Association Journal 54(2): 51-60.
- Martin SB, Moyer ES (2000) Electrostatatic Respirator Filter Media; Filter Efficency and Most Penetrating Particale Size Effects. Applied Occupational and Environmental Hygiene 15(8): 609-617.
- Jinia AJ, Sunbul NB, Meert CA, Miller C Clarke SD (2020) Review of Sterilization Techniques for Medical and Personal Protective Equipment Contaminated With SARS-CoV-2. IEEE Access 8: 111347-111354.
- Abraham JP, Brain D, Plourde, Lijing C (2020) Using Heat to Kill SARS- CoV-2. Reviews in Medical Virology 30(5): 2115.
- Darnell ME, Subbarao K, Feinstone SM, Taylor DR (2004) Inactivation of the coronavirus that induces severe acute respiratory syndrome, SARS-CoV. Journal of Virological Methods 121(1): 85-91.
- Yu F, Yan L, Wang N, Yang S, Wang L, et al. (2020) Quantitative Detection and Viral Load Analysis of SARS-CoV-2. Clinical Infectous Diseases 71(15): 793-798.
- Zhu S, Kato S, Yang JH (2006) Study on transport characteristics of saliva droplets produced by coughing in a calm indoor environment. Building and Environment 41(12): 1691-1702.
- Chao CY, Wan MP, Morawska L, Johnson GR, Ristovski ZD, et al. (2009) Characterization of expiration air jets and droplet size distributions immediately at the mouth opening. Journal of Aerosol Science 40(2): 122-133.
- Van Sciver M, Miller S, Hertzberg J (2011) Particle Image Velocimetry of Human Cough. Aerosol Science and Technology 45(3): 415-422.
- Gorbunov B (2020) Aerosol Particles Laden With Viruses That Cause COVID- 19. Preprints org.
- Pan M, Bonny TS, Loeb J, Jiang X, Lednicky JA, et al. (2017) Collection of viable aerosolized influenza and other respiratory viruses in a student health care center through water-based condensation growth. Msphere 2(5): 1.
- Lednicky JA, Loeb JC (2013) Detection and isolation of airborne influenza A H3N2 virus using a Sioutas Personal Cascade Impactor Sampler. Influenza research and treatment 1: 1.
- Milton DK, Fabian MP, Cowling BJ, Grantham ML, Mc Devitt JJ (2013) Influenza virus aerosols in human exhaled breath: particle size, culturability, and effect of surgical masks. PLos Pathog 9(3): 1003205.
- Lindsley WG, Balachere FM, Beezhold DH, Thewlis RE, Noorbakhsh B, et al. (2016) Viable influenza A virus in airborne particles expelled during coughs versus exhalation. Influenza and other respiratory viruses 10(5): 404-413.
- Van Doremalen N, Bushmaker T, Morris DH, Holbrrok MG, Gamble A, et al. (2020) Aerosol and surface stability of SARS-CoV-2 as compared with SARS-CoV-1. New England Journal of Medicine 382(16): 1564-1567.
- (2020) World Health Organization. Modes of transmission of virus causing COVID-19: implications for IPC precaution recommendations.
- (2020) World Health Organization. Rational use of personal protective equipment (PPE) for coronavirus disease (COVID-19) and considerations during severe shortages.
- Milton DK (2020) A rosetta stone for understanding infectious drops and aerosols. Journal of the Pediatric Infectious Deseases Society 9(4): 413-415.
- Raffi M, Mehrwan S, Bhatti TM, Akhter JI, Hameed A, et al. (2010) Investigations into the Antibacterial behavior of copper nanoparticles against Escherichia coli. Annals of microbiology 60(1): 75-80.
- Casanova LM, Jeon S, Rutala WA, Weber DJ, Sobsey MD (2010) Effects of Air Temperature and Relative Humidity on Coronavirus Survival on Surfaces. Applied and Environmental Microbiology 76(9): 2712-2717.
- Harper GJ (1961) Airborne micro-organisms: survival tests with four viruses. Epidemiology & Infection 59(4): 479-486.
- Harper GJ (1963) The influence of environment on the survival of airborne virus particles in the laboratory. Archiv für die gesamte Virusforschung 13(3): 64- 71.
- Hemmes JH, Winkler K, Kool SM (1960) Virus survival as a seasonal factor in influenza and poliomyelitis. Nature 188(4748): 430-431.
- Schaffer FL, Soergel ME, Staube DC (1976) Survival of airborne influenza virus: effects of propagating host relative humidity, and composition of spray fluids. Archives of Virology 51(4): 263-273.
- Smither SJ, Eastaugh LS, Findlay JS, Lever MS (2020) Experimental Aerosol Survival of SARS-CoV-2 in Artifical Saliva and Tissue Culture Media at Medium and High Humidity. Emerging Microbes & Infections 9(1): 1415-1417.
- Bourouiba L (2020) Turbulent gas clouds and respiratory pathogen emissions: potential implications for reducing transmission of COVID-19. Jama 323(18): 1837-1838.
- Liang HH, Lin TP, Hwang RL (2012) Linking occupants’ thermal perception and building thermal performance in naturally ventilated school buildings. Applied Energy 94: 355-363.
- Korsavi SS, Montazami A (2020) Childrens thermal comfort and adaptive behaviours; UK primary school during non- heating and heating seasons. Engergy and buildings 214: 109857.
- Jowkar M, Rijal HB, Brusey J, Montazami A, Carlucci S, et al. (2020) Comfort temperature and preferred adaptive behaviour in various classroom types in the UK higher learning environments. Energy & Buildings 211: 109814.
- Yang S, Lee GW (2005) Electrostatic Enhancement of Collection Efficiency of the Fibrous Filter Pretreated with Ionic Surfactants. Journal of the Air & Waste Management Association 55(5): 594-603.
- Imai Y, Kuba K, Rao S, Huan Y, Guo F, et al. (2005) Angiotensin-converting Enzyme 2 Protects from Severe Acute Lung Failure. Nature 436(7047): 112-116.
