 Review Article
Abstract
Novel approaches during industrial fermentation processes are not only restricted to classical pH, dO2 and off gas analysis. There are many in-situ and online sensors based on different physical principles to determine biomass, product quality, metabolism and cell death. These process analytics are normally very cost intensive. One of the very important approaches relating to in-situ determination is the viable cell concentration (VCC). Based on this knowledge, an increased efficiency in monitoring and controlling strategies during cultivations can be provided. Electrochemical impedance spectroscopy (EIS) is a powerful tool in life science and has been heavily investigated for its potential to characterize the microbiological behavior during cultivation processes. For that purpose, EIS is used to monitor biomass in fermentation processes of Escherichia coli and Saccharomyces cerevisiae. A correlation of double-layer capacitance (CDL) and the cell density was found. The novelty of this approach has been proven with different stateof- the-art biomass measurements (dry cell weight (DCW) and optical density (OD)) in order to get an adequate verification of this method. Finally, it has been demonstrated that EIS measurement at low frequencies is a powerful monitoring tool in different modes (offline, online an inline) for microbiological cultivations. In addition to that, this approach is also perfectly suited to determining physio-logical states of the cells.
Keywords: Electrochemical Impedance Spectroscopy; Viable Cell Concentrations; Escherichia Coli; Saccharomyces Cerevisiae; Biomass Monitoring
Abbreviations: VCC: Viable Cell Concentration; EIS: Electrochemical Impedance Spectroscopy; CDL: Correlation of Double- Layer Capacitance; DCW: Dry Cell Weight; OD: Optical Density
Introduction
For producing organic compounds such as food, drugs and bulk chemicals as well as in waste-to-value concepts, microbiological cultivations play a key role [1]. As probably supposed, microorganism, like bacteria and yeast are not only applied in pharmaceutical technology. For guaranteeing product quality and safety, process monitoring such as pH, dis-solved oxygen (dO2), off gas analysis and biomass is state-of-the-art in today’s industrial cultivation processes. However, in such applications mentioned above, process monitoring, i.e., process analytical technology (PAT) is of crucial importance to control the system and react timely upon metabolic changes. The biomass as an important measured value in bioprocesses can only be determined by using offline methods or high-end soft-sensor applications [2]. For that usage, these sensor systems are often performed as inline/online/at-line detection systems. The usual analyzing methods for these applications, such as for example high-performance liquid chromatography (HPLC) for metabolites, off-gas balance, and/or dielectric spectroscopy measurements, have proven to be helpful. For the determination of biomass, however, an accurate and reliable measurement systems [3,4] is still required. By determining viable cell concentrations (VCCs), the process parameters subsequently lead to more robust and reliable bioprocesses and contribute to a higher product quality. Moreover, this would enhance more flexibility in batchto- batch variations. The determination of VCC is performed as an offline measurement using flow cytometry or confocal microscopy [5,6]. Such methods are based on marker proteins and fluorescence probes, which allow screening between living/dead cells [5,6]. Besides the staining with propidium iodide, other stains can also mark the DNA of the cells, which also allows for these screenings [7]. Such advanced analytical tools are mainly used in the pharmaceutical industries due to their cost-intensiveness. Therefore, ordinary bulk foods, which use yeast in their production process, such as the brewing and baking industry, manufacture their products in rather uncontrolled process conditions. Regarding this, it should be mentioned that the conditions for propagation and fermentation are crucial for the quality of the product itself. Indeed, an implementation of online measurements for determining the vitality in the brewing industry was historically founded by affordable, simple, robust and reproducible tests [8].
This is mainly due to the fact that the online and inline biomass measurement approaches are rather scarce, because the principles are based on physical measurements. Beside other physically based principles, such as optical measurements, many biosensors also use a change of an electrical signal for analysis. It is common to apply high frequency alternating current (AC) impedance spectroscopy with high field amplitudes, which is referred to as β-dispersion [9,10]. The interesting aspect here is, that cells with an integer cell membrane affect the relative permittivity between two electrodes in contrast to dead cells. Therefore, this signal is used for the estimation of VCCs. The details about the measurement principles can be found in [11-14]. The model organism for the application of AC measurements in the ß-dispersion range is yeast, it being a very important expression host for recombinant proteins [15-17] and of high interest because of its meaningfulness. In addition to that, there are approaches towards more complex expression systems, such as filamentous fungi and Chinese hamster ovary (CHO) cells, which have already been performed [18-21]. It is evident, that these measurements show a strong dependence upon the physical process parameters (such as aeration and stirring—causing gas bubbles, temperature shifts and pH gradients), and are furthermore, highly affected by changes in the media’s composition dur-ing cultivation. In addition, changes in the media during fermentation show effects on the signal amplitude and requires complex data analysis [22].
At this point it is necessary to note, that the ß-relaxation in the frequency range from 107 to 104 Hz is not the only one characterized by the relaxation phenomenon, which can be exploited for the determination of biomass. Especially, changes of the electrical double layer by the adsorption/desorption of cells at the electrode surface, are detectable at low frequencies in the millihertz range. The so-called α-dispersion, which is characterized from 104 to 10-2 Hz, can also provide valuable information. While during ß-dispersion effects, the en-tire cell is embedded within Wagner–Maxwell polarization, α-dispersion on the other side, shows preliminary ionic interactions and relaxation phenomena on the cell membrane itself [23]. Here one must distinguish between two effects, firstly, the cell itself, exhibiting differences in cell walls, the membrane compositions, size as well as shape and metabolism. Secondly, physical parameters especially in the media (pH and ion concentrations) can play an influence on the potential distribution at the electrode double layer [24,25]. It has been proven, that EIS measurement in the α-dispersion regime provides valuable results for detection of bacteria in soil, food and feces-polluted water by using interdigitated electrodes [26-34]. First approaches towards process monitoring were shown by Kim et al. [35]. He pioneered the utilization of an inline sensor, which was used in the lower frequency range between 40 Hz and 10 kHz for real-time monitoring of biomass. Referred to this article the feasibility for measuring changes in the double-layer capacitance (CDL) has been shown. At this point, is should be noted, that no analysis of the CDL itself was performed. More or less the discrete extracted values for distinct frequency values were used.
Several studies have been carried out in our group on E. coli and S. cerevisiae and promising results for VCC determination throughout the whole cultivation range were achieved. We cultivated in batch phase as well as in the fed-batch, which led to high cell densities [36,37] and has been proven and tested in the brewery environment [38]. It is planned to carry out further investigations to correlate the total biomass to the extracted CDL and show the straight-forward application and the possibilities it holds. Especially a system for an ac-curate VCC measurement, such as vitality and cell number (living/dead) determination even in industrial-scale applications will be developed, which could bring immense facilitation and increase in the time needed to evaluate such processes.
Experimental
The ability for EIS measurement has already been successfully demonstrated in several microbiological processes. The monitoring of biomass for E. coli and S. cerevisiae requires a different procedure for cultivation and analytics, which shall be closer considered in the following [36-38].
Expression Host and Cultivation for E. coli
All cultivations were performed using an E. coli BL21(DE3) strain as expression host trans-formed to produce recombinant horseradish peroxidase (HRP) (pet39+/HRP) or a recombinant cytoplasmic antibody fragment. For the preculture 500 mL sterile DeLisa medium was inoculated from frozen stocks (1.5 mL, 80 °C) and incubated in a 2500 mL High-Yield shake flask for 20 h (230 rpm, 37 °C). Batch and fed batch cultivations were performed in a stain-less-steel Sartorius Biostat Cplus bioreactor (Sartorius, Göttingen, Germany) with 10 L working volume. A batch and fedbatch phase for biomass generation were followed by an induction phase using a mixed feed medium with glucose as primary carbon source and lactose as carbon source as well as inducer. Detailed information about the bioreactor setup and media composition can be found elsewhere [41].
Analytical Procedures for E. coli
For DCW measurements 2 mL of the cultivation broth was centrifuged at 4500 × g, subsequently washed with 0.9% NaCl solution and centrifuged again. After drying the cells at 105 °C for 48 h the pellet was evaluated gravimetrically. DCW measurements were per-formed in triplicates and the mean error for DCW was always 3%. Offline OD600 measure-ments were performed in duplicates in a UV/VIS photometer Genisys 20 (Thermo Scientific, Waltham, MA, USA).
For inline OD880 measurements a Dencytee total cell density measurement cell (Hamilton, Reno, NV, USA) was used. In general, at cell densities above 20 g/L (DCW) saturation effects were observed [39] (exceeding linear range of Lambert Beer’s law as already observed for offline OD600 measurements). Verification of cell viability was done by flow cytometric (FCM) measurements. After addition of DiBAC4 (bis-(1,3-dibutylbarbituricacid) trimethineoxonol) and Rh 414 dye diluted cultivation broth was measured using a Cy Flow Cube 8 flow cytometer (Sysmex-Partec, Bornbach, Germany). Rh 414 binds to the plasma membrane and visualizes all cells, while Di BAC is sensitive to plasma membrane potential and therefore distinction between viable and non-viable cells can be achieved. Detailed information on the viability assay can be found elsewhere [40]. Overall errors with this method were in the range of 0.5% to 1%. As less than 5% of dead cells were detected in all samples, DCW and VCC can be assumed to be equivalent.
Expression Host and Cultivation for S. cerevisiae
All cultivations were performed using the S. cerevisiae strain, supplied by Brauerei GUSSWERK (Salzburg, Austria). For the preculture, 500 mL of sterile Delft medium was inoculated from frozen stocks (1.5 mL; 80 °C) and incubated in a 2500 mL High- Yield shake flask for 20 h (230 rpm; 28 °C). Batch cultivations were performed in a stainless-steel Sartorius Biostat Cplus bioreactor (Sartorius, Göttingen, Germany) with a 10 L working volume, and in an Infors Techfors-S bioreactor (Infors HT; Bottmingen, Switzerland) with a 20 L working volume. Aerobic batches were cultivated using 1000 to 1400 rpm stirrer speeds with an aeration of 2 vvm. Anaerobic batches were cultivated at 600 rpm and with a 2 to 4 L/min N2 flow. The composition of the defined Delft medium used was as follows: 7.5 g/L (NH4)2SO4, 14.4 g/L KH2PO4, 0.5 g/L MgSO4 ∙7H2O, 2 mL of trace metal stock, 1 mL of vitamins, 50 μL of poly-propylenglycol (PPG) as Antifoam, and maltose and glucose in different concentrations as a carbon source. For the malt extractbased fermentation, a preculture with Delft media was cultivated, which was afterwards inoculated into the malt extract solution (150 g/L malt ex-tract in deionized water: Weyermann, Bavarian Pilsner, Bamberg, Germany).
Analytical Procedures for S. cerevisiae
For the DCW measurements, 1 mL of the cultivation broth was centrifuged at about 9000 g, subsequently washed with 0.9% NaCl solution, and centrifuged again. After drying the cells at 105 °C for 48 h, the pellet was evaluated gravimetrically. DCW measurements were per-formed in five replicates and the mean error for DCW was about 3%. Offline OD610 measurements were performed in duplicates in a UV/VIS photometer, Genisys 20 (Thermo Scientific, Waltham, MA, USA). Verification of the cell viability in defined medium samples was performed using FCM measurements. After the addition of DiBAC (Thermo Scientific, Wal-tham, MA, USA), the diluted cultivation broth was measured using a CyFlow Cube 8 flow cy-tometer (Sysmex-Partec, Bornbach, Germany). DiBAC is sensitive to the plasma membrane potential, and therefore a distinction between viable and non-viable cells can be achieved. Detailed information on the viability assay can be found elsewhere [40]. The overall errors for this method were in the range of 0.5% to 1%. Sugar concentrations in the fermentation broth were determined using a Supelco C-610H HPLC column (Supelco, Bellefonte, PA, USA) on an Ultimate 300 HPLC system (Thermo Scientific, Waltham, MA, USA) using 0.1% H3PO4 as a running buffer at 0.5 mL/min. Ethanol concentrations were determined using an Aminex HPLC column (Biorad, Hercules, CA, USA) on an Ag-ilent 1100 System (Agilent Systems, Santa Clara, CA, USA) with 40 mM H2SO4 as a running buffer at 0.6 mL/min. Cultivation off-gas was analyzed by gas sensors: IR for CO2 and ZrO2-based for O2 (Blue Sens Gas analytics, Herten, Germany).
Measurement Setup
Determination of VCC by using capacitance probes are widely spread for industrial applications. Regarding this, the physical principle of these systems based on β-dispersion (107–104 Hz). Unfortunately, these probes show a high dependence on process parameters (e.g., stir-ring, temperature, pH, salt and substrate concentration, etc.) [32,42]. The goal was to devel-op and test the novel application for low frequency electrochemical impedance spectroscopy in online and inline measurements. In this regard we exploited a different physical phenomenon (α-dispersion) at frequencies below 10 kHz, which provides valuable information regarding the biomass concentration. By this physical principle deformation of ionic species around the cell membranes are detected. The dielectric response of the ap-plied EIS signal was proportional to the ionic charge gathered around the membrane of ad-sorbed cells on the electrode [43,44]. For the characterization of E. coli and S. cerevisiae [36,37] in lab-scale EIS measurements were applied in the range of 106 to 10-1 Hz with amplitudes of 100 to 250 mV using the Alpha-Ahigh-resolution dielectric analyzer (Novo control, Montabaur, Germany). The EIS measurement was also performed for an industrial propagation process took place in the Stiegl Brewery in Salzburg/Austria [38]. Therefore, EIS measurements were recorded in the range of 106 to 10-1 Hz with amplitudes up to 100 mV using the N4L PSM 1735 frequency analyzer (Newton 4th Ltd., Leicester, UK). To be able to generate a viable and also straight-forward monitoring process tool that can be applied to indus-trial scale setups and could be also moved to different operating sites, a range of different properties and features that the setup and the probe required had to be carefully considered. We were aiming for a new way of monitoring processes, developing a sophisticated probe, while at the same time keeping the ease of handling and the accuracy of the obtained data at the forefront of our mind. Through careful planning a stepwise approach was devel-oped to reach this goal. These steps involved the construction of an online and inline proto type. The testing of thereof at reallife conditions and the generation of an impedance signal and its link to a viable cell concentration, and finally the implementation of the probe in an online mode to prove the applicability of this novel biomass sensor [36-38]. Details on the fitting procedure and data evaluation are given in [37].
Online Measurements Probe and Measurement Setup: In accordance with literature reports [31] stainless steel electrodes were utilized. To ensure the flawless operating of the sensor in online measurements a thermostatically controlled flow cell, which was linked to the bioreactor via a peristaltic pump, automatically recorded signals in regular intervals. This enabled the continuous monitoring of the reaction progress, while also optimizing the operating mode of the probe. In order to keep the sensor adaptable, commercially available and standardized parts were utilized. The flow cell itself consist-ed of a borosilicate glass cylinder (DN 16) with an adaptor connection. The continuous flow was maintained through the probe with the peristaltic pump at 100 mL/min. The temperature within the probe was controlled and monitored through a poly methymetacrylate heat-ing/cooling jacket with a connected heating and cooling thermostat alpha-RA (Lauda, Lauda- Königshofen, Germany). The used electrodes had a diameter of δ= 1.3 cm and were α= 1.4 cm apart. All this allowed the seamless integration of the various parts into the flow cell.
Initial measurements were undertaken utilizing a 10 L stainlesssteel Sartorius Biostat Cplus bioreactor containing a strain of S. cerevisiae. As this online probe showed very promising results, we were able to undertake an industrial propagation at the Stiegl Brewery in Salz-burg/Austria. Therefore, a 1500 L stainless-steel propagator was used, where alternating aeration and pumping of the broth took place. In order to keep sterility of this large setup, samples were taken and transferred to a custom-made cooling reactor with our probe in order to undertake the subsequent impedance measurements. The large-scale setup as well as the online probe design can be seen in Figure 1.
Inline Measurements Probe and Measurement Setup: In order to diversify the applications of the probes developed, also an inline probe was de-signed [36]. Online probes show generally promising results (see discussion below) however, they have the inherent problem of differences in the metabolism stage in the side stream and the mainstream. Furthermore, online probes can easily contaminate processes. Hence, sometimes an inline probe might be more suitable for a process. Again, the materials were carefully chosen, with a stability up to 130 °C for means for ready in situ autoclavation. The probe was mounted on the reactor with a commonly used 25 mm B. Braun safety port with an O-ring (Ingold connector). The body and the electrodes consisted of austenitic stainless steel. The probe measured 140 mm in length and a minimum of 12 mm in diameter. The electrodes had a diameter of 10 mm and were 2 mm apart from each other (see Figure 1c).
Result and Discussion
Online EIS Measurements
Various experiments and measurements were undertaken to evaluate the scope of the developed online probe. Before standard tests could be developed and trialed, the Nyquisit plot was fitted for various concentration of the bio media by complex nonlinear square fitting (CNLS). Furthermore, the effect of the media background was investigated and was dis-missed as not having an impact on the impedance signal due to the flat slope (k= 6.4x10- 8) of the curve from the plotted clarified fermentation supernatant against the biomass concentration. It also proved beneficial to utilize higher amplitudes of 500 mV for the flow-through measurements in order to avoid unwanted changes of the double layer resistance resulting in negative resistances [37]. Due to the negligible effects of the media on the measurements also the double layer capacitance could be determined (Figure 2).
The adaptability of this online probe can be further showcased by the promising results of both measurements of E. coli and S. cerevisiae [37,38]. Measurements with E. coli showed high reproducibility of the obtained results, as the correlation between DCW and CPEdl-Q (see Figure 3) of two separate cultivations were nearly ident (similar slopes and high R2 = 0.94 and 0.98). Reproducibility remained high even when two cultivations with different specific growth rates were investigated, highlighting the inherent strength of ESI for process monitoring. Similar promising results were obtained from the S. cerevisiae cultivation. As mentioned above they were again fitted with CNLS (see Figure 4). The next step was to test the probe further and move the online probe from the lab setting to large scale atline measurements in the Stiegl Brewery in Salzburg/Austria [38]. The industrial propagation was undertaken in a 1500 L reactor. During propagation the reactor tem-perature rose from 8-12 °C. Hence, the measurement system was cooled to 7.6-8 °C in order to maintain a steady temperature during EIS. The impedance measurement method for online measurements in the a-dispersion regime was successfully transferred to a large-scale industrial application. The results of both, lab scale and industrial scale results, can be seen below (see Figure 5). Furthermore, a correlation was obtained between the cells count-ed at the brewery and the impedance signal (see Figure 5b) was established and can be used for the direct measurement of the cells from now onwards.
Inline EIS Measurements
Besides versatile online impedance measurements, also an inline probe was developed [36]. This probe could be, among other things, used to estimate the viable cell concentrations in aerobic and anaerobic cultivations. In order to be able to compare inline and online measurements, data was recorded alternating both probes in aerobic and anaerobic cultivations. The data of the aerobic cultivation with the inline probe shows a reduction of the capacity by an order of a magnitude compared to the online measurements. Further relevant details for the measurements with the inline probe can be seen in Figure 6. These results were then used to fit the biomass data. Both, the aerobic and anaerobic cultivations, show a linear fit between impedance signals and offline DCW beyond a threshold of 1g/ 1 DCW, as shown in Figure 7c and 7d. Furthermore, the correlation of the calculated biomass compared to the offline biomass was established. The expected exponential growth of the cultures were accurately monitored. In summary, for a defined minimal media the inline probe showed reproducibility and stable results (max. volume = 10-20 L) [36]. As defined media are however somewhat considered as a model media, a complex malt extract medium was subsequently investigated. Online measurements in such media can be cumbersome or simply not possible, as in the case of OD measurements. Hence, EIS could represent a valuable alternative. In this case again both inline (see Figure 7b) as well as online measurements (see Figure 7a) were performed to compare the obtained data. For the inline signal a distinctive decrease for the capacitance with subsequent increase of ethanol growth can be seen, while the drop in the online measurements is less pronounced. The interpolated data of both measurements was plotted against DCW. While both signals appear to be simi-lar in appearance compared to the defined media beforehand, a shift in the signal intensity can be observed.
In summary it can be said that the inline measurements setup as well as the online probe definitely have their merits, especially when it comes to the monitoring of complex media such as malt extract or molasses where other optical online methods reach their limitations.
Conclusion
Within this studies new online and inline probes based on EIS at low frequencies for the de-termination of VCCs for S. cerevisiae were tested. At the beginning, cultivations were monitored by using a prototypical developed online probe for pharmaceutical E. coli fed-batch cultivations. Fortunately, this batch cultivations on defined media for aerobic and anaerobic growth showed stable results, regardless of the carbon source or concentrations. A noval inline probe was designed and tested in aerobic and anaerobic cultivations. Therefore, the inline probe has been applied in a defined media and was compared to the online probe. During the process a good description of the biomass growth was achieved. Apart from the determination of the biomass during the cultivation, physiological states could be deter-mined, depending on the respiratory condition of the cells. This measurement setup which has been developed for biomass is highly beneficial, especially in complex media such as malt extract or molasses. For instance, optical online methods would not be suitable in such optically dense media. Therefore, the developed system shows high potential for monitoring cell growth. Using such online or inline probes allow real-time determination of the biomass. In further studies a novel EIS analyzer at low frequency for low-cost application, such as food sector, will be developed. In addition to that new applications for VCC measurement for monitoring algae are being evaluated.
Acknowledgement
We thank the Austrian Promotion Agency (FFG) [grant number: 874206] for funding. This work was also supported by the Christian Doppler Gesellschaft (CDG) for funding.
Autor Contributions
Prof. G.C. Brunauer and DDr. C. Slouka conducted the experiments. Prof. G.C. Brunauer and A. Gruber built the measurement setup and DDr. C. Slouka conducted data analysis. Dr. A. Meindl gave valuable input in conceptualization. Prof. G.C. Brunauer and Dr. A. Meindl drafted the manuscript. B. Rotter gave valuable input in designing the electrochemical impedance spectroscopy (EIS) measurement setup. All authors have read and agreed to the published version of the manuscript. Prof. T. Schnabel and Prof. A. Petutschnigg gave valua-ble input in conceptual design of bio reactors.
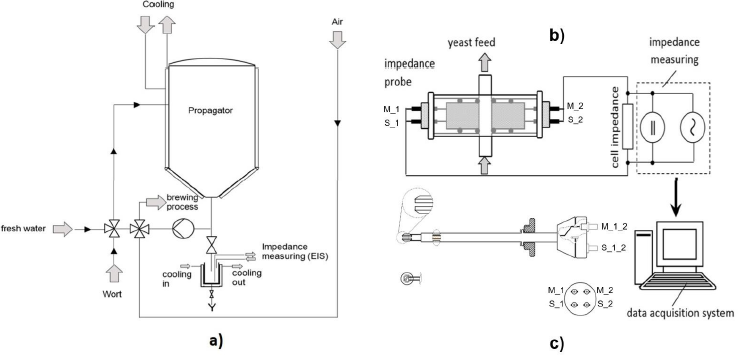
Figure 1: (a) Propagation reactor including sampling port and cooling/sampling device built for measurement [38]; (b) impedance measurement principle including online measurement probed developed [36,37]. (c) Sketch of the inline probe prototype indicating the used material and wiring. Connection to the impedance analyzer was performed using four-point BNC (Bayonet Neill-Concelman) connector [37].

Figure 2: (A) DCW can be calculated accurately by the online impedance signal. Determination of the VCC via double layer capacitance is reproducible for different E. coli cultivations; (B) Calculated DCW vs. measured DCW.

Figure 3: Correlation between DCW and impedance signal (CPEdl-Q) measured in online mode during two fed batch cultivations with different feeding strategies.

Figure 4: a) Raw capacitance signal fitted using an ideal capacitor in the range from 1000 Hz to 100 mHz through-out the process time. Smoothing was done using polynomic smoothing procedure in OriginLab; b) process pa-rameters—sugar consumption and ethanol production—compared to smoothed impedance signal.

Figure 5: (a) Raw capacitance signal of the samples taken from the propagation reactor at Stiegl brewery; (b) correlation of impedance signal to cell number measured by flow cytometry of the lab scale (blocks) and at the Stiegl site (circles).

Figure 6: (a) Impedance raw data in the Nyquist plot for an aerobic cultivation. Black squares represent the signal from the online probe—enlarged in the inlay—and red triangles, the inline probe at similar time stages. Capaci-tance of the inline probe is one order of magnitude lower (as a result of smaller electrode areas). (b) The de-pendence of the impedance signal (not smoothed), glucose consumption and ethanol production in an aerobic cultivation using the inline probe.

Figure 7: (a) Impedance signal over cultivation time for the online probe using only malt extract as growth media. The line (orange) shows the interpolation procedure. As for related aerobic cultivation, a drop in the impedance is observed after consumption of sugars. (b) Impedance signal raw data, interpolated and smoothed for the inline probe. (c) Normalized impedance signal vs. DCW for the online probe using malt extract compared to defined media. (d) Normalized impedance signal vs. DCW for the inline probe using malt extract and defined media with glucose.
References
- Gavrilescu M, Chisti, Y (2005) Biotechnology-A sustainable alternative for chemical industry. Biotechnol Adv 23: 471-499.
- Sagmeister, Wechselberger P, Jazini P, Meitz M, Langemann A, et al. (2013) Soft sensor assisted dynamic bioprocess control: Efficient tools for bioprocess devel-opment. Chem Eng Sci 96: 190-198.
- Clarke, Blake-Coleman D, Carr B, Calder R, M Atkinson (1986) Monitoring reactor biomass. Trends Biotechnol 4: 173-178.
- Kiviharju, Salonen K, Moilanen K, Eerikäinen U (2008) Biomass measurement online: The performance of in situ measurements and software sensors. J Ind Microbiol Biotechnol 35: 657-665.
- Davey, HM Kell (1996) D.B. Flow cytometry and cell sorting of heterogeneous microbial populations: The importance of single-cell analyses. Microbiol. Rev 60: 641-696.
- Veal, Deere D, Ferrari D, Piper B, Attfield J, (2000) Fluorescence staining and flow cytometry for monitoring microbial cells. J Immunol Methods 243: 191-210.
- Fiala, Lloyd J, Rychtera D, Kent M, Al-Rubeai C (1999) Evaluation of cell numbers and viability of Saccharomyces cerevisiae by different counting methods. Biotechnol Tech 13: 787-795.
- Lodolo, Kock EJ, Axcell JL, Brooks BC (2008) The yeast Saccharomyces cerevisiae–the main character in beer brewing. FEMS Yeast Res 8: 1018-1036.
- Schwan HP (1984) Electrical and acoustic properties of biological materials and biomedical applications. IEEE Trans. Biomed Eng 31: 872-878.
- Schwan, Foster HP (1980) RF-field interactions with biological systems: Electrical properties and biophysical mechanisms. Proc. IEEE 68: 104-113.
- Yardley, Kell JE, Barrett DB, Davey J (2000) On-line, real-time measurements of cellular biomass using dielectric spectroscopy. Biotechnol. Genet Eng Rev 17: 3-36.
- Dabros, Dennewald M, Currie D, Lee DJ,Todd MH, et al.(2009) Cole- Cole Linear and multivariate modeling of capacitance data for on-line monitoring of biomass. Bioprocess Biosyst Eng 32: 161-173.
- Soley, Lecina A, Gámez M, Cairo X, Riu J, et al. (2005) On-line monitoring of yeast cell growth by impedance spectroscopy. J Biotechnol 118: 398-405.
- Carvell, Dowd JP (2006) On-line measurements and control of viable cell density in cell culture manufacturing processes using radio-frequency impedance. Cytotechnology 50: 35-48.
- Gerngross TU (2004) Advances in the production of human therapeutic proteins in yeasts and filamentous fungi. Nat Biotechnol 22: 1409-1414.
- Buckholz, Gleeson RG (1991) Yeast Systems for the Commercial Production of Het-erologous Proteins. Nat Biotechol 9: 1067-1072.
- Cereghino, Cregg GPL (1999) Applications of yeast in biotechnology: Protein produc-tion and genetic analysis. Curr. Opin. Biotechnol 10: 422-427.
- Konakovsky, Yagtu V, Clemens AC, Müller C, Berger MM, et al. (2015) Universal Capacitance Model for Real-Time Biomass in Cell Culture. Sen-sors 15: 22128-22150.
- Ehgartner, Sagmeister D, Herwig P, Wechselberger C (2015) A novel real-time method to estimate volumetric mass biodensity based on the combination of dielectric spectroscopy and soft-sensors. J Chem. Technol Biotechnol 90: 262-272.
- Ferreira, Vieira AP, Cardoso LM, Menezes JP (2005) Evaluation of a new annular capacitance probe for biomass monitoring in industrial pilot-scale fermentations. J Biotechnol 116: 403-409.
- Mishima, Mimura K, Takahara A, Asami Y, Hanai K (1991) On-line monitoring of cell concentrations by dielectric measurements. J Ferment Bioeng 72: 291-295.
- Ehgartner, Sagmeister D, Herwig P, Wechselberger C (2015) A novel real-time meth-od to estimate volumetric mass biodensity based on the combination of dielectric spectroscopy and soft-sensors. J Chem Technol Biotechnol 90: 262-272.
- Schwan, Foster HP (1980) RF-field interactions with biological systems: Electrical properties and biophysical mechanisms. Proc IEEE 68: 104-113.
- Poortinga, Bos AT, Norde R, Busscher W (2002) Electric double layer interactions in bacterial adhesion to surfaces. Surf Sci Rep 47: 1-32.
- Bot, Prodan C (2009) Probing the membrane potential of living cells by dielectric spectroscopy. Eur Biophys J 38: 1049-1059.
- Radke, Alocilja SM (2004) Design and fabrication of a microimpedance biosensor for bacterial detection. Sens J IEEE 4: 434-440.
- Yang, Li L, Gri_Y, Johnson CJ (2004) Interdigitated microelectrode (IME) impedance sensor for the etection of viable Salmonella typhimurium. Biosens. Bioelectron 19: 1139-1147.
- Liu, Li J, Zhang H, Li F, Wang X, et al. (2011) Online impedance monitoring of yeast cell culture behaviors. Microelectron Eng 88: 1711-1713.
- Lei KF (2014) Review on impedance detection of cellular responses in micro/nano environment. Micromachines 5: 1-12.
- Yang, Ruan L, Li C (2003) Detection of viable Salmonella typhimurium by impedance measurement of electrode capacitance and medium resistance. Biosens Bioelectron 19: 495-502.
- Gonzalez, Santana J, Mirza-Rosca AF (1998) ect of bacterial biofilm on 316 SS corro-sion in natural seawater by EIS. Corros. Sci 40: 2141-2154.
- Bayoudh, Othmane S, Ponsonnet A, Ouada L (2008) Electrical detection and characterization of bacterial adhesion using electrochemical impedance spectroscopy-based flow chamber. Colloids Surf A Physicochem Eng Asp 318l: 291-300.
- Wu, Ben J, Chang Y (2005) Particle detection by electrical impedance spectroscopy with symmetricpolarization AC electroosmotic trapping. Microfluid. Nanofluidics 1: 161-167.
- K’Owino, Sadik OI (2005) Impedance spectroscopy: A powerful tool for rapid bio-molecular screening and cell culture monitoring. Electroanalysis 17: 2101-2113.
- Kim, Park YH, Jung JS (2009) An impedimetric biosensor for real-time monitoring of bacterial growth in a microbial fermentor. Sens Actuators B Chem 138: 270-277.
- Slouka, Brunauer C, Kopp G, Strahammer J, Fricke M, et al. (2017) Low-Frequency Electrochemical Impedance Spectroscopy as a Monitoring Tool for Yeast Growth in Industrial Brewing Processes. Chemosensors 5: 24.
- Slouka, Wurm C, Brunauer DJ, Welzl-Wachter G, Spadiut A, et al. (2016) A Novel Application for Low Frequency Electrochemical Impedance Spectroscopy as an Online Process Monitoring Tool for Viable Cell Concentrations. Sensors 16: 1900.
- Brunauer, Spadiut G, Gruber O, Slouka A (2020) Yeast Propagation Control: Low Frequency Electrochemical Impedance Spectroscopy as an Alternative for Cell Counting Chambers in. Chemosensors 8: 27.
- Kensy, Zang F, Faulhammer E, Tan C, Büchs RK (2009) Validation of a high-throughput fermentation system based on online monitoring of biomass and fluorescence in continuously shaken microtiter plates. Microb Cell Factories 8: 1-17.
- Langemann, Mayr T, Meitz UB, Lubit Az, Herwig W (2016) Multi-parameter flow cytometry as a process analytical technology (PAT) approach for the assessment of bacterial ghost production. Appl. Microbiol. Biotechnol 100: 409-418.
- Wurm, Veiter DJ, Ulonska L, Eggenreich S, Herwig B, et al. (2016) The coli pET expression system revisited-Mechanistic correlation between glucose and lac-tose uptake. Appl Microbiol Biotechnol 100: 8721-8729.
- Yang L (2008) Electrical impedance spectroscopy for detection of bacterial cells in suspensions using interdigitated microelectrodes. Talanta 74: 1621-1629.
- Gerngross TU (2004) Advances in the production of human therapeutic proteins in yeasts and filamentous fungi. Nat. Biotech 22: 1409-1414.
- Buckholz, Gleeson RG (1991) Yeast Systems for the Commercial Production of Heterologous Proteins. Nat. Biotech 9: 1067-1072.
