 Research Article
Abstract
Tree species growing in Jubail Industrial City were screened for their relative resistance to air pollution. The leaf samples collected from study species were used to determine their Air Pollution Tolerance Index (APTI) by calculating the ascorbic acid, chlorophyll, pH and relative water content. The results demonstrated a substantial impact of pollutants on APTI and a strong positive correlation between APTI and pH as well as relative water content. APTI did not exceed value of (9) indicating that all study species are within the sensitivity range with varied degree of sensitivity. Ficus altissima had highest value of APTI (8.803) so it’s considered as the most tolerant species (or the least sensitive species) among the study species in the investigated site so it’s most desirable for planting in the industrial zone of Jubail City and all plants studied in the area are good bioindicators for pollution. Urban green planning in Jubail Industrial City should include the growing of more tolerant tree species that can be used as bio monitors of environmental pollutants in the city.
Keywords: Jubail City; Air pollution; Plant tolerance; Bioindicators; Tolerance Index
Introduction
Air pollution is a major risk factor for urban and industrial areas in developing countries [1]. Uncontrolled industrialization and rapid urbanization are known to cause serious problems, due to inadequate emission control and lack of stringent environmental regulations [1]. Air pollution is global problem and is responsible for one in every nine deaths annually [2]. The environment and human well-being are adversely affected due to the industrial progress and expansion of cities. The plantations, local residents and atmosphere are enormously affected by the release of oxides of sulphur, carbon, nitrogen [3]. There are no known physical or chemical methods to upgrade air quality of polluted zone [4]. Urban vegetation plays a significant role in combating air pollution. Trees act as an important and cost-effective solution to combat air pollution [2]. Plant leaves are major air pollutant receptors [5]. In addition, plants may absorb particulate air pollutants through their roots. Studies have shown that plants can reduce the number of particles in the air by onethird as compared to areas with no vegetation [6]. The response of plants to pollutant absorption can be used as sustainable tool to estimate air quality [7]. Several studies illustrated the effectiveness of a green belt strategy in addressing air pollution through planting tolerant trees in areas that are polluted [8,9]. Therefore, they represent a sustainable approach for removing air pollutants through mechanisms such as leaf sorption, vegetation fallout, and deposition over the leaf surface [10-12].
The resistance of different plants to air pollution depends on the plant’s ability to detoxify each pollutant, the concentrations of atmospheric pollutants, and the interactions between pollutants and plants [13]. The Air Pollution Tolerance Index (APTI) provides a reliable method for estimating the susceptibility level of tree species as the biofilter performance for managing ambient air quality. APTI value uses distinct biochemical parameters such as ascorbic acid, total chlorophyll, relative water content, and leaf extract pH that collectively reflect stress indicators [14-16]. Based on these four parameters, APTI values for the plant species can be measured. It indicates the sensitivity and tolerance of the different plant species growing in the same industrial area [17]. The plant species with lower APTI value can be used as bio-indicators, whereas the tolerant ones with higher values can serve as buffers [18,19].
Jubail Industrial City is the largest petrochemical industrial complex of its kind in the world, which includes many industries and high-end residential areas built according to the highest specifications. Since its inception, the Royal Commission for Jubail and Yanbu has worked to create a complete harmony between industrial development and environmental preservation, and one of the most important pillars for preserving the environment is the environmental monitoring program that includes air quality monitoring, meteorology, water industrial waste management, protection from oil and noise pollution and wildlife control. Jubail Industrial City is interested in afforestation on roadsides and within residential neighborhoods. The present work was carried out to study air pollution in Jubail Industrial City through measuring Air Pollution Tolerance Index (APTI) of three plant species grown in the study area so that we can identify the tolerant species to air pollution that may help in proper selection of plant species in urban plantation program at Jubail City.
Materials and Methods
Jubail is a city in the Eastern province on the Arabian Gulf coast of Saudi Arabia (longitude 40-49 degrees east and latitude 27,000 degrees north). The climate is hot, humid in summer and cold in winter. The study was carried out on eight tree plants species. The species were identified, and mature leaf samples were collected from each species in triplicate. The Air Pollution Tolerance Index (APTI) was determined by measuring four biochemical parameters that are ascorbic acid, chlorophyll, leaf extract pH and relative water contents in leaf samples according to the following methods.
Total Chlorophyll Content (TCh)
Total chlorophyll content was determined according to Arnon (1949) [20], 3 g of fresh leaves were blended and then extracted with 10 ml of 80% acetone and left for 15 min. The liquid portion was decanted into another test-tube and centrifuged at 2,500 rpm for 3 min. The supernatant was saved and utilized for chlorophyll estimation. Absorbance was read at 645 nm and 663 nm in Spectronic-20.
Chlorophyll ‘a’ (mg/L) = (0.0127) × (O.D.663) – (0.00269) × (O.D.645)
Chlorophyll ‘b’ (mg/L) = (0.0229) × (O.D.645) – (0.00468) × (O.D.663)
Total chlorophyll (mg/L) = (0.0202) × (O.D.645) + (0.00802) × (O.D.663)
pH of Leaf Extract
This was done following the method adapted by Agbaire and Esiefarienrhe (2009) [21]. 5g of the fresh leaves was homogenized in 10 ml ionized water. This was filtered and the pH of the leaf extract determined after calibrating pH water with buffer solution of pH 4 and 9.
Ascorbic Acid (AA) Content
Ascorbic acid content (expressed as mg/g) was measured using spectrophotometric method [22]. 1 g of the sample was placed into a test-tube, 4ml oxalic acid – EDTA extracting solution was added then 1 ml of orthophosphoric acid followed by 1 ml 5% tetraoxosulphate acid. To the mixture 2 ml ammonium molybdate was added and then 3 ml of water. The solution was then allowed to stand for 15 min, after which the absorbance at 760 nm was measured with a spectrophotometer. The concentration of ascorbic acid in the samples was then extrapolated from a standard ascorbic acid curve.
Relative Water Content (RWC)
RWC was determined according to Barrs and Weatherly (1962) [23]. RWC is a ratio of the amount of water in the leaf tissue at sampling to that present when fully turgid. A composite sample of leaf discs was taken and the fresh weight was taken and then leaf was floated on water for up to 24 h. The turgid weight was then recorded, and the leaf tissue was subsequently oven-dried to a constant weight at about 85°C for 24 h. RWC is calculated by using the following formula:
Air Pollution Tolerance Index (APTI)
APTI of leaf was calculated by using the equation, which was developed by Singh and Rao (1983) [24]. The equation has been given as follows:
Where, A is the ascorbic acid content in the leaf in mg/g dry weight, T is total chlorophyll content of leaf in mg/g dry weight, P is the pH of the leaf extract, and R is the percentage (%) RWC of the leaf.
Statistical Analysis
All data were expressed as mean ± SD by one-way ANOVA with plant sample as the main factor using statistical software of SPSS Ver. 24 (IBM SPSS, 2016). Comparisons of means when the factor had a significant effect were obtained using Duncan test (1955) [25]. A probability of P<0.05 was required for statements of significance.
Results
Total Chlorophyll Content (TCh)
As shown in Table 1 and Figure 1 the highest concentration of total chlorophyll was recorded in Parkinsonia aculeate, as it was 0.062 mg/g while the lowest concentration (0.033 mg/g) was found in leaves of Ficus altissima. Total chlorophyll content in leaves of Conocarpus lonciforius was not statistically different from that in F. altissima as it was 0.036 mg/g. The other study species contain intermediate amount of total chlorophyll content ranged from 0.042 to 0.056 mg /g.

Figure 1: Total Leaf Chlorophyll in different types of plant samples.
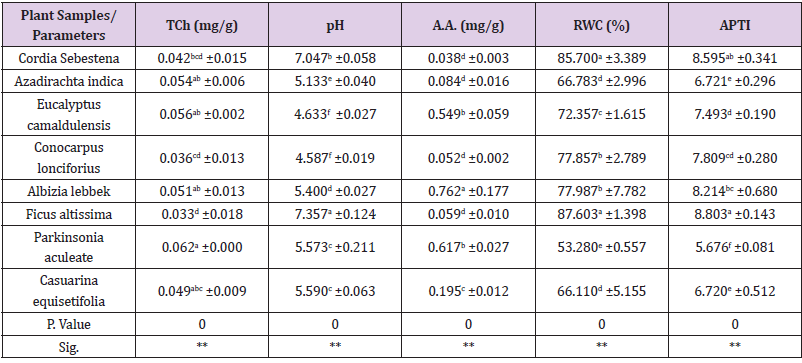
Table 1: Average values for biochemical parameters (TCh, pH, A.A and RWC) and Air Pollution Tolerance Index (APTI) in leaves of different Plant Samples.
Note: Where: (M±SD) = Mean ± Standard Division. (TCh), Total Leaf Chlorophyll, pH of leaf extract, (A.A) Ascorbic Acid Content, (RWC) Relative Water Content and Air Pollution Tolerance Index (APTI). a,b,c,d,f and e = Means within the same column with different superscripts are significantly different at (P<0.05) level.
Leaf Extract pH
Values of pH for leaves extract found in acidic rang as most species had pH values lower than six (Table 1 & Figure 2). pH 4.63 and 4.59, minimum values, were recorded in leaves of Eucalyptus camaldulensis and Conocarpus lonciforius respectively. In leaves of F. altissima and Cardia sebestena maximum values of pH was found (7.357 and 7.047 respectively).

Figure 2: pH of leaf extract in different types of plant samples.
Ascorbic Acid (AA) Content
As indicated from the results in Table 1 and Figure 3 the highest concentration of ascorbic acid was found in leaves of Albizia lebbek, P. aculeate and E. camaldulensis (0.762; 0.617 and 0.549 mg/g respectively). Leaves of C. sebestena; Conocarpus lonciforius and F. altissima contained the lowest ascorbic acid contents that were 0.038; 0.052 and 0.059 mg/g respectively.

Figure 3: Ascorbic Acid Content in different types of plant samples.
Relative Water Content (RWC)
The relative water content in the study species was found to be ranged from a minimum value of 53.28% in leaves of P. aculeate to a maximum value of 87.603 and 85.70% in leaves of F. altissima and C. sebestena respectively (Table 1 & Figure 4).

Figure 4: Relative water content in different types of plant samples.
Air Pollution Tolerance Index (APTI)
Among the study plant species F. altissima, C. sebestena and A. lebbek demonstrated the highest APTI (8.803; 8.595 and 8.214 respectively) compared to other tasted species. In P. aculeate, the lowest APTI value of 5.676 was recorded. APTI in the remaining species under study showed intermediate values of 7.493 and 6.72 in E. camaldulensis and Casuarina equisetifolia respectively (Figure 5).

Figure 5: Air Pollution Tolerance Index (APTI) in different types of plant samples.
The Correlation of Biochemical Parameters with APTI
The correlation matrices were worked out among various analyzed parameters, and they are presented in Table 2. APTI showed significant positive correlation with leaf extract pH and RWC (r=0.464 and 0.992 respectively, p<0.01), while a significant negative correlation was showed with TCh and AAC (r=-0.587 and -0.318 respectively, p<0.05). It was observed a strong positive correlation between AAC and TCh (r=0.506, p<0.01) as well as between RWC and pH (r=0.48, p<0.01). In contrast AAC showed a significant negative correlation with RWC and pH (r=-0.437 and -0.355 respectively).
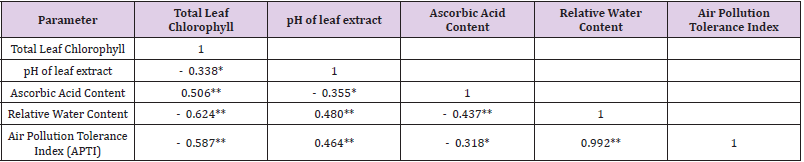
Table 2: Correlation between the APTI values and biochemical parameters estimated from different leaf plant samples.
Note: Where: (*) Correlation is significant at the 0.05 level, and (**) Correlation is significant at the 0.01 level.
Discussion
Air quality affects human respiration and quality of life on earth and changes with the number of toxic pollutants in the atmosphere [26]. In dry climates, air quality becomes even worse due to various gaseous and particulate materials suspended in air. Air pollution not only affects humans, but plants as well, causing foliar chlorosis or necrosis [26]. The tolerance behavior of trees to air pollutants can be best described to assess their potential in remediating the air pollution problem and purifying the local air of an area [27]. Roy et al. (2012) [28] added that green plants might be perceived as living filters that lessen air pollution by adsorbing, absorbing, accumulating, and detoxifying pollutants while remaining in a healthy condition. Plants can be used as a bio-monitor if they are sensitive to different pollutants, while tolerant ornamental plant species can be used as a sink for air pollutants [29]. The degree of sensitivity and tolerance varies among plant species.
Since a number of environmental benefits can be desired by planting tolerant species in polluted areas so evaluation of plants with respect to their tolerance level to air pollution may be essential. The biochemical synthesis in plants is directed by many environmental conditions there for an evaluation of the biochemical parameters of tree can be immense for determination of their tolerance behavior. To evaluate the tolerance level of plant species to air pollution, Singh and Rao (1983) used four leaf parameters to drive an empirical number indicating the Air Pollution Tolerance Index (APTI). APTI is a synthetic index that integrates the effects of RWC, leaf extract pH, TCh, and AAC for quantifying the tolerance of a species for air pollution [30]. Air pollutants may impact a plant’s internal physiology, which causes variation in RWC, pH, TCh, and AAC values, and subsequently APTI values [31]. Plants with greater APTI values are more tolerant to pollutants and therefore are desirable for planting in polluted areas [32].
In the present study, APTI was calculated for 8 tree plant species growing in Jubail Industrial City. The results of the study revealed that APTI for the study species ranged from 5.676 in P. aculeate to 8.803 in leaves of F. altissima indicating that F. altissima was the most tolerant plant in the study area in comparison to other study species while P. aculeate was the most sensitive one. APTI values of 8.595 and 8.214 in C. sebestena and A. lebbek respectively indicated the low sensitivity of these two species comparing with E. camaldulensis and Casuarina tree where APTI values were 7.493 and 6.72 respectively.
Four biochemical parameters were analyzed for APTI and the results revealed that these parameters played a significant role to determine resistivity and susceptibility of plant species. Among these four biochemical parameters pH and RWC had the greatest impact on APTI values so pH and RWC played important role in nullifying the detrimental effects of air pollution in plants as is evident from the results obtained. The role of pH is that it participates in the regulation of the sensitivity of a plant to pollution. When gaseous air pollutants in the cell sap, such as SO2, NO2, and CO2 diffuse, they convert into acidic radicals [33]. Leaves, with lower pH values are more influenced by atmospheric pollutants, while those with higher pH are more tolerant to pollutants [34]. Similarly, we observed law pH in species of high sensitivity, and high pH in species that showed law sensitivity in the study site. The influence of pH on tolerance to pollution is loosely tied to the metabolism of ascorbic acid. pH apparently has a direct positive relationship in the breakdown of hexose sugar to ascorbic acid as high pH favors this process and promotes more ascorbic acid accumulation [35]. Ascorbic acid in plant leaves has multiple functions to perform through cell wall synthesis, cell division, photosynthetic carbon fixation and acts as a strong reducer protecting the plants against reactive oxygen species (ROS), thereby improving the tolerance ability of the trees against air pollution [27].
Water is a critical element that facilitates the maintenance of plant physiological balance when conditions are strenuous (difficult or stressful) due to air pollution [33]. Water in plants maintains leaf temperature, enables nutrient uptake, and sustains metabolic activities. Pollutants may increase membrane permeability, resulting in loss of water and nutrients as well as premature senescence of leaves [26]. High water content in plants enables the plant to dilute acidity that may occur in the cytoplasm of leaf cells [36]. The status of leaf water in plants is directly linked to numerous physiological conditions such as respiration, transpiration, and growth [37].
When the relative water content is high, the plant becomes more tolerant of air pollution under tough conditions [33]. In the present study, the more tolerant species exhibited high RWC up to 87.603 while low RWC was recorded in the species of high sensitivity. Vegetation behaves as a sponge or sink of air pollutants including gases and particulate matter detrimental to the fauna [35]. The entry of air pollutants via the stomata causes the clogging up of the stomata leading to a drastic decrease in the photosynthetic rate which intern reduces the sugar, protein and chlorophyll quantities of the leaf [38]. Total chlorophyll content in the leaves of species under investigation didn’t show high effective role in decreasing sensitivity to pollution in the study area. It was found that F. altissima recorded as much more tolerant species in the study area contained lowest TCh while the most sensitive species in the study area (P. aculeate) had highest TCh.
Therefore, it can be inferred that the two most important parameters that maintained the defense mechanism in study tree species are pH and RWC, which was ensured by study of correlation coefficient between the four biochemical parameters and APTI. A strong positive correlation was indicated between RWC and APTI as well as pH and APTI. The study revealed a strong positive correlation between AAC and TCh, suggesting that the chlorophyll content is related to the metabolism of AAC [39]. Based on the APTI values the plants were conveniently grouped as follows [40] Table 3. In the present study APTI values for the leaves collected from trees of the study species didn’t exceed value of 9 so all study species are sensitive but showed varied degree of sensitivity.
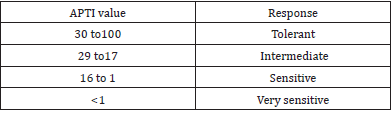
Table 3:
Conclusion
According to the results of the present research biochemical parameters and APTI of the study species are strongly affected by the pollution in the study area. Although the study species are considered as sensitive species, according to the values of APTI, but they had varied degree of sensitivity to pollution in the study site. F. altissima demonstrated the lowest sensitivity and P. aculeate was the most sensitive species amongst the study species. Because of that, it can be concluded that the study tree species are good bioindicators for pollution in the study site. It’s recommended that more tolerant plant species should be incorporated into the green belt design of Jubail Industrial City to enhance long term atmospheric pollution mitigation practices. Much more investigation are required on numerous plant species growing around various pollution sources for identifying effective pollutant tolerant plant species.
Availability of Data and Materials
The datasets used and/or analyzed during the current study are available from the corresponding author on reasonable request.
Ethical Approval
Not Applicable.
Consent to Participate
Not Applicable.
Consent to Publish
I, the undersigned, give my consent for the publication of identifiable details, which can include data (“Material”) to be published in the above Journal and Article. I confirm that I have seen and been given the opportunity to read both the Material and the Article (as attached) to be published by Taylor & Francis. I have discussed this consent form with my colleges, the author of this paper. I understand that all journals may be available in both print and on the internet and will be available to a broader audience through marketing channels and other third parties. Therefore, anyone can read material published in the Journal. I understand that readers may include not only medical professionals and scholarly researchers but also journalists and general members of the public.
Authors Contributions
1. Dr. Samrh A. Amin: Conceived and designed the analysis; data and analysis tools; wrote the paper.
2. Dr Abeer: Collected the sample and data, wrote the paper.
3. Dr Eman: Collected the data, Wrote the paper.
4. Amal El zahrani: Performed the analysis.
Funding
No Funding received.
Competing Interests
The authors declare that they have no known competing interests or personal relationships that could have appeared to influence the work reported in this paper.
References
- Sánchez-Chardi M (2016) Biomonitoring potential of five sympatric Tillandsia species for evaluating urban metal pollution (Cd, Hg and Pb). Atmos Environ 131: 352-359.
- (2016)World Health Organization (2016) Ambient air pollution: A global assessment of exposure and burden of disease.
- Singh H, Yadav M, Kumar N, Kumar A, KumarM (2020) Assessing adaptation and mitigation potential of roadside trees under the influence of vehicular emissions: A case study of Grevillea robusta and Mangifera indica planted in an urban city of India. PLoS ONE 15(1): 227-380.
- Walia K, Aggrawal R, Bhardwaj S (2019) Evaluation of air pollution tolerance index and anticipated performance index of plants and their role in development of green belt along national highway-22. Int J Curr Microbiol Appl Sci 8(03): 2498-2508.
- Panigrahi T, Satpathy JK, Panda RB (2014) Effect of air pollutants on different plant species found in ITR Complex, Chandipur. Int J Green Herbal Chem 3: 29-34.
- Setälä H, Viippola V, Rantalainen A, Pennanen A, Yli-Pelkonen V (2013). Does urban vegetation mitigate air pollution in northern conditions. Environ Pollut 183: 104-112.
- Rai PK, Panda LLS, Chutia BM, Singh MM (2013) Comparative assessment of air pollution tolerance index (APTI) in the industrial (Rourkela) and nonindustrial area (Aizawl) of India: an ecomanagement approach. Afr J Environ Sci Technol 7: 944-948.
- Prajapati SK, Tripathi BD (2008) Anticipated performance index of some tree species considered for green belt development in and around an urban area: a case study of Varanasi city, India. J Environ Manag 88: 1343-1349.
- Pathak V, Tripathi BD, Mishra VK (2011) Evaluation of anticipated performance index of some tree species for green belt development to mitigate traffic generated noise. Urban For Urban Green 10: 61-66.
- Ram SS, Majumder S, Chaudhuri P, Chanda S, Santra SC, et al. (2014). Plant canopies: biomonitor and trap for re-suspended dust particulates contaminated with heavy metals. Mitig Adapt Strat Glo 19: 499-508.
- Li Y, Wang Y, Wang B, Wang Y, Yu W (2019) The response of plant photosynthesis and stomatal conductance to fine particulate matter (PM2.5) based on leaf factors analyzing. J Plant Biol 62: 120-128.
- Baraldi R, Neri L, Costa F, Facini O, Rapparini F, et al. (2019) Ecophysiological and micromorphological characterization of green roof vegetation for urban mitigation. Urban For Urban Green 41: 127-138.
- Sen A, Khan I, Kundu D, Das K, Datta J K (2017) Ecophysiological evaluation of tree species for biomonitoring of air quality and identification of air pollution tolerant species. Environ. Monit. Assess 189 (6): 262.
- Pandey AK, Pandey M, Mishra A, Tiwary SM, Tripathi BD (2015) Air pollution tolerance index and anticipated performance index of some plant species for development of urban forest. Urban For Urban Green 14: 866-871.
- Jain S, Bhattacharya T, Chakraborty S (2019) Comparison of plant tolerance towards air pollution of rural, urban and mine sites of Jharkhand: A biochemical approach to identify air pollutant sink. In Advances in Waste Management. Kalamdhad A, Singh J, Dhamodharan K, (Eds.), Springer, Singapor, pp. 123-142.
- Karmakar D, Padhy PK (2019) Air pollution tolerance, anticipated performance, and metal accumulation indices of plant species for greenbelt development in urban industrial area. Chemosphere 237: 124522.
- Suvarna Lakshmi P, Lalitha Sravanti K, Srinivas N (2008) Air pollution tolerance index of various plant species growing in industrial areas. Ecosacn 2: 203-206.
- Rawal D, Sijapati J, Rana N, Pradhananga T (2001) Air pollution tolerance index of some tree species of Kathmandu Valley, Nepal. J Sci Technol 3: 119-122.
- Rai PK, Panda LL (2014) Dust capturing potential and air pollution tolerance index (APTI) of some roadside tree vegetation in Aizawl, Mizoram, India: an Indo-Burma hot spot region. Air Qual Atmos Heal 7: 93-101.
- Arnon DI (1949) Copper enzymes isolated chloroplasts. Polyphenoloxidase in Beta vulgaris. Plant Physiol 24: 1-15.
- Agbaire PO, Esiefarienrhe E (2009) Air Pollution Tolerance Indices of Some Plants around Otorogun Gas Plants in Delta State, Nigeria. Journal of Applied Sciences and Environmental Management 13: 11-14.
- Bajaj L, Kaur G (1981) Spectrophotometric determination of Ascorbic Acid in vegetation and fruits. Analyst 106: 117-120.
- Barrs HD, Weatherley PE (1962) A re-examination of the relative turgidity technique for estimating water deficits in leaves. Aust J Biol Sci 15: 413-428.
- Singh S K, Rao DN (1983) Evaluation of the plants for their tolerance to air pollution. Proc. Syp on Air Pollution control held at IIT, Delhi: 218-224.
- Duncan DB (1955) Multiple range and multiple F tests. Biometrics 11:1-41.
- Iftikhar A, Abdullah B, Dole JM, Shahid M, Ziaf K. (2019) Evaluation of the air pollution tolerance index of ornamentals growing in an industrial area compared to a less polluted area. Horticulture, Environment, and Biotechnology 6: 595-601.
- Sahu Ch, Basti S, Sahu SK (2020). Air pollution tolerance index (APTI) and expected performance index (EPI) of trees in Sambalpur town of India. SN Applied Sciences 2: 1327.
- Roy S, Byrne J, Pickering C (2012) A systematic quantitative review of urban tree benefits, costs, and assessment methods across cities in different climatic zones. Urban For Urban Green 4: 351-363.
- Deepalakshmi AP, Ramakrishnaiah H, Ramachandra YL, Radhika RN (2013). Roadside plants as bio-indicators of urban air pollution. IOSR J Environ Sci Toxicol Food Technol 3: 10-14.
- Dwivedi AK, Tripathi BD (2008) Effect of ambient air sulphur dioxide on sulphate accumulation in plants. J Environ Biol 29: 377-379.
- Krishnaveni M (2013) Biochemical changes in plants indicating air pollution. Int J Pharm Sci 5: 585-586.
- Achakzai K, Khalid S, Adress M, Bibi A, Ali S, et al. (2017). Air pollution tolerance index of plants around brick kilns in Rawalpindi, Pakistan. J Environ Manag 190: 252-258.
- Alotaibi MD, Alharbi1 BH, Al-Shamsi MA, Alshahrani ThS, Al-Namazi AA, et al. (2020) Assessing the response of five tree species to air pollution in Riyadh City, Saudi Arabia, for potential green belt application. Environmental Science and Pollution Research 27: 29(156-29170).
- Govindaraju M, Ganeshkumar RS, Muthukumaran VR, Visvanathan P (2012) Identification and evaluation of air-pollution-tolerant plants around lignite-based thermal power station for greenbelt development. Environ Sci Pollut Res 19: 1210-1223.
- Watson AS, Bai RS (2020) Phytoremediation for urban landscaping and air pollution control-a case study in Trivandrum city, Kerala, India. Environmental Science and Pollution Research 28(8): 9979-9990.
- Palit D, Kar D, Misra P, Banerjee A (2013). Assessment of air quality using several bio monitor of selected sites of Duragapur, Burdwan district by air pollution tolerance index approach. Indian J Sci Res 4: 149-152.
- Dhankhar R, Mor V, Narwal S (2015). Anticipated performance index of selected plant species in university campus area, Rohtak, Haryana, India. Int J Adv Multidiscip Res 2: 32-34.
- Narwaria YS, Kush K (2012) Environmental assessment of air pollution on roadside plants species at Dehradun, Uttrakhand. India J Environ Res Dev 7: 710-714.
- Díaz-Barradas MC, Zunzunegui M, Alvarez-Cansino L, Esquivias MP, Valera J, Rodríguez H (2018) How do Mediterranean shrub species cope with shade? Ecophysiological response to different light intensities. Plant Biol 20 (2): 296-306.
- Kalyani, Y, Singaracharya, MA (1995) Biomonitoring of air pollution in Warangal city, Andhra Pradesh. Acta Botanica indica 23(1): 21-24.
