 Mini Review
Abstract
A phase II trial is to determine if an experimental therapy has promising efficacy worthy of a further investigation. Traditionally, phase II clinical trials have been conducted using single-arm two-stage designs with a futility interim test by recruiting about 50 patients. Since Rich Simon proposed optimal design and minimax design for two-stage phase II trials in 1986, either of them has been chosen for most of phase II clinical trials. When designing a phase II trial, however, clinical trialists almost always question which design to select. In this article, we compare these two designs as an effort to give them some directions.
Keywords: Admissible Design; Expected Sample Size; Futility Test; Maximal Sample Size
Introduction
Cancer clinical trials are to investigate the efficacy and toxicity of experimental cancer therapies. If an appropriate dose level of an experimental drug is determined from a phase I trial, the drug’s anticancer activity is assessed through phase II clinical trials using a short term efficacy endpoint, such as tumor response. Phase II clinical trials are to screen out inefficacious experimental therapies before they proceed to further investigation through large scale phase III trials. For ethical reasons, clinical trials use multi-stage designs for possible early termination for futility or efficacy. Phase II trials generally require shorter study periods than phase III trials, so that two-stage designs are commonly used for phase II cancer clinical trials. Usually, phase II trials adopt a futility stopping rule only since there is no ethical issue to continue treating patients with efficacious therapy and we want to collect as much data as possible to be used when designing a future phase III trial on the experimental therapy.
Let p denote the true response rate of the experimental therapy and p0 that of a historical control. We want to test the null hypothesis H0 : p = p0 against the alternative hypothesis 1 0 H : p > p . A typical single-arm two-stage phase II trial with a futility interim test is conducted as follows.
Stage 1: Treat n1 patients using the experimental therapy and observe the number of responders X1.
a) If X1 ≤ a1, then reject the experimental therapy and stop the trial.
b) Otherwise, proceed to the Stage 2.
Stage 2: Treat an additional n2 patients using the experimental therapy and observe the number of responders X2.
a) If the cumulative number of responders X1 + X2 is less than or equal to a, then reject the experimental therapy.
b) Otherwise, accept the experimental therapy for further investigation.
Let p1(> p0) denote the response rate of the experimental therapy with a clinically meaningful improvement from p0. Usually, we assume that p1 - p0 = 0.15 to 0.2. For a two-stage design defined by (n1, n2, a1, a), we can calculate the 1-sided type I error rate α at p = p0 and power 1 - β at p = p1 based on the fact that X1 and X2 are independent binomial random variables. The sample size for a trial with a two-stage design is either n1 or n = n1 + n2. For the true response rate p, we can also calculate the expected sample size, EN(p), refer to Simon [1]. Let α∗ denote the upper limit of type I error rate and 1 - β∗ the lower limit we allow for a phase II trial. All two-stage designs with a type I error rate no larger than α∗ and a power no smaller than 1 - β∗ are called candidate designs. Among the candidate two-stage designs, the Simon’s (1986) minimax design has the smallest maximal sample size n and the optimal design has the smallest expected sample size under H0 : p = p0, EN(p0).
Minimax Design vs. Optimal Design
When designing a two-stage phase II trial with input parameters (p0, p1, α∗, 1 - β∗), one often questions which design to choose between the minimax design and the optimal design. By its definition, the optimal design is to stop the trial early when the study therapy does not seem to be efficacious based on the data from stage 1 without concerning about the required maximal sample size. So, one may choose the optimal design if the maximal sample size is not much of a concern and the protection against the worst scenario (i.e. when H0 is true is the primary concern). Oftentimes, however, the maximal sample size is regarded as the sample size required for a two-stage trial, so that it is not easy to ignore it.
This article is to advocate the minimax design when the two designs are very different in terms of the maximal sample size. Let’s compare the properties of these two designs for a specific design setting (p0, p1, α∗, 1 - β∗) = (0.1, 0.3, 0.05, 0.85). Under this design setting, the minimax design is (a1/n1, a/n) = (2/18, 5/27) and the optimal design is (a1/n1, a/n) = (1/11, 6/35). In order to save the expected sample size, optimal designs usually conduct the interim analysis earlier than minimax designs. For this example, n1/ n=11/35=0.314 for the optimal design is much smaller than n1/n = 18/27 = 0.667 for the minimax design. The single-stage design for this design setting is to treat n = 27 patients and to reject the study therapy if a = 5 or fewer responders are observed. Note that this design is exactly identical to the second stage decision rule of the minimax design. In other words, compared to the singlestage design, the minimax two-stage design does not require more patients and uses exactly the same rejection value in spite of the interim analysis. In this sense, the minimax design does not waste the statistical power at all by conducting an interim analysis. This becomes possible because the minimax design conducts the interim analysis very efficiently in terms of interim analysis time (n1) and rejection value (a1).
However, the optimal design sacrifices such efficiency, so that it should increase the maximal sample size n to recover the loss of power by the interim analysis. Table 1 displays the expected sample sizes of the minimax design and the optimal design for response rates between p0 = 0.1 and p1 = 0.3. The optimal design has the smallest EN for p = p0 = 0.1 among the candidate designs, so that it has a smaller EN than the minimax design for p = 0.1. However, its EN quickly increases as the true response rate p increases, so that its EN is larger than that of the minimax design for p > 0.1. As such, if the experimental therapy is more efficacious than the historical control, then the strength of the optimal design over the minimax design disappears. Based on these comparisons, we may select the minimax design over the optimal design. However, both of the minimax and optimality criteria have their own nice properties, so that one may not want to give up the optimality criterion by just selecting the minimax design. Oftentimes, in this case, there exist some designs that closely satisfy both criteria.
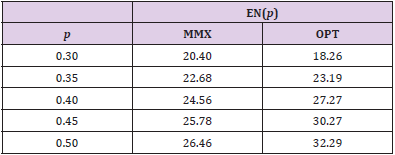
Table 1: Expected sample sizes, EN(p), for minimax (MMX) design (a1/n1, a/n) = (2/18, 5/27) and optimal (OPT) design (1/11, 6/35) for different response rates, p.
For (p0, p1, α∗, 1 - β∗) = (0.1, 0.3, 0.05, 0.85), Figure 1 displays the design minimizing EN(p0) for each n ∈ [27,37], In this figure, the x-axis is the maximal sample sizes n and the y-axis is EN(p0). As we have investigated above, the minimax design has (n, EN(p0)) = (27, 20.40) and the optimal design has (n, EN(p0)) = (35, 18.26) under the design setting. So, the optimal design requires 8 more patients than the minimax design in terms of maximal sample size, and the minimax design requires 2.14 more patients than the optimal design in terms of EN(p0). From the figure, we observe that the design with (n, EN(p0)) = (28, 18.68) requires just one more maximal sample size compared to that of the minimax design and its EN(p0) = 18.68 is very close to that of the optimal design, 18.26. Although this design satisfies neither the minimax nor the optimality criterion, it satisfies both criteria very closely. In fact, this design minimizes the weighted averages of maximal sample size and expected sample size under H0, w× n + (1− w)× EN( p0 ) for 0.06 < w < 0.63. Jung, et al. [2] and Jung, et al. [3] call such designs admissible designs. A user-friendly software displaying these designs and providing their properties is available from the second author.
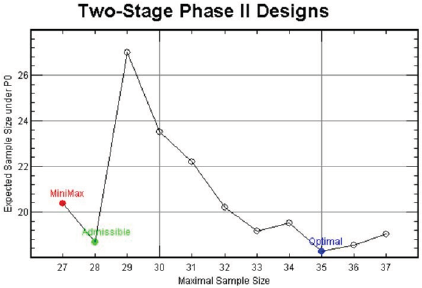
Figure 1: Two-stage designs for (p0, p1, α*, 1 – β*) = (0.1, 0.3, 0.05, 0.85).
So far, we have investigated the performance of minimax design, optimal and admissible designs under a specific design setting. But, this kind of comparisons hold over the wide range of design settings. As an optimality criterion, we have considered minimizing the expected sample size under H0 by a futility interim test. If we want to save the EN of two- stage phase II trials for efficacious experimental therapies, then we will have to conduct a superiority early stopping with or without a futility stopping. Change, et al. [4] proposed designs with both futility and superiority interim tests. We can carry out similar comparisons between different optimality criteria for such designs too.
References
- Simon R (1989) Optimal two-stage designs for phase II clinical trials. Controlled Clinical Trials 10(1): 1-10.
- Jung SH, Carey M, Kim KM (2001) Graphical search for two-stage phase II clinical trials. Controlled Clinical Trials 22(4): 367-372.
- Jung SH, Lee TY, Kim KM, George SL (2004) Admissible two-stage designs for phase II cancer clinical trials. Statistics in Medicine 23(4): 561-569.
- Chang MN, Therneau TM, Wieand HS, Cha SS (1987) Designs for group sequential phase II clinical trials. Biometrics 43(4): 865-874.
