 Research Article
Abstract
Left Ventricle End-Diastolic Pressure (LVEDP) is an accepted marker for Congestive Heart Failure (CHF). Right Ventricle End-Diastolic Pressure (RVEDP) is a marker for Right Heart Failure (RHF). Despite the wide usage of L/RVEDP in heart catheterization, the exact definition presuming fully automated calculation of L/RVEDP without human intervention with the monitor display has not yet been fully implemented. We fill this gap by exploiting kinetic features revealed when the pressure variation is measured with high resolution, namely, by tracing the third derivative of the pressure with respect to time (jerk analysis). In Physics, the notion of jerk means the rate of change of acceleration with respect to time. The ventricular pressures exhibit largest changes in their jerk during isovolumetric contraction and relaxation responding to the valves opening and closing. Observed regularities in the pattern of jerk behavior on these time intervals enable a precise determination of L/RVEDP and are correlated with CHF progression. This observation leads to a new independent CHF marker we call “Mitral Valve Actuation”, the average number of the third derivative local maxima points in the time interval between ECG R-peak and the end of isovolumetric contraction of the Left Ventricle (LV) bounded by an inflection point: the time moment when ventricular pressure rise max, / L dP dt is achieved. This number characterizes the non-uniformity and therefore loss or gain in quality of the ventricular preload and isovolumetric contraction. We further define “Valve Actuation” (VA) for each of four heart valves closure processes denoted as TVA, MVA, AVA and PVA following the valves’ names. The Valve Actuation functions, MVA and TVA, as time series, are found to be statistically uncorrelated with ventricular pressure rise functions max, / / L R dP dt which are classical quality markers of LV and RV systolic functions [1]. Further analysis of time intervals where “Valve Actuation” is calculated leads to new numerical characteristics of myocardial behaviour and new markers of heart failure, such as Mitral/Tricuspid Valve Actuation Triangular Index (MVATI/TVATI), and in the same way Aortic/ Pulmonary Valve Actuation Triangular Index (AVATI/PVATI). The new values of TVA, MVA, AVA, PVA, MVATI, TVATI, AVATI, PVATI are changing according to the patients’ hemodynamic and clinical status. While the Actuation group is generally increasing in the course of CHF progress, the Index group is respectively decreasing.
Abbreviations: CHF: Congestive Heart Failure; LV: Left Ventricle; RV: Right Ventricle; LVS: Left Ventricular Systolic Pressure; RVSP: Right Ventricular Systolic Pressure; LVESP : Left Ventricular End Systolic Pressure; RVESP: Right Ventricular End Systolic Pressure; LVEDP: Left Ventricular End Diastolic Pressure; RVEDP: Right Ventricular End Diastolic Pressure; LVPR: Left Ventricular Pressure Rise max, / L dP dt ; RVPR: Right Ventricular Pressure Rise max, / R dP dt ; LVPF: Left Ventricular Pressure Fall min, / L dP dt ; RVPF: Right Ventricular Pressure Fall min, / R dP dt ; PAP: Pulmonary Artery Pressure; PCWP: Pulmonary Capillary Wedge Pressure; ICP: Intra-Cardiac (blood) Pressure; US: Ultrasound; RSD: Relative Standard Deviation; LAP: Left Atrial Pressure; RAP: Right Atrial Pressure; TVA: Tricuspid Valve Actuation; MVA: Mitral Valve Actuation; AVA: Aortic Valve Actuation; PVA: Pulmonary Valve Actuation; MVATI: Mitral Valve Actuation Triangular Index; TVATI: Tricuspid Valve Actuation Triangular Index; AVATI: Aortic Valve Actuation Triangular Index; PVATI: Pulmonary Valve Actuation Triangular Index
Introduction and Definitions
Heart diseases including CHF are a major cause of death
according to the American Heart Association [2]. Left Ventricle End-
Diastolic Pressure (LVEDP) is an acknowledged prognostic marker
of congestive heart failure [3]. Measuring PAP and LAP (or it’s
proxy PCWP) directly with micro-manometer catheters (pressure
transducers), or implantable devices as CardioMEMS (Atlanta, GA)
and Vectorious (Tel Aviv, Israel) helps to predict CHF, as pulmonary
hypertension is a major chronic disease associated with CHF
[4]. LAP and/or PCWP could serve as marker for left ventricle
diastolic dysfunction, which is highly connected to CHF, however,
it is not exactly an equivalent to LVEDP being the exact marker
for left ventricle diastolic dysfunction [5,6] and thus the further
algorithmic extraction of LVEDP from LAP/LVP is needed. The
first modern paper where the deeper mathematical investigation
of left ventricular pressure (LVP) rise time interval was achieved
by D. Adler, et al. [1]. In that pioneering study the time from the
onset of contraction (which with the technology available then
was corresponding generally to R-peak of ECG) to the ventricular
pressure rise max, / L dP dt is suggested as an index of contractility
and denoted as t_d. The analysis in this work shows that td at any
given heart rate (HR), is a reliable index of contractility. The shifted
regression function ( ) d t HR serves as the indicator boundary for
myocardial dysfunction. In the present work we go deeper and
exploit “higher order” kinetic characteristics of the heart contraction
during the td time interval. We use a consistent feature of these
kinetics for the determination of LVEDP. We further introduce and
calculate “Mitral Valve Actuation” (MVA), a measure of extra nonlinearity
of the heart contraction on td time interval as a marker of
dysfunction. A similar calculation is provided for each of the other
three heart valves and is actually motivated by the work of Kenichi,
et al. [7], where RV relaxation period (τ ), peak change in minimum
pressure over time (Right Ventricular Pressure Fall min, / R dP dt and
RVEDP were recorded synchronously with echocardiographic data.
Despite the wide usage of L/RVEDP in heart catheterization, the
exact definition presuming the reliable fully automated calculation
of L/RVEDP without manual time alignment of the monitor display
in the course of catheterization, was not previously presented. For
example, in [8] LVEDP is defined as the measured LV pressure at
the nadir of the atrial contraction wave before the onset of a rapid
rise in left ventricular systolic pressure, or at the peak of R-wave
on ECG which may not be properly observed, or can be poorly
synchronized.
Such definition also does not offer algorithmic, fully automated
acquisition of LVEDP. We fill this gap by defining and presenting an
algorithm for fully automated calculation of L/RVEDP by jerk (third
derivative) analysis. The need for a fully automated calculation
of L/RVEDP was raised in the context of calibration process of a
non-invasive intra-cardiac pressure measurement system (ICPM)
discussed in [9].
In the current work we show that LVEDP (and RVEDP) can
be accurately and consistently determined using automated jerk
analysis. Remind that in Physics, the notion of jerk means the rate
of change of acceleration with respect to time: J(t)=da(t)/dt. Jerk is
the second derivative of velocity: J(t)=d2 v(t)/dt2. Jerk is the third
time derivative of position: J(t)=d3 v(t)/dt3. Jerk dimension is [
length /time3], or in SI units [ m /sec3]. Jerk is a vector, but we are
interested in its scalar magnitude. In transportation models and
natural systems design, the dynamic optimization theory based
models are used to determine the movement which minimizes
the jerk and provides the smoothest possible movement [10].
The ventricular pressures exhibit largest changes in their jerk
during isovolumetric contraction and relaxation related to valves
opening and closure. For example, in the left ventricle the onset of
isovolumetric contraction is associated with mitral valve closure and
corresponds to the time point where Left Ventricle End-Diastolic
Pressure (LVEDP) is measured. So the question is: how to exploit
jerk pattern to describe the “onset of isovolumetric contraction” in
exact computable terms? Investigating the time interval between
ECG R-peak and the time moment when the ventricular pressure
rise max, / L dP dt , is reached at the LVP inflection point (Figure
1), we observe that in the case when there is only one time point
with a jerk maximum within this interval, it exactly corresponds
to the onset of isovolumetric contraction. After this maximum,
the jerk exhibits a deep minimum towards the inflection point in
accordance with calculus rules. In many cases there are several
jerk maxima points within this interval. In this case, the “onset of
isovolumetric contraction” corresponds to the weighted average
time point of the two outright jerk maxima where the weights are
proportional to the absolute peak ratio of the jerk maxima. This
means, for example, that the LVEDP time point is 5 times closer to
the right jerk maximum point than to the left one, if the right jerk
maximum point peak is 5 times higher than the left one (Figure
2). In dynamics such pair of points is called attractive-repulsive
pairs. Physiologically this means that the largest myocardial muscle
contraction force change indicates the most visible start of the
isovolumetric contraction visually taken as LVEDP point.
The following definitions are derived from the above observations:
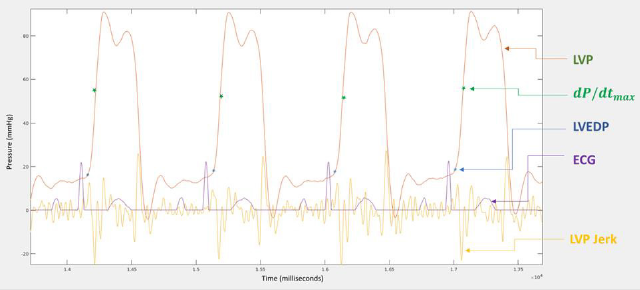
Figure 1: LVP and Jerk graphs and synchronized ECG.
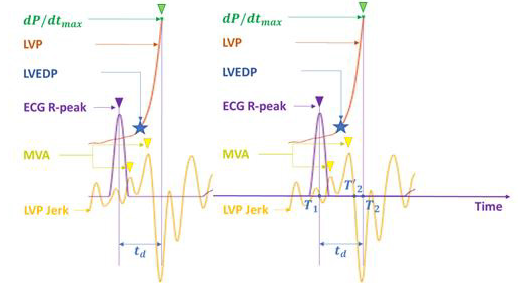
Figure 2: LVEDP and Jerk Maxima points
Figure 2a: Timescale in algorithm description.
Definition 1L
LVEDP is defined as the Left Ventricular Pressure (LVP) value corresponding to the LVP jerk maximum point within the time interval between ECG R-peak and the time moment when the ventricular pressure rise max, / L dP dt is reached at the LVP inflection point in case when there exists one such LVP jerk maximum; in case when there are more than one such maxima points, the LVEDP is defined as the LV pressure at a time point calculated as the weighted average of the two rightmost jerk maxima, where the weights are proportional to the absolute peak ratio of the jerk maxima. Thus, the jerk local maxima points of the LV pressure in the time interval between ECG R-peak and the LVP inflection point play the crucial role in the exact assessment of LVEDP. From the physiological point of view, the number of these local maxima points occurring during this period characterizes the non-uniformity and quality of the ventricular preload, isovolumetric contraction smoothness provided by Mitral Valve and quantifies the irregularities of the Mitral Valve closure. Hence, we get a new marker for this irregularity by calculating the average number of jerk local maxima in each of the time intervals between the respective ECG R-peaks and the LVP inflection points during the overall measurement time.
Definition 2L
We define the “Mitral Valve Actuation” (MVA) as the average
number of the LV pressure third derivative (jerk) local maxima
points in the time intervals between ECG R-peaks and the LVP
inflection points corresponding to ventricular pressure rise
max, / L dP dt across the overall measurement time.
Defined in this way, the “Mitral Valve Actuation” (MVA)
characterizes the non-uniformity and quality (loss or gain) of
the isovolumetric contraction controlled by Mitral Valve. We
have repeatedly observed during human studies (performed
under ethical committee approval) that following coronary stent
deployment for myocardial revascularization, MVA dropped
considerably, characterizing the overall functional improvement.
The working hypothesis is that an ideal healthy subject has MVA
= 1, meaning that the closer MVA is to 1, the better appears to be
myocardial performance – matching with improved LVEDP values.
(Figures 3 & 4) for the MVA dynamics of the NSTEMI myocardial
infarction patients before and after stent deployment.
In the same manner as LVEDP and MVA we define the RVEDP
and TVA.
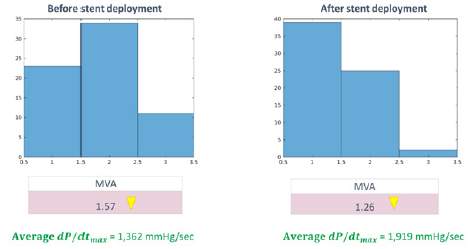
Figure 3: MVA for a patient with NSTEMI myocardial infarction.
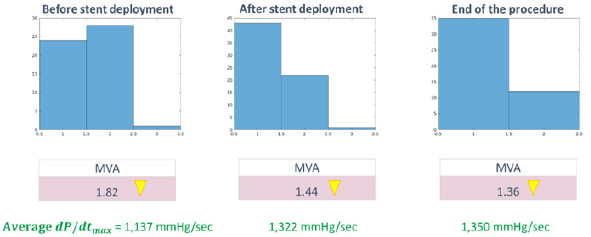
Figure 4: MVA histogram skewed left after stent deployment.
Definition 1R
RVEDP is defined as the Right Ventricular Pressure (RVP)
value corresponding to the RVP jerk maximum point within the
time interval between ECG R-peak and the time moment when
the ventricular pressure rise max, / R dP dt is reached at the RVP
inflection point in case there exists one such RVP jerk maximum; in
case when there are more than one such maxima points, the RVEDP
is defined as the RV pressure at the weighted average time point of
the two rightmost jerk maxima, where the weights are proportional
to the absolute peak ratio of the jerk maxima.
Thus, the jerk local maxima points of the RV pressure in the
time interval between ECG R-peak and the RVP inflection point
play the crucial role in the exact assessment of RVEDP. From the
physiological point of view the number of these local maxima
points occurring during this period characterizes the nonuniformity
and quality of the ventricular preload, isovolumetric
contraction smoothness provided by Tricuspid Valve and quantifies
the irregularities of the Tricuspid Valve closure. Hence we get a new marker for this irregularity by calculating the average number of
jerk local maxima in each of the time intervals between ECG R-peak
and the RVP inflection point during the overall measurement time.
Definition 2R
We define the “Tricuspid Valve Actuation” (TVA) as the
average number of the RV pressure third derivative (jerk) local
maxima points in the time intervals, between ECG R-peak and the
RVP inflection point corresponding to ventricular pressure rise
max, / R dP dt across the overall measurement time.
Defined in this way, the “Tricuspid Valve Actuation” (TVA)
characterizes the non-uniformity and quality (loss or gain) of the
isovolumetric contraction controlled by the Tricuspid Valve. It
was observe that after coronary stent deployment TVA dropped
considerably, characterizing the overall functional improvement.
The working hypothesis is that an ideal healthy subject has TVA =
1, meaning that the closer is TVA to 1, the better is the myocardial
functional state. Next, considering the descending slope of LVP, we
examine the number of jerk local maxima points on the time interval
between the closure of the Aortic Valve, i.e. the time moment where
the left ventricular pressure fall (LVPF) min, / L dP dt is reached and
the end point of isovolumetric relaxation corresponding to the
opening of the Mitral Valve.
Definition 3L
We define the “Aortic Valve Actuation” (AVA) as the average
number of the LV pressure third derivative (jerk) local maxima
points in the time intervals, between the LVP inflection point
corresponding to left ventricular pressure fall min, / L dP dt and the
onset of LV filling coinciding with the Mitral Valve opening across
the overall measurement time.
Unlike LVEDP time point, the opening of the Mitral Valve is
clearly detectable as it is very close to the absolute minimum of
LVP across the cardiac cycle. Defined in this way, the “Aortic Valve
Actuation” (AVA) characterizes the non-uniformity and quality
(loss or gain) of the isovolumetric relaxation controlled by Aortic
Valve. We have observed that after coronary stent deployment for
myocardial revascularization AVA dropped considerably, indicating
the overall functional improvement. The working hypothesis is that
for an ideal healthy subject AVA = 1, meaning that the closer is AVA
to 1, the better is the myocardial functional state.
In the same manner, as AVA is defined while investigating the
descending slope of LVP, we further define PVA when considering
the descending slope of RVP.
We examine the number of jerk local maxima in the time
interval between the closure of the Pulmonary Valve, i.e. the
time moment where the right ventricular pressure fall (RVPF)
min, / R dP dt is achieved and the end point of isovolumetric relaxation
corresponding to the opening of the Tricuspid Valve.
Definition 3R
We define the “Pulmonary Valve Actuation” (PVA) as the
average number of the RV pressure third derivative (jerk) local
maxima points in the time intervals, between the RVP inflection
point corresponding to right ventricular pressure fall min, / R dP dt
and the onset of RV filling by opening of the Tricuspid Valve across
the overall measurement time.
Unlike RVEDP time point, the opening of the Tricuspid Valve is
clearly detectable as it is very close to the absolute minimum of RVP
across the cardiac cycle. Defined in this way, the “Pulmonary Valve
Actuation” (PVA) characterizes the non-uniformity and quality (loss
or gain) of the isovolumetric relaxation provided by Pulmonary
Valve. It was observed that after ASD closure or coronary stent
deployment PVA dropped considerably, characterizing the overall
functional improvement. The working hypothesis is that for an
ideal healthy subject PVA = 1, meaning that the closer is PVA to 1,
the better is the myocardial functional state.
Thus, we have defined “Valve Actuation” (VA) for each of
four heart valves (Tricuspid, Mitral, Aortic, Pulmonary) closure
processes and denoted them as TVA, MVA, AVA and PVA following
the valves’ names. The new values of TVA, MVA, AVA and PVA are
progressively increasing according to the patient hemodynamic
and clinical status in the course of a gradual (or) staged evolution
of CHF. With a stable L/RVEDP calculation algorithm and the
“Valve Actuation” characteristics we turn to the investigation of
the statistics behind time intervals on which the “Valve Actuation”
values are calculated. More precisely, we present the histograms of
the distributions corresponding to these interval lengths. Denote by
the histogram triangular index (TI) the integral of the probability
density function of the intervals forming the histogram during the
measuring period divided by the density function’s maximal height,
or in other words, TI is calculated as the ratio of the histogram area
divided by its height.
Definition 4L
The Mitral Valve Actuation Triangular Index (MVATI) is the Triangular Index of the histogram built from the time intervals, between ECG R-peak and the LVP inflection point corresponding to ventricular pressure rise max, / L dP dt across the overall measurement time.
Definition 4R
The Tricuspid Valve Actuation Triangular Index (TVATI) is the Triangular Index of the histogram built from the time intervals, between ECG R-peak and the RVP inflection point corresponding to ventricular pressure rise max, / R dP dt across the overall measurement time.
Definition 5L
The Aortic Valve Actuation Triangular Index (AVATI) is the Triangular Index of the histogram built from the time intervals, between LVP inflection point corresponding to left ventricular pressure fall min, / L dP dt and the onset of LV filling by opening of the Mitral Valve across the overall measurement time.
Definition 5R
The Pulmonary Valve Actuation Triangular Index (PVATI) is
the Triangular Index of the histogram built from the time intervals,
between RVP inflection point corresponding to right ventricular
pressure fall min, / L dP dt and the onset of RV filling by opening of the
Tricuspid Valve across the overall measurement time.
The above definitions 4-5 are motivated by HRV triangular
index (HTI) which was defined as the integral of the probability
density function of RR intervals during the measuring period
divided by the density function’s maximal height. Here we calculate
only the short-term histograms (see [11] for short-term HTI), but
during the postoperative intensive care periods it is quite possible
to investigate also the long term TI-s. The new markers of heart
failure MVATI, TVATI, AVATI, PVATI are changing according to
the patient condition and are generally decreasing in the course
of CHF progress, while TVA, MVA, AVA and PVA are progressively
increasing.
Methods
Description of Equipment and the Experiment Setup
The system contains Mennen VitaLogik-5500 Medical Monitor with 4 analogue output channels of which 3 are occupied by intracardiac blood pressure channels and one ECG (II- lead) channel. The Monitor is connected to the computer via standard oscilloscope for signal digitalization. The digitalized signal is accumulated by the proprietary software which is synchronizing the Monitor channels, recording and processing the input data. The setup is placed in the catheterization laboratory and used in parallel to the catheterization laboratory equipment utilizing the same pressure lines from micro-manometer catheters (pressure transducers) during catheterization. The experiments were conducted under Ethical (Helsinki) committee approval during catheterization procedures at the Ziv Medical Center, Safed, Israel. In total 34 patients were investigated: 14 with Non-ST elevation (NSTEMI) myocardial infarction (out of them 7 with known CAD -Coronary Artery Disease), 5 with Atrial Septal Defect, 1 with Dilated Cardiomyopathy, 1 with Congestive Heart Failure, 14 underwent hemodynamic diagnostic catheterization (out of them 6 with known CAD). All the above patients were undergoing a planned catheterization procedure. During the procedure several recordings of the patients’ intra-cardiac pressure were taken using the above described setup. The acquired data was post-processed by the following algorithm.
Description of the Algorithm
I. The Monitor pressure data channels are synchronized with ECG data channel at 1 msec level. II. The moving window averaging is applied to all channels to smoothen the functions and enable to calculate numerical derivatives.
III. Identifying L/RVEDP time points:
• Finding R – peak times T1 on ECG (or S-peaks if R-peaks are
unavailable or insufficiently manifested).
• Finding max, / / L R dP dt times T2 on the cycle after ECG peak.
• Numerically differentiate the pressure P(t) three times on each
of the time intervals [T1, T2]
• Identify the maxima points of jerk function d3P(t)/dt3 on the
interval [T1, T’2] ⊂ [T1, T2], where T’2 is the start of jerk negative
zone near T2, see Figure 2a.
• If there exists one maximum of the jerk function on [T1, T’2] we
take the pressure value P(t) at this point as L/RVEDP.
• If there exist several maxima of the jerk function on [T1, T’2] we
take the weighted average time point of the two right maxima
accounting these jerk function maxima values and take the
pressure value P(t) at this point as L/RVEDP.
IV. Finding of L/RVESP Time Points:
• Following max, / / L R dP dt times T2 find L/RVSP times T3
corresponding to the absolute maximum max,L/R P on the period.
• Following max,L/R P find the times T4 corresponding to
min, / / L R dP dt .
• Following min, / / L R dP dt find the times T5 of L/RVESP
corresponding to the absolute minimum min,L/R P on the period.
V. When the time moments T1.....T5 are identified on each cardiac
cycle, the number of the LV/RV pressure third derivative
(jerk) function local maxima points are calculated on [T1, T2],
averaging over the whole recording period we get the “Mitral
Valve Actuation” (MVA) for LV and “Tricuspid Valve Actuation”
(TVA) for RV respectively.
VI. In the same way, on each cardiac cycle the number of the LV/RV
pressure third derivative (jerk) function local maxima points
are calculated on [T4,T5], averaging over the whole recording
period we get the “Aortic Valve Actuation” (AVA) for LV and
“Pulmonary Valve Actuation” (PVA) for RV respectively.
VII. At the next step we form the histograms of [T1, T2] and [T4,
T5] over the whole recording period both for LV and RV and
calculate the histogram triangular indexes MVATI/TVATI/
AVATI/PVATI as the ratio of the integral of the probability density function of the intervals forming each of the histograms
divided by the histogram maximal height.
VIII. The statistics for the above calculated values is provided in the
results section below.
Results
We measure stability of measured L/RVEDP in several ways:
I. Averaged in time L/RVEDP calculated value over all subjects
and hospital device average value shown on another monitor
are within 2 Standard Deviations radius of calculated values
within one another.
II. “Drawing” the Upper and Lower Envelopes of L/RVEDP as
time series (Figure 5), we observe that both Upper and Lower
Envelopes of L/RVEDP with their Standard Deviations are
within 2 Standard Deviations radius of calculated values.
Lower/Upper envelopes of L/RVEDP are built as sliding
Minimum/Maximum of 3 subsequent L/RVEDP values.
III. Relative Standard Deviation is only 17% for LVEDP and 5% for
RVEDP over all subjects and times supporting the stability of
the method (Figure 5). Tables 1 and 2
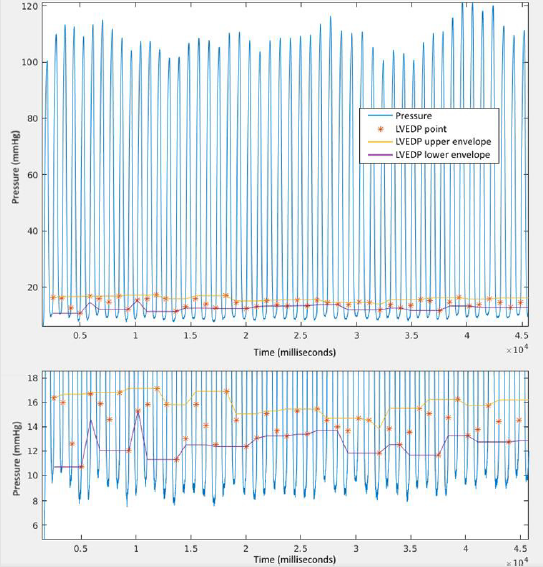
Figure 5: Lower and Upper envelopes of LVEDP points.
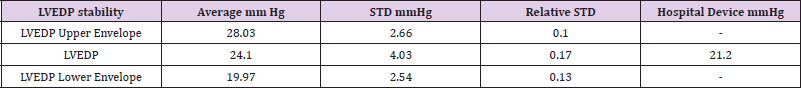
Table 1.
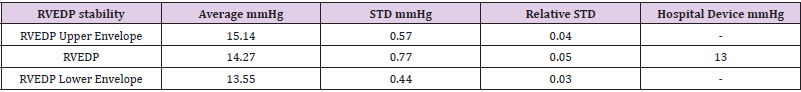
Table 2.
• LVEDP stability
Table 1.
• RVEDP stability
Table 2.
The below tables 3 and 4 show the statistical independence of
newly defined Valve Actuation (VA) values (Jerk maxima counts) for
all four valves TVA, MVA, AVA, PVA from ventricular pressure rise
max, / / L R dP dt , ventricular pressure fall min, / / L R dP dt and L/RVEDP, L/
RVESP respectively:
• Left jerk maxima count
Table 3.
• Right jerk maxima count
Table 4.
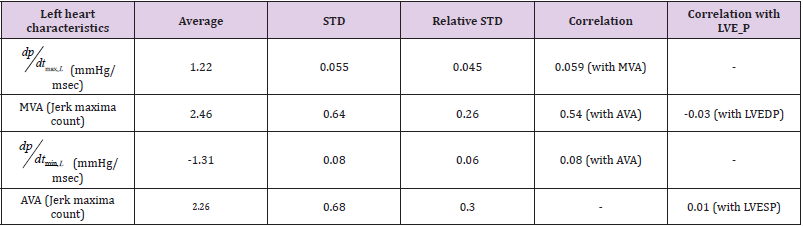
Table 3.
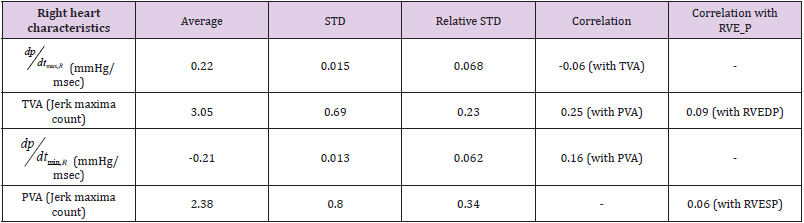
Table 4.
From the above tables, all Valve Actuation (VA) values (Jerk maxima counts) are statistically independent of the respective EDP, ESP and ventricular pressure rise/fall counterparties as time series. Further on, for NSTEMI patients the average AVA = 2.78 while for leftover group AVA = 1.75 (For all the group AVA = 2.26 ± 0.68). Hence, AVA may be considered as an independent marker for NSTEMI myocardial infarction diagnostics, though more statistical analysis is needed here on larger patient groups. In combination with max, / L dP dt and min, / L dP dt one can differentiate NSTEMI patients with preserved and reduced ejection fraction: (Table 5).
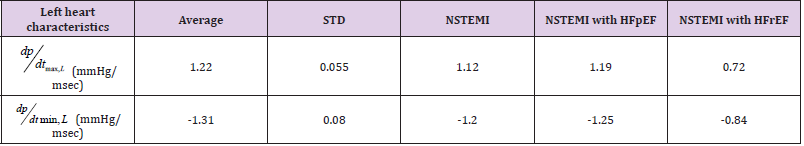
Table 5.
Remind that Valve Actuation Triangular Indexes are defined as the Triangular Indexes of the histograms built from the time intervals, between ECG R-peak and the L/RVP inflection point corresponding to ventricular pressure rise max, / / L R dP dt across overall measurement time and respectively from ventricular pressure fall min, / / L R dP dt to L/RVESP across overall measurement time. The correlations of the M/A/T/PVATI with M/A/T/PVA and L/REDP/ESP follow: (Table 6). The most interesting features here are that the left side M/AVATI are sufficiently low correlated with LVEDP while the right side T/PVATI exhibit sufficiently high correlation with RVEDP. Also TVATI is low correlated with LVESP. MVATI and AVATI can be the further markers differentiating NSTEMI Myocardial infarction with preserved and reduced ejection fraction: (Table 7).
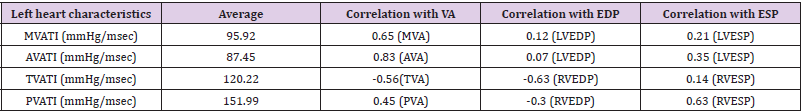
Table 6.
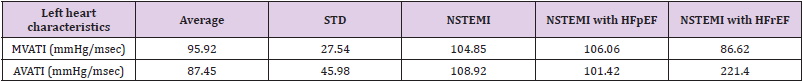
Table 7.
Discussion
We propose an algorithm for automated measurement of L/RVEDP based on locating the most bulleting changes in L/R ventricular pressure in terms of the third derivative (jerk) local maxima monitored in real time. Further investigation of jerk local maxima leads to new independent CHF markers we call “Valve Actuation” (MVA, TVA) which are a statistically independent from ventricular pressure rise max, / / L R dP dt which are classical quality markers of LV/RV systolic function. The average correlation between MVA and max, / L dP dt is only 6% and between TVA and max, / R dP dt is -6% according to our measurements. This is not surprising as the first characterizes the dynamics of Mitral valve closure and the second - Aortic valve opening. Respectively, TVA characterizes the dynamics of Tricuspid valve closure and max, / R dP dt Pulmonary valve opening. On the “back end” of Cardiac cycle the correlations are a bit larger, but still not significant. The average correlation between AVA and min, / L dP dt is only 8% and between PVA and min, / R dP dt is 16%, reflecting a smaller turbulence of the flow through Right ventricle. Investigating time intervals where the patterns of jerk local maxima changes are observed, we have introduced new numerical characteristics of myocardial performance such as Mitral/Tricuspid/Aortic/Pulmonary Valve Actuation Triangular Indexes (MVATI/TVATI/AVATI/PVATI) similar to HRV triangular index. These indexes are 40% (Left) - 60% (Right) correlated with the respective distributions’ standard deviations showing that there is a place for further investigations. These newly introduced values are changing according to the patient condition: The Indexes are generally decreasing, while “Valve Actuation” are generally increasing in the course of CHF progress. Being capable to measure independent behaviour characteristics of all 4 heart valves enables to obtain a full clinical picture of the patient heart condition. Implementation of these new parameters in advanced and automated cardiac monitoring systems will enhance the efficacy of cardiac performance evaluation and the quality of therapy.
Acknowledgement
The authors gratefully acknowledge Professor Zvi Gershon Grossman for valuable observations and comments.
References
- D ADLER, ES Monrad, OM Hess, HP Krayenbleuhl, EH Sonnenblick (1996) Time to , a Useful Index for Evaluation of Contractility in the Catheterization Laboratory. CIin Cardiol 19: 397-403.
- Benjamin, Michael J Blaha, Stephanie E Chiuve, Mary Cushman, Sandeep R Das, et al, (2017) Heart disease and stroke statistics-2017 update: a report from the American Heart Association. Circulation 135: 378-393.
- Teixeira R, Lourenço C, Baptista R, Jorge E, Mendes P, et al. (2011) Prognostic implications of left ventricular end-diastolic pressure in acute coronary syndromes with left ventricular ejection fraction of 40% or over. Rev Port Cardiol 30(10): 771-9.
- D M Mooney, E Fung, R N Doshi, D M Shavelle (2015) Evolution from electrophysiologic to hemodynamic monitoring: the story of left atrial and pulmonary artery pressure monitors. Front Physiol 6: 271.
- N Nerlekar, R E Peverill (2018) Confusion regarding the meaning of the term left ventricular filling pressure given the nonequivalence of left ventricular end-diastolic pressure and mean left atrial pressure. Am Heart J 196: e1-e2.
- A Kafi, B Lindgren, G Chaux, J Mirocha, W Cheng, et al. (2018) Low Correlation between PCWP and LVEDP in Patients With End-Stage Lung Disease.
- Kenichi Okumura, Cameron Slorach, Dariusz Mroczek, Andreea Dragulescu, Luc Mertens, et al. (2014) Right Ventricular Diastolic Performance in Children with Pulmonary Arterial Hypertension Associated With Congenital Heart Disease Correlation of Echocardiographic Parameters With Invasive Reference Standards by High-Fidelity Micro-manometer Catheter. Cardiovascular Imaging 7: 491–501.
- SeongIl Choi, Jeung-Hun Shin, Soon-Gil Kim, Jinho Shin, Young-Hyo Lim, et al. (2016) Two Distinct Responses of Left Ventricular End-Diastolic Pressure to Leg-Raise Exercise in Euvolemic Patients with Exertional Dyspnea. Korean Circ J 46(3): 350-364.
- Alexander Brenner, Felix Brenner, Yuri Brodsky, David Fiks, Sergey Yusimov, et al. (2018) A system and method for non-invasive measurement of Cardiovascular blood pressure. Biomed J Sci & Tech Res 5(4).
- N Hogan (1984) An organizing principle for a class of voluntary movements. Journal of Neuroscience 4(11): 2745-2754.
- F Shaffer, JP Ginsberg (2017) An Overview of Heart Rate Variability Metrics and Norms. Front Public Health 5: 258.
