info@biomedres.us
+1 (502) 904-2126
One Westbrook Corporate Center, Suite 300, Westchester, IL 60154, USA
Site Map

Received: October 01, 2022; Published: October 14, 2022
*Corresponding author: Nabila Perveen, Department of Pharmaceutical Chemistry, Faculty of Pharmacy, AIMST University, Malaysia
DOI: 10.26717/BJSTR.2022.46.007382
Introduction: All parts of the Phyllanthus emblica Linn. plant, notably the fruit, are utilised for therapeutic purposes. In traditional medicine, it is used to treat diarrhoea, jaundice, and inflammation. Studies have documented that P. emblica has antimicrobial, antiallergic, analgesic and antipyretic, adaptogenic, hepatoprotective, antitumor and antiulcerogenic activities.
Objective: The present study aims to evaluate the total phenolic content and antioxidant potential of P. emblica extracts isolated by cold maceration with various polarity solvents such as methanol, ethanol, and n-hexane.
Methods: The fruits of P. emblica were extracted by cold maceration method using three different extraction solvents (methanol, ethanol and n-hexane). The determination of total phenolic content was performed by UV-Spectrophotometry. The antioxidant activity of each extract was performed using DPPH (2,2 diphenyl-1-1picrylhydrazyl) method. The characterization of each P. emblica extract was done by using FTIR Spectrometry.
Results: Methanol was found as the best extracting solvent for extraction of phenolics and antioxidants compared to ethanol and n-hexane. Methanol extract of P. emblica had the highest of total phenolic content (99.01 mg GAE/g) while n-hexane extract had the lowest total phenolic content (56.29 mg GAE/g). The highest antioxidant activity was given by methanol extract of P. emblica fruit with IC50 0.035 sssg/ ml whereas the lowest antioxidant activity was given by n-hexane extract with IC50 10.93 𝜇g/ml.
Conclusion: The results imply that the methanolic extract of P. emblica fruit exhibited stronger antioxidant activities and might be considered as a potential plant source of antioxidants, which have free radical scavenging activity and might be useful for cyto- hepato-and radioprotection, as well as reducing oxidative stress in many pathological conditions.
Keywords: Phyllanthus Emblica Linn; Antioxidant; FTIR; UV Spectroscopy; Phenolic Content
Medicinal plants are nature’s gift to mankind which help to promote a disease-free healthy life. The use of traditional medicines, primarily derived from plant sources, has played a significant role in the management of many chronic ailments including diabetes, particularly in Asian nations. Traditional medicines all over the world are currently being revalued by an extensive activity of research on many plant species and their medicinal properties. According to WHO report, 80% of the populations living in the developing countries rely almost exclusively on traditional medicine for their primary healthcare requirements. Herbal medicines have been utilised by mankind since time immemorial to treat various illnesses and provide an alternative to synthetic compounds as plants have traditionally been thought of as either non-toxic or less toxic [1]. Phyllanthus emblica Linn. also known as Indian gooseberry or Amla, is a typical folk remedy used in the Indian indigenous system of medicine to treat a variety of diseases. P. emblica was attributed by Linneaus in reference to the unique feature of the plant. The branches of this tree are peculiarly flattened in the shape of a leaf; the flowers bloom from the edges of these leaf-like branches. Hence, the name Phyllanthus, which comes from the Greek works “phyllon” (leaf) and “anth`os” (flower). The name Emblica is almost certainly derived from the “corruption” of the Sanskrit name “Amlika”, although some experts believe it could derive from the “corruption” of the Arabic word name “Embelgi’ which used by Arabic physicians to identify its fruits. (Tables 1-3) shows the language, common names in different places and scientific names of Phyllanthus emblica Linn, respectively.
Table 1: International and local common names of Phyllanthus emlica.

Table 2: Common names in different places.

Table 3: Number of Coffee leaves image used.

P. emblica is widely distributed throughout most tropical and subtropical countries and is native to South and Southeast Asia. This plant belongs to the family Euphorbiaceae which can be found in India, Sri Lanka, Uzbekistan, Pakistan, China, Indonesia, Malaysia, and Thailand. P. emblica can be grown on a hillside up to 200 metres high and cultivated. Phyllanthus is a very large genus of approximately 550-750 species which is subdivided into 10 to 11 subgenera. The taxonomic classification of P. emblica is followed in Table 4 [2]. P. emblica tree is a small to medium-sized deciduous tree with an average height of 8-18m, with a greenish-grey bark that exfoliates in small thin irregular flakes, revealing the fresh surface of a different colour beneath the older bark. The main stem has an average girth of 70cm. Most of the time, the main stem is separated into 2-7 scaffolds near the base. The leaves are 10-13mm long, 3mm broad and are densely set in pinnate fashion, giving the branches a feathery appearance. Leaves appear after the fruits have set. Flowers are unisexual, 4-5mm long, pale green in colour and borne in clusters of 6-10 in leaf axils. Fruits are fleshy, almost globose in shape, with a diameter of 2.1-2.4cm, a weight of 5.3-5.7g and a volume of 4.5-5.0ml. The fruit’s stone is 6 ribbed, separating into three segments, each with two seeds; seeds are 4-5mm long and 2-3mm wide, weighing 572-590mg each [2]. Figure 1 shows the different parts of the plant.
Table 4: Taxonomic hierarchy of Phyllanthus emblica.

Note: A: leaf; B: stem; C: flower; D, E: fruit; F: seed
Figure 1: Plants of Phyllanthus emblica.

It contains alkaloids, tannins and phenols. Fruits have 28% of the total tannins distributed in the whole plant. The fruit contains two hydrolysable tannins, Emblicanin A and Emblicanin B, which have antioxidant activity; one on hydrolysis gives Gallic acid, ellagic acid and glucose wherein the other gives ellagic acid and glucose respectively. The fruit also contains phyllembin. Furthermore, numerous phytochemicals, including Gallic acid, corilagin, furosin and geraniin, were discovered using activity directed fractionation. Flavonoids like quercetin, alkaloids like phyllantine and phyllantidine are also found in P. emblica. Along with these, it largely contains amino acids, carbohydrates and other compounds given in Table 5. Its fruit juice contains the highest concentration of vitamin C. The vitamin C levels are even more than those in oranges, lemons or tangerines [2].
Table 5: Chemical constituents of Phyllanthus emblica.

According to the two mains Indian Ayurvedic classic books, Charaka Samhita and Sushruta Samhita, P. emblica is regarded as “the best among rejuvenator” and “the best among the sour fruits”. It is a major component in well-known medicinal formulas like Triphala (“three fruits”) and Chyawanprash, a general tonic for people of all ages that boosts mental and physical health. Among the myths, Chyawanprash was purportedly invented to rejuvenate an old ancient sage by Chyavana Maharishi, a great meditator in Hindu faith, upon his marriage to a young wife. The beneficial therapeutic properties of P. emblica, including hypoglycemic effect, have been recorded in “Materia Medico”, a classical Indian literature on the Ayurvedic system of medicine. There are two historical events in which this plant was employed for medical purposes: the famine of 1939-1940 and cases of scurvy in the Indian army in Nassirdab, today called as Rajasthan, in 1837[1]. Viewing from the pharmacological aspect, P. emblica is shown to display a wide array of biological activities. All parts of the plant, notably the fruit, are utilised for therapeutic purposes. In traditional medicine, it is used to treat diarrhoea, jaundice and inflammation. Studies have documented that P. emblica has antimicrobial, antiallergic, analgesic and antipyretic, adaptogenic, hepatoprotective, antitumor and antiulcerogenic activities. Plants are also used to treat fever, cough, bronchitis, skin disease, enlarged spleen and liver [1]. In addition, P. emblica is said to exhibit potent antioxidant and free radical scavenging activity, which will be further discussed in this paper.
Emblicanin A and Emblicanin B have a very strong antioxidant effect. It has been discovered that these two novel tannins can protect erythrocytes against the oxidative stress induced by asbestos, a generator of the superoxide radical. Tannins prevent polymerization of vincyclic monomers (MMA) to polymers (PMMA) due to the presence of a hydroxyl radical. The antioxidant properties of free and bound phenolic fractions of P. emblica have been investigated using their reducing power and DPPH (diphenylpicrylhydrazyl) free radical scavenging ability [1]. The phenolic compounds are good electron donors with a redox pattern that allows them to scavenge free radical (FR) and reactive oxygen species (ROS) and prevent their damaging effects [3]. Thus, the aim of the present study is to comprehensively evaluate the total phenolic content and antioxidant potential of P. emblica extracts isolated by conventional extraction method with various polarity solvents such as methanol, ethanol, and n-hexane.
The fruits for the present study were purchased of the respective plant Phyllanthus emblica were collected from Chinese shop as shown in Figure 2. The fresh fruits were well washed with clean and distilled water to remove impurities and dirt. Then, the seeds were separated from the fruits using sharp knife and the fruit pulps were cut into small pieces as shown in Figure 3. The small pieces of fruits were crushed with mortar and pestle to obtain a thick plant material.
Figure 2: Phyllanthus emblica fruits.

Figure 3: Small cut pieces of Phyllanthus emblica fruits.

Figure 4: Phyllanthus emblica methanolic, ethanolic and n-hexane dry extracts (from left to right).

Phyllanthus emblica fruits cut pieces of 250g were transferred with 400 ml of solvent containing 95% ethanol was into the conical flask and swirled. The methanol and n-hexane solvents were added separately as stated above for ethanol and were allowed to stand for the maceration process for seven days. After seven days, the liquid was strained off and clarified by filtration using muslin cloth. The filtrate was then collected and evaporated using a rotary evaporator to get a dark brown viscous extract. The ethanolic, methanolic and n-hexane extracts, after evaporation were obtained, labelled and stored in the refrigerator for further studies as shown in Figure 4, respectively
A stock solution of 1 mg/ml was prepared by dissolving 10 mg of extract in 10 ml of methanol. Only one concentration of each extract was prepared and used for the test.
Gallic acid was used as the standard for this assay. Six different concentrations of standard solution were prepared in 10, 20, 40, 60, 80 and 100 𝜇g/ml. The concentration was prepared by serial dilution methods. A stock solution of 1 mg/ml was prepared by dissolving 100 mg of Gallic acid in 100 ml of methanol. Then, from the freshly prepared stock solution of Gallic acid, 1.0, 0.8, 0.6, 0.4, 0.2, 0.1 ml were pipette out into the volumetric flask and make up to 10 ml by methanol individually to produce 10, 20, 40, 60, 80 and 100 𝜇g/ml respectively. Table 6 shows the preparation of various Gallic acid standard concentrations for TPC by serial dilution.
The total phenolic content was performed according to experimental protocol given in standard references with slight modifications. A 2.5 % sodium carbonate solution was prepared by dissolving 2.5 g of sodium carbonate in 100 ml of distilled water. 1 ml of extract was added into a test tube by using a micropipette. The test tube containing extract was added with 1ml of Folin-Ciocalteu reagent and 2 ml of 2.5% sodium carbonate solution. Standard Gallic acid of different concentrations was prepared by using the same procedure by replacing extract with different concentration of standard gallic acid. Then followed by addition of 1 ml of Folin-Ciocalteu reagent and 2 ml of 2.5 % sodium carbonate solution. Similarly, control solution was prepared by replacing the extract with 1 ml of methanol and addition of 1 ml of Folin-Ciocalteu reagent and 2 ml of 2.5 % sodium carbonate solution. A blank solution was prepared only with 3 ml of methanol. All the test tube containing different concentrations of standard Gallic acid, extract, control as well as blank, were allowed for stand for two hours. Next, all the test tube containing different concentrations of standard gallic acid, extract, control and blank were subjected to UV visible analysis. Approximately 2 ml content of each test tube was transferred into the quartz cuvette and measured for the absorbance at 760 nm in UV-Visible spectrometer [4]. The absorbance values of each different concentration of standard Gallic acid, extract, control and blank were recorded. The total phenolic content was expressed in mg Gallic acid equivalents per g dry extract (mg GAE/g). All points were plotted to line graph where x-axis was concentration of Gallic acid and y-axis was absorbance. The following formula was applied to calculate the total concentration of phenolic content [5]:
Total phenolic content, 
Where,
𝐶 = total phenolic content mg GAE/g dry extract
𝑐 = concentration of Gallic acid obtained from calibration curve in mg/ml,
V = volume of extract in ml,
m = mass of extract in gram.
The Phyllanthus emblica extract was prepared according to the experimental protocol. Six different concentration of extract solution were prepared in 10, 20, 40, 60, 80 and 100 𝜇g/ml. A stock solution of 1 mg/ml was prepared by dissolving 100 mg of extract in 100ml of ethanol. The concentration was prepared by serial dilution method. Then, from the freshly prepared extract solution, 1.0, 0.8, 0.6, 0.4, 0.2, 0.1 ml were pipette out into the volumetric flask and make up to 10 ml by ethanol individually to produce 10, 20, 40, 60, 80 and 100𝜇g/ml respectively. Table 7: Preparation of various concentrations of extract for DPPH by serial dilution is shown in Table 7.
Table 6: Preparation of various Gallic acid standard concentrations for TPC by serial dilution.

Table 7: Preparation of various concentrations of extract for DPPH by serial dilution.

Ascorbic acid was used as the standard for this assay. Six different concentrations of standard solution were prepared in 10, 20, 40, 60, 80 and 100 𝜇g/ml. The concentration was prepared by serial dilution methods. A stock solution of 1 mg/ml was prepared by dissolving 100 mg of ascorbic acid in 100 ml of ethanol. Then, from the freshly prepared stock solution of ascorbic acid, 1.0, 0.8, 0.6, 0.4, 0.2, 0.1 ml were pipette out into the volumetric flask and make up to 10 ml by ethanol individually to produce 10, 20, 40, 60, 80 and 100 𝜇g/ml respectively. Table 8 represents preparation of various concentrations of ascorbic acid standard for DPPH by serial dilution.
Table 8: Preparation of various concentrations of ascorbic acid standard for DPPH by serial dilution.

The DPPH (1,1-Diphenyl2-picryl hydrazyl) Radical Scavenging Assay was performed according to experimental protocol given in standard references with slight modifications. 0.3mM of DPPH (1,1-Diphenyl2-picryl hydrazyl) reagent was prepared by dissolving 11.83 mg in 100 ml of ethanol. 2.5 ml of different concentration of extract was added into different test tube respectively. All the test tubes were then covered with aluminium foil as DPPH is light photosensitivity reagent. The aluminium foil covered test tube containing different concentration of extract were added with 1ml of 0.3 mM of alcoholic solution of DPPH reagent in each test tubes. Standard ascorbic acid of different concentrations was prepared by using the same procedure by replacing extract with different concentration of standard ascorbic acid. Then followed by addition of 1 ml of 0.3 mM of alcoholic solution of DPPH. Similarly, control solution was prepared by replacing the extract with ethanol and addition of 1 ml of 0.3 mM of alcoholic solution of DPPH. A blank solution was prepared only with 3 ml of 95 % ethanol. All the test tube containing different concentrations of standard ascorbic acid, extract, control as well as blank were allowed for stand for 30 minutes in dark cupboard. Next, all the test tube containing different concentrations of standard ascorbic acid, extract, control and blank were subjected to UV visible analysis in a dark condition. Approximately 2 ml content of each test tube was transferred into the quartz cuvette and measured for the absorbance at 518 nm in UV-Visible spectrometer. The absorbance values of each different concentrations of standard ascorbic acid, extract, control and blank were recorded. The percentage of DPPH scavenging activity (SA) is calculated using the following equation:

where % SA = percentage scavenging activity,
A0 = absorbance of control,
A1 = absorbance of sample.
Then, curves are constructed by plotting percentage of inhibition against concentration in μg/mL. The equation of this curve allowed to calculate the IC50 corresponding to the sample concentration that reduced the initial DPPH absorbance of 50% [6].
The IR Measurement Was Carried Out Using a Spectrum GX FTIR Spectroscopy Instrument. The crystal area was cleaned with isopropyl alcohol and the infrared background was collected. A small quantity of methanolic extract was obtained with a spatula and placed onto the small crystal area. The whole crystal must be covered with the sample to get an ideal result. Once the solid had been placed on the crystal area, the pressure arm should be positioned over the crystal/sample area. PerkinElmer’s revolutionary Spectrum™ FT-IR software utilizes a “Preview Mode” which allows the quality of the spectrum to be monitored in real-time while fine turning the exerted force. Once the user was satisfied with the spectrum shown in this “Preview Mode”, the data was then collected in the normal manner. After the spectrum had been collected, which typically take no more than 32 seconds, the user must return to the “Preview Mode”. This mode was now used to check that the crystal area was clean before placing the next sample on the crystal [7]. The whole procedure was repeated for ethanolic and n-hexane extracts. The spectrum obtained was recorded and documented.
The IR Measurement Was Carried Out Using a Spectrum GX FTIR Spectroscopy Instrument. The crystal area was cleaned with isopropyl alcohol and the infrared background was collected. A small quantity of methanolic extract was obtained with a spatula and placed onto the small crystal area. The whole crystal must be covered with the sample to get an ideal result. Once the solid had been placed on the crystal area, the pressure arm should be positioned over the crystal/sample area. PerkinElmer’s revolutionary Spectrum™ FT-IR software utilizes a “Preview Mode” which allows the quality of the spectrum to be monitored in real-time while fine turning the exerted force. Once the user was satisfied with the spectrum shown in this “Preview Mode”, the data was then collected in the normal manner. After the spectrum had been collected, which typically take no more than 32 seconds, the user must return to the “Preview Mode”. This mode was now used to check that the crystal area was clean before placing the next sample on the crystal [7]. The whole procedure was repeated for ethanolic and n-hexane extracts. The spectrum obtained was recorded and documented.
The method used to determine the total phenolic content was Folin-Ciocalteu assay in order to assess the presence and level of phenolic compounds in each sample. Phenolic compounds have been proved to be responsible for the antioxidant activity of emblica fruit. A spectrophotometer in range of 690 to 760 nm is capable to detect the reduced Folin-Ciocalteu reagent. Generally, higher absorbance produced usually shows higher total phenolic content. The total phenolic assay was conducted according to the procedures described and the results obtained are showed in (Tables 9-10). The Gallic acid is used as the reference standard compound and the results are expressed as Gallic acid equivalents (mg/ml). The standard calibration curve for Gallic acid is given in Graph 1. Phenolic compounds are important plant constituents with redox properties responsible for antioxidant activity and also highly distributed in various plant species. These compounds are
Graph 1: Calibration curve for Gallic acid (standard).

Table 9: Total phenolic absorbance value for Gallic acid.

Table 10: Total phenolic absorbance value for different extracts.

secondary plant metabolites comprising one (phenolic acid) or more (polyphenols) aromatic rings with attached hydroxyl groups in their structures. Their antioxidant capacities are related to these hydroxyl groups and phenolic rings [8]. It has been reported that phenolic compounds act as antioxidants to exert antiallergic, anti- inflammatory, antidiabetic, antimicrobial, antipathogenic, antiviral and vasodilatory actions as well as prevent diseases such as heart problems, eye disorders, cataracts, cancer and Alzheimer’s [9]. The total phenolic content of various extracts was assessed using Folin-Ciocalteu (F-C) method using Gallic acid as the standard. A calibration curve was constructed by using the absorbance values obtained at various concentration of Gallic acid. The F-C method showed a greenish blue colour complex which resulted from the transfer of electrons in alkaline medium from phenolic compounds to phosphomolybedic phosphotungstic acid complexes, that are determined spectrophotometrically at 760 nm [10]. Total phenolic content of the extracts was calculated from the regression equation of calibration curve (𝑦 = 0.0154𝑥 - 0.0508; R2 = 0.997) as shown in Graph 1, which was then reported as mg of gallic acid equivalents (GE) per gram of sample in dry weight (mg/g). The results are presented in (Tables 9-10). It was found that the phenolics of P. emblica were higher in a polar solvent such as methanol and ethanol, implying that most polyphenols in these fruits are polar compounds. The methanolic extract exhibited higher TPC as compared to the ethanolic and n-hexane extracts which are approximately about 99.01 mg GAE/g for methanolic extract, 83.17 mg GAE/g for ethanolic extract and 56.29 mg GAE/g for n-hexane extract. Higher phenolic content in the methanolic extract is responsible for bioactivity; therefore, this extract is expected to exhibit good result in antioxidant activities. In addition, there was evidence that P. emblica extracts had a lot of phytochemicals such as tannins, Gallic acid and ascorbic acid, which contributed to their antioxidant properties [11]. Comparing the extraction methods, methanol is found to be the best solvent for the extraction of phenolics.
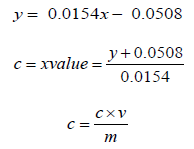
Where, 𝑐 = concentration of gallic acid (mg/ml)
V = extract volume used (ml)
m = extract weight (g).
The antioxidant activity of the fruits of Phyllanthus emblica methanolic, ethanolic and n- hexane extract were assessed by DPPH scavenging method. The DPPH antioxidant assay was conducted according to the procedure described. Ascorbic acid was served as a reference standard for this experiment. The results obtained are given in the (Tables 11-14). The different calibration curves for DPPH assay from different solvents (Ascorbic acid, Methanolic extract, Ethanolic extract and n-hexane extract) are shown in (Graphs 2-5), respectively. Graph 6 and represents the percent inhibition of DPPH radical of different extracts of the plant and standard at different concentrations. (Table 15-16) shows the IC50 values of the plant extracts.
Graph 2: Calibration curve of ascorbic acid (standard).

Graph 3: Calibration curve of Phyllanthus emblica methanolic extract.

Graph 4: Calibration curve of Phyllanthus emblica ethanolic extract.

Graph 5: Calibration curve of Phyllanthus emblica n-hexane extract.

Graph 6: Calibration curve for Gallic acid (standard).


Table 12: Absorbance values and DPPH scavenging activity of various concentration of ascorbic acid (standard).

Table 13: Absorbance values and DPPH scavenging activity of various concentration of Phyllanthus emblica methanol extract.

Table 14: Absorbance values and DPPH scavenging activity of various concentration of Phyllanthus emblica ethanol extract.

Table 15: Absorbance values and DPPH scavenging activity of various concentration of Phyllanthus emblica n-hexane extract.

Table 16: IC50 values of Phyllanthus emblica extracts.

It is generally recognised that the free radicals produced in the body has a role in the development of cancer and other chronic diseases. Dietary antioxidants that are capable of scavenging free radicals can lower the risk of developing the disease. Therefore, it is crucial to determine the radical scavenging effect of antioxidants in the P. emblica fruits [12]. The DPPH assay aims to employ 2,2 diphenyl- 1-1picrylhydrazyl (DPPH; C18H12N5O6) to determine the antioxidant activity of compounds. DPPH is a stable free radical which has an unpaired valence electron at one atom of nitrogen rendering it strong absorption at 518 nm [8]. This assay is based on the capability of an antioxidant to donate a hydrogen radical or an electron to DPPH radical, which is a stable nitrogen-centered free radical with deep violet colour. When an odd electron becomes paired off in the presence of antioxidant agent or free radical scavenger, DPPH radicals get reduced to corresponding hydrazine, DPPH-H form and the solution get decolorized form its initial deep violet (picrylhydrazyl) to light yellow colour (picrylhydrazine), in a concentration-dependent manner as shown in Figure 5. The degree of fall in the absorbance is measured spectrophotometrically and is proportional to the concentration of the antioxidant [10].
Graph 7: Reaction Mechanism of DPPH with antioxidant (30).

Extracting antioxidants from plant material most often involves the method of solvent extraction. The choice of solvent has been shown to have a significant influence on the concentration of antioxidants extracted. From the results obtained from the tables above, it was clearly showed that the increases in the concentration P. emblica extract will results in decreases in the absorbance value and thus the percentage of scavenging activity increases. The same goes to the ascorbic acid standard. All of these P. emblica extracts showed appreciable free radical scavenging activities as compared with the standard ascorbic acid. The result in Graph 6 revealed that the scavenging effect and the concentration increased simultaneously. Percent free radical scavenging activity of P. emblica ranged from 47.65% to 96.49%, with maximum values in methanol extract. Among these samples tested in this study, the methanol extract showed the strongest radical scavenging activity (96.49%), followed by ethanol extract (88.21%) while the n-hexane extract exhibited the lowest radical scavenging activity (84.04%).

For methanol for methanol for n-hexane,
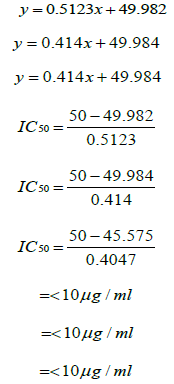
The abilities of the studied extracts to scavenge DPPH were assessed based on their IC50. The IC50 of an antioxidant is defined as the amount of the antioxidant needed to decreased the radical concentration by 50%. [13]. IC50 value of DPPH scavenging activities was contradistinction with percentage of DPPH scavenging activities. It means that the highest antioxidant activity was indicated by the lowest value of IC50 [14]. IC50 value of each extract was shown in Table 15. The lowest IC50 was detected in the methanolic extract followed by ethanol extract and n-hexane extract with IC50 value of <10 𝜇g/ml, <10 𝜇g/ml and 10.93 𝜇 g/ml, respectively. As the lowest IC50 value possesses higher antioxidant activity, the methanol extract has a higher ability to scavenge free radical compared to ethanol and n- hexane extracts. High antioxidant activity showed by the methanolic extract has a positive relationship with TPC activity, where high TPC gives a high antioxidant capacity due to the linear correlation between the two parameters. Phenolics are big groups of secondary plant metabolites which include anthocyanin, vanillin, flavonol, caffeic acid, ferulic acid and Gallic acid. Phenolics had a wide range of useful qualities, primarily due to their antioxidant capacity. Hence, according to the results of total phenolic content and scavenging activity, methanol extract was found to have the highest potential to use as antioxidant substances [11].
The FTIR Spectrometry is one of the methods to characterize the functional groups present in the extracts. The FTIR spectra was recorded at room temperature using potassium bromide (KBr) pellet technique in the wavenumber range 4000-450 cm-1 (mid IR range). The characterization of the plant extracts was evaluated according to the procedures described. The results so obtained are given in (Figures 6-8). (methanolic, ethanolic and n-hexane extracts), respectively.
Figure 6: FTIR spectra of methanol extract.
Figure 7: FTIR spectra of ethanol extract.

Figure 8: FTIR spectra of n-hexane extract.

Fourier transform infrared spectroscopy (FTIR) is a rapid, economical and non-destructive technique available to scientist all over the globe. FTIR was originally utilised as a spectroscopic technique for the identification of functional groups of various chemical constituents, but in recent years it has been widely used and applied for the identification, quality control and manufacturing process supervision of pharmaceutical drugs [15]. FTIR technique is based on the identification of functional groups in molecules where such groups vibrate either through stretching or bending in different ways when exposed to particular light wavelengths. These vibrations and their intensity (% transmission) are plotted against the frequency of light (cm-1) to which the sample is exposed to produce an FTIR spectrum [16]. The position and intensity of a vibrational band reflect the underlying molecular motion and the conformation of the atoms involved in the chemical bond. Thus, bands in a characteristic spectral region are produced by a specific sub-molecular group. These characteristic bands serve as the empirical basis for interpreting the vibrational spectra. Furthermore, characteristic absorption bands can be used for compound-specific detection [17].
FTIR analysis was conducted between the range 4000-450 cm-1 for the identification of functional groups present in the extract. In Figure 15, the FTIR spectrum of methanol extract showed the first band stretching at 3269.66 cm-1. This broad band located between 2500 and 3300 cm-1 is the characteristic of the -OH group in carboxylic acid [18]. This feature is considerably broader than most of the other features in infrared spectra due to strong hydrogen bonding. Besides, the sharp absorption peak at 1717.26 cm-1 (1685-1715 cm- 1) was assigned to C=O stretching vibration in carbonyl compounds [19-35]. The presence of a narrow and sharp peak at 1038.11 cm-1 may indicates the presence of C-O group in the extract. Moreover, an observed broader band at 3188.77 cm-1 is the characteristic of -OH group in carboxylic acid indicated the presence of hydroxy compounds in P. emblica ethanol extract as shown in Figure 7. A sharp peak was also noticed at 1650.99 cm-1 due to the presence of carbonyl (C=O) group. In addition, the FTIR spectrum of n-hexane extract shown in Figure 17 displayed a characteristic peak at 3206.75 cm-1 which was associated to the -OH group in carboxylic acid whereas the peak at 2973.75 cm-1 could be possibly attributed to the -CH stretching vibrations of various groups such as methyl, methylene or methoxy groups. A sharp peak was also observed at 1717.54 cm-1, which was assigned to the C=O stretching in carbonyl group. Lastly, the presence of a characteristic peak at 1039.11 cm-1 may indicates the presence of C-O group in the P. emblica n-hexane fruit extract.
P. emblica is one of the most popular Ayurvedic medicinal plants due to its diverse pharmacological properties to treat several human ailments. However, its most extraordinary features are its antioxidative and anti-inflammatory properties. Scientific research on the pharmacological effects of P. emblica suggests the clinical significance of this plant species. It is one of the richest sources of vitamin C found in the nature and is essential in avoiding a wide range of illnesses. It is regarded as a safe herbal medicine without any adverse effects. Thus, it can be concluded that Indian gooseberry is a traditionally and clinically proven fruit for its efficacy and application. Today, research on Indian traditional medicine plants has gained a new recommence. Although the other medicine systems are efficient, they come with a number of undesired side effects that frequently result in life-threatening complications. Being natural, herbal medicine alleviates all of these problems.
The present study reports the extraction of P. emblica fruits using three different solvent such as methanol, ethanol and n-hexane. Among the solvent tested, methanol was found as the best extracting solvent for extraction of phenolic compounds and antioxidants for P. emblica fruit. This is due to methanol extract of P. emblica fruits showed a very high phenolic content and scavenging activity compared to ethanol and n-hexane extract. All the extracts have a high DPPH scavenging activity but the antioxidative activity of methanol extract (96.49 𝜇g/ml) was very close to the standard ascorbic acid (96.84 𝜇g/ml). The antioxidant activity of P. emblica fruits showed a clear correlation with the phenolic content proving that the activity is due to the presence of bioactive compounds. Polar solvents especially methanol and ethanol showed higher efficiency in extracting the phenolic compounds of P. emblica, resulting in higher antioxidative activity. The results imply that the methanolic extract of fruits of P. emblica are potentials sources of natural antioxidants, which have free radical scavenging activity and might be useful for hepato- and radio- protection, as well as reducing oxidative stress in many pathological conditions. Consumer demand for health promoting products provides an opportunity to develop antioxidant rich functional foods, as well as pharmaceutical grade or nutraceutical products. The antioxidant rich Indian gooseberry can be investigated for the above said properties which would be a great benefit and advantage to the health food industry.
The authors are highly thankful to the Faculty of Pharmacy, AIMST University, Bedong, Kedah D.A., Malaysia for funding and providing facilities to carry out this research project.
Thanks to science officers Miss Amalina and Miss Jaya.
Authors declare that there is no conflict of interests.


