info@biomedres.us
+1 (502) 904-2126
One Westbrook Corporate Center, Suite 300, Westchester, IL 60154, USA
Site Map

Received: October 18, 2022; Published: October 27, 2022
*Corresponding author: Husham Sharifi, MD, MS, Department of Medicine, Division of Pulmonary, Allergy, and Critical Care Medicine, Stanford University School of Medicine, Stanford, CA 94305, USA
DOI: 10.26717/BJSTR.2022.46.007413
We present a deterministic, calibrated Susceptible-Exposed-Infected-Recovered- Dead + Vaccinated (SEIRD+V) model that simulates the spread and containment of COVID-19. We use the model to compare the effectiveness of vaccination vs. social distancing on death prevention and total and peak infection reduction. We find that vaccination drastically reduces total deaths from COVID-19, as well as total and peak infections with Severe Acute Respiratory Syndrome Coronavirus 2 (SARS-CoV-2). We find that social distancing plays a role in reducing total COVID-19 deaths, but its impact is less pronounced when vaccine efficacy and vaccination fraction are both high. Social distancing also plays a role in reducing total and peak infections, which is attenuated in the presence of vaccination. We employed a thresholding methodology to assess the requirements of vaccine efficacy and the vaccination fraction to limit total COVID-19 deaths and peak infections to a 5% threshold. Our thresholding results quantify the impact of social distancing on total COVID-19 deaths and peak infections and are significant in their ability to inform public health policy for future outbreaks, as well as for SARS-CoV-2 itself as it continues to mutate and alter its transmissibility.
Keywords: COVID-19; SEID; Mathematical Modeling; Thresholding; Peak Infection; Mortality; Vaccination; Social Distancing
SARS-CoV-2 was first discovered and identified in Wuhan, China, in December 2019 and shortly thereafter spread around the globe. As of this writing, there have been 580 million documented cases of infection and 6.41 million recorded deaths [1]. We continue to experience in certain countries quarantine and isolation protocols, mandatory work furloughs for infected individuals, and modified arrangements for distancing in educational environments such as secondary schools. National governments also have devised containment policies, and the Centers for Disease Control (CDC) in the United States (US) has explicit policies for quarantine and isolation [2]. These measures and their efficacy hold relevance for our ongoing efforts to combat transmission during times of lower prevalence, during any significant recrudescence of the virus, and during future respiratory pandemics from alternative viruses. In parallel scientific communities around the globe have developed vaccines to combat COVID-19 at unprecedented speed and with broad, rapid distribution. Together, these policies and medical interventions provide a composite public health approach to mitigating the health impact of Severe Acute Respiratory Syndrome Coronavirus 2 (SARS-CoV-2) on individuals and communities.
As health experts and government authorities formulate regulatory policies, mathematical models have proven helpful for investigating the spread of the virus through theoretical frameworks that showcase the effectiveness of various intervention strategies and the impact of vaccination on protecting populations from viruses [3,4]. They can provide public health officials and the general public with insights and predictions pertaining to the spread of pathogens and the effectiveness of containment measures and vaccination that recorded data alone cannot [5,6]. The role of mathematical modelling in improving public health responses to infectious pandemics has been supported by the CDC Infectious Disease Modelling and Analytics Initiative [7].
This is an especially significant concern in that climate change and loss of biodiversity is anticipated to increase the frequency of new pandemics [8,9], with pandemic risk projected to increase by three-fold in the next few decades [10]. Given heightened risk and increased frequency of new pandemics, preparedness through modelling can be a key component for public health response systems. Mathematical modelling can help preparedness by advancing technical knowledge and techniques during existing pandemics that can be applied forward as new pandemics emerge.
Of pandemic mathematical models, the Susceptible-Exposed-Infected- Recovered (SEIR) model has been widely used to model disease transmission dynamics in epidemics (e.g., tuberculosis and varicella) [11,12], and other mathematical models have been used in a number of studies for COVID-19 [13-16]. In one study Carcione and colleagues applied SEIR to simulate the COVID-19 epidemic in the Lombardy Region of Italy [17]. By use of the same data in the Carcione study, we developed an enhanced SEIR model with modifications to improve performance by inclusion of the following:
1. Effect of vaccinations on total deaths and peak infections from
COVID-19.
2. Vaccine efficacy.
3. Interactions between vaccine efficacy and vaccine rate; and
4. A thresholding methodology to assess minimum requirements
that are needed to satisfy pre-set goals (e.g., 5% rate of peak
infection). These enhancements have been demonstrated to be
important in prior models but have not be applied in an integrated
analytic model, nor have they been used for a model
to assess a combination of vaccination and social distancing
[18,19]. The paper is organized as follows. First, the SEIRD+V
(Susceptible-Exposed-Infected-Recovered-Dead+Vaccinated)
model is introduced, and its key aspects are discussed. Then
the model is applied to the Lombardy dataset, with validity assessed
by comparison to the Carcione study. Finally, the effects
of social distancing and vaccination are, respectively, varied
and incorporated into the model to assess the impact of social
distancing and vaccination on the containment of COVID-19.
Thresholding is applied to assess the requirements of vaccine
efficacy and vaccination fraction to reach preset COVID-19
death and peak infection goals.
The Basic SEIRD Model
We first build a SEIRD (Susceptible, Exposed, Infected, Recovered, Dead) model, officially adding a heretofore implicit Dead compartment. See (Figure 1).
Figure 1.

The model divides the total population N0 into five compartments at any given time: Susceptible (S), Exposed (E), Infectious (I), Recovered (R), and Dead (D).
- Susceptible (S): Individuals of the population who are not infected
but can become infected. A susceptible individual becomes
exposed when they come into contact with an infectious
individual.
- Exposed (E): Individuals of the population who have come into
contact with an infectious individual. Exposed individuals may
become infected and carry the virus, but do not shed virus in
sufficient density to infect other individuals. Not all exposed
individuals become infected. Exposed individuals who are
infected do not show symptoms, and the disease is latent in
these individuals at this stage.
- Infectious (I): Individuals who have been infected by the virus
and can transmit it to susceptible individuals. An infectious individual
remains infectious for a period of time and is removed
from the infectious population when they recover from disease
or die. Note that naming of this compartment is not consistent
in the literature. It is named “Infected” in some papers (e.g.,
16,17) and “Infectious” in others [13,20]. When referring to individuals
in this compartment, this paper uses “infected” and
“infectious” interchangeably.
- Recovered (R): Individuals who have recovered from the disease
and are assumed to be immune.
- Dead (D): Individuals who have died (i.e., all-cause mortality).
- The model assumes that the time scale of the model is short
enough such that births and natural deaths (deaths not caused
by COVID-19) are negligible and that the number of deaths
from COVID-19 is small compared to the living population.
The ordinary differential equations that govern the transitions of the population from one compartment to the next are as follows:
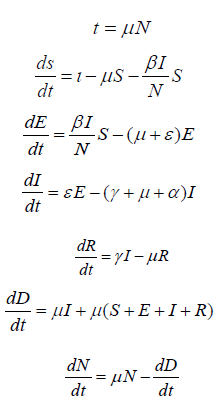
Where N=S+ E+ I+ R≤ N0 Equations are subject to the initial conditions
S(0), E(0), I(0), R(0), and N(0).
The parameters are defined as:
Ι: Birth rate
μ: Per-capita natural death rate.
α: Virus-induced average fatality rate.
β: Probability of disease transmission per contact (dimensionless)
times the number of contacts per unit time.
ϵ: Rate of progression from exposed to infectious (the reciprocal
is the latent period).
γ: Recovery rate of infectious individuals (the reciprocal is the
infectious period).
In the model, the choice ι = μ = 0 andε = ∞ gives the classical
SIR model, while if and μ are not zero, the model is termed an
endemic SIR model [3]. However, the SIR model has no latent stage
(no exposed individuals), so it is, therefore, inappropriate as a model
for diseases with an ε such as that of COVID-19.
The SEIRD Model + Vaccination
This model extends our basic SEIRD model described in 2.1,
by further dividing each compartment in the basic model based on
vaccination status (except the Dead compartment). This model divides
the total population N0 into nine compartments at any given
time: Susceptible unvaccinated (S), Exposed unvaccinated (E), Infectious
unvaccinated (I), Recovered unvaccinated (R), Susceptible
vaccinated (SV), Exposed vaccinated (EV), Infectious vaccinated (IV),
Recovered vaccinated (RV), and Dead (D).
- Susceptible unvaccinated (S): Unvaccinated individuals of
the population who are not infected but can become infected, when
coming into contact with an infectious individual (unvaccinated or
vaccinated).
- Exposed unvaccinated (E): Unvaccinated individuals of
the population who have come into contact with an infectious individual
(unvaccinated or vaccinated).
- Infectious unvaccinated (I): Unvaccinated individuals
who have been infected by the virus. Those individuals transmit the
virus to unvaccinated and vaccinated susceptible individuals.
- Recovered unvaccinated (R): Unvaccinated individuals
who have recovered from the disease. Recovered individuals are
susceptible to be reinfected, albeit at lower probabilities.
- Susceptible vaccinated (SV): Vaccinated individuals of the
population who are not infected but can become infected. Even
though susceptible, the probabilities of vaccinated individuals being
infected is much lower than unvaccinated individuals [21,22].
- Exposed vaccinated (EV): Vaccinated individuals of the
population who have come into contact with an infectious individual
(unvaccinated or vaccinated). Exposed vaccinated individuals are less likely to develop symptoms and are less infectious than exposed
unvaccinated individuals.
- Infectious vaccinated (IV): Vaccinated individuals who
have been infected. Vaccinated individuals are less infectious, less
likely to develop severe symptoms or die than unvaccinated infectious
individuals.
- Recovered vaccinated (RV): Vaccinated individuals who
have been infected by the virus and recovered from the disease.
- Dead (D): Individuals who have died (from both the disease
and natural causes).
This model is illustrated in (Figure 2). It similarly assumes that
the time scale of the model is short enough so that births and natural
deaths (deaths not caused by COVID-19) are negligible and that
the number of deaths from COVID-19 is small compared to the living
population.
Figure 2.

The ordinary differential equations that govern the transitions of the population from one compartment to the next are as follows:
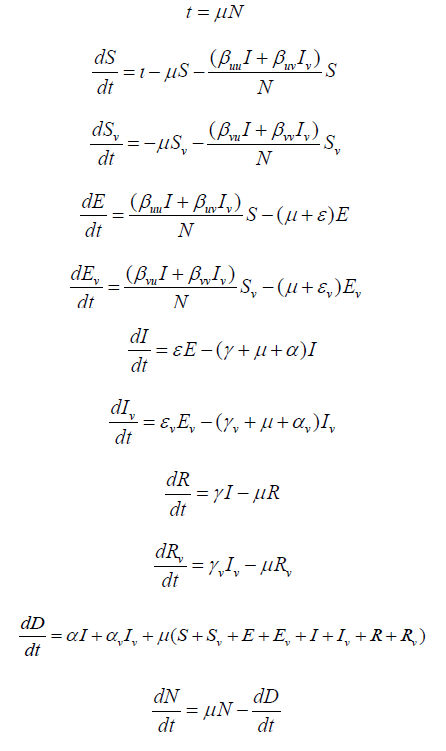
where N = S+E +I+R+SV+EV+IV+RV ≤ N0. Equations are subject to
the initial conditions S(0), E(0), I(0), R(0), SV(0), EV(0), IV(0), RV(0),
and N(0).
The parameters for the extended model are defined as:
ι: Birth rate.
μ: Per-capita natural death rate.
α: Virus-induced average fatality rate among unvaccinated individuals.
αv: Virus-induced average fatality rate among vaccinated individuals.
βuu: Probability of disease transmission per unvaccinated contact
(dimensionless) times the number of unvaccinated contacts
per unit time.
βij: Probability of disease transmission per i contact (dimensionless)
times the number of j contacts per unit time.
βvu: Probability of disease transmission per vaccinated contact
(dimensionless) times the number of unvaccinated contacts
per unit time.
βvv: Probability of disease transmission per vaccinated contact
(dimensionless) times the number of vaccinated contacts per
unit time.
ϵ: Rate of progression from exposed, unvaccinated to infectious,
unvaccinated (the reciprocal is the incubation period).
ϵv: Rate of progression from exposed, vaccinated to infectious,
vaccinated (the reciprocal is the incubation period).
γ: Recovery rate of infectious, unvaccinated individuals (the reciprocal
is the infectious period).
γv: Recovery rate of infectious, vaccinated individuals (the reciprocal
is the infectious period).
We use the following parameters and initial conditions:
κ: Fraction of vaccinated population
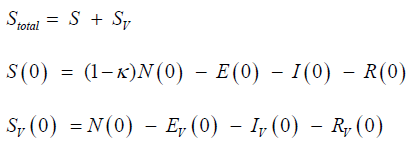
ξ: Vaccine efficacy
ξuv: Vaccine efficacy in preventing an unvaccinated individual
from infecting a vaccinated individual
ξvu: Vaccine efficacy in preventing a vaccinated individual from
infecting an unvaccinated individual
βuv = (1 - ξuv)βuu
βvu = (1 - ξvu)βuu
We assume that any possible ξuv ≈ ξvu, so that ξuv= ξvu= ξ. Similarly,
βvv is set to βuv × βvu.
Thresholding
The thresholding process takes a threshold input and calculates all parameter combinations where the specified threshold condition is met. We illustrate the threshold with a graph in which all coordinates corresponding to the parameter pairs where the threshold is crossed are identified by color, leaving blank all coordinates that do not cross the threshold. For example, COVID death toll is dependent on vaccination rate κ and vaccine efficacy ξ. Model thresholding would take the death toll >5% of some arbitrary value as a threshold input and then collect all the (κ, ξ) combinations under which the COVID death toll is greater than that 5%, coloring in their coordinates as the model computes. Spaces in the chart that are clear represent spaces where the COVID death toll is less than that 5%.
Datasets
Data for our model come from those used in the study by Carcione and colleagues, who processed and labeled model constraints and initial-final values from the initial months of epidemic data in Lombardy, Italy [23]. The dataset covers 02/24/2020 to 05/05/2020 and includes the number of patients for the following variables on a per-day basis: hospitalized patients; intensive care patients; quarantined individuals; total individuals with positive tests; new positive tests; patients who were discharged from admission or recovered from infection; number of deaths; and number of tests administered [24]. This dataset will be referred to as the Lombardy dataset.
Validation of our Models
We first tested our basic SEIRD model and our enhanced SEIRD+V model against the Lombardy dataset, using degenerate cases that simplify to Carcione’s model. We also replicated Carcione’s model with original code. We then applied all three models to the Lombardy dataset, with results shown in (Figure 3). We used the same parameters from Carcione for all three models, only adding the vaccinated compartments to the first two models and splitting the susceptible population from Carcione between the unvaccinated and vaccinated susceptible compartments.
Figure 3.

A comparison of these three sets of charts reveals that they are identical. Peak infections, peak deaths per day, maximum total deaths, and the shapes of their respective curves are all the same. The other curves (i.e., susceptible, exposed, recovered) are similarly identical between the charts.
Effects of Vaccination on SEIRD+V Dynamics
We next simulate the effect of vaccination on COVID infections, COVID deaths, and the dynamics of other compartments of the model, as shown in Figure 4.
Figure 4.

In the examples above, we apply the model to a population with the following initial conditions and model parameters: (Table 1) Comparison of (Figures 4A & 4B) reveals that vaccination significantly impact the dynamics of COVID-19. With 50% vaccine uptake rate of 50% efficacy vaccines, the number of susceptible people at the beginning of an epidemic is reduced by ~55%. Interestingly, in later stages, the number of susceptible people are about even with or without vaccination. Note that in (Figure 4B), in later stages, the total number of susceptible individuals are twice that in (Figure 4A). This is because vaccinated people are mostly immune (i.e., not infected), and thus they remain susceptible. Most significant is the impact of vaccination on peak exposed and peak infected. Without vaccination, the number of peak exposed and that of peak infected are around 1.038 million and 0.563 million, respectively. Vaccination drastically flattens both peaks. With vaccination, peak exposed and is 0.202 million (-80.5%) and peak infected 0.113 million (-79.8%). Vaccination also has a large impact on peak death rate and on total deaths. With vaccination, peak death rate and total deaths are reduced by 79.8% (from 799 to 161 deaths per day) and 73.5% (from 30,471 to 8080 deaths), respectively.
Table 1. Initial conditions and model parameters.

Effects of Social Distancing
Drawing from the Carcione model, we add a social distancing component by adding the parameter βext, which is a list of time-dependent values for βuu that work as follows: When time t <= 22 days: βuu = βext[0] Afterwards, when time t <= 35 days: βuu = βext[1] After time t exceeds 35 days, βuu = βext[2]
Model applications to Lombardy Dataset: Total Deceased
With social distancing in place, we next vary social distancing (yes/no), vaccination fraction κ, and vaccine efficacy ξ to see their effects on the total number of deceased individuals. The value of “Total deceased” is the final value of D(t) stored by the program after running the SEIRD+V simulation. Applying this to the Lombardy dataset produces results on the impact of vaccine efficacy and vaccination rate on total deceased with or without social distancing.
Figure 5.

Figure 5(A) shows the total COVID deaths for different vaccination fractions of the population, with various values of vaccinated transmission probabilities, when there is no social distancing. For all vaccinated transmission probability values, the COVID death toll decreases as the vaccination fraction increases. There are no exceptions.
We model vaccine efficacy by vaccinated transmission probability. The left chart of (Figure 5) also shows that total COVID deaths decline more sharply with the vaccination fractions as vaccinated transmission probability decreases. This result suggests that with increasing vaccine efficacy, the COVID death toll decreases for all vaccination fractions. This result is also represented in a color coding scheme in (Figure 5B). The color gradient on the right depicts the number of total COVID deaths, with darker blue shades representing fewer deaths and darker yellow shades representing more deaths, for varying combinations of κ and ξ. As vaccine efficacy moves from left to right, and the vaccination fraction from bottom to top, the shade of the color moves from yellow to green to dark blue, i.e., decreasing COVID deaths.
Figure 6.

(Figure 6) shows the same simulation as (Figure 5), with social distancing added. It is clear that, with social distancing, the impact of vaccinated transmission probability on total COVID deaths is less pronounced than when there is no social distancing. Comparing (Figure 6A) to (Figure 5A), all the curves in (Figure 6A), left panel shift lower (i.e., decreased COVID death toll). However, the differences between the curves for the various β_uv/β_vu values have narrowed. (Figure 6), right panel, shows that the color spectrum has drastically shifted to the lower left corner, when compared with (Figure 5), left panel. As the above figures demonstrate, the death toll at κ = 0 is, for all ξ values (even ξ = 0), significantly larger than the death toll at κ = 1. The color-bars on the right depict the changing death toll in varying intensities of color as both κ and ξ are varied.
Figure 7.

(Figure 7) is the overlaid product of two thresholding simulations for total COVID deaths, one with social distancing (blue) and the other without social distancing (light blue). The threshold is set to less than 5% of the greatest observed COVID death toll in the simulation, 41,000. The first shades all (κ, ξ) combinations for which the death toll meets that thresholding condition (total COVID death > 5%) in the ‘distancing’ simulation, and the second shades the same combinations meeting the same thresholding condition in the ‘no distancing’ simulation. Simulation results indicate that with social distancing, vaccine efficacy must reach at least 39% and the vaccination fraction must reach at least 54% to attain the goal of <5% COVID death. Without social distancing, 5% COVID death threshold requires a little higher vaccine efficacy (56%) and vaccination fraction (97%). From the chart, it can be seen that the light blue (no social distancing) extends a little more to the upper right compared to the dark blue (social distancing).
This type of overlaid thresholding according to prespecified percentage has applications pertaining to targeted reduction, as target percentages can be inputted into the simulation and used to compare vaccination thresholds for ‘distancing’ and ‘non-distancing’ populations. In this case, social distancing populations require less vaccinations and lesser vaccine efficacies to reach the same threshold of 5% of the target (41,000) compared to non-distancing populations.
Model applications to Lombardy data set: Peak infected
Next, we vary social distancing, κ, and ξ to see their effects on peak infections. The value of “Peak infected” is essentially just the maximum value of I(t) stored by the program after running the SEIRD+V simulation. Analogous to (Figures 5,6,8,9) present the simulation results for the impact of vaccinated transmission probability (βvu) and the vaccination fraction (κ) but do so in this case on peak infections. Figure 8 presents the results when there is no social distancing; whereas, (Figure 9) presents the results when there is social distancing.
Figure 8.

In Figure 8(A), peak infected decreases with vaccination fraction for all vaccinated transmission probability values. The decreases in peak infected for lower vaccinated transmission probabilities are sharper than those for higher vaccinated transmission probabilities. As vaccinated transmission probability reflects vaccine efficacy, these results suggest that increasing both the vaccine efficacy and the vaccination fraction helps to decrease peak infections. This conclusion is shown in the color coding scheme in (Figure 8B). As we move from the lower left corner (low vaccine efficacy and a low vaccination fraction) to the upper right corner, peak COVID infections decrease.
Figure 9.

(Figure 9) represents results of the same model but with the addition of social distancing. Comparing Figure 9(A) to Figure 8(A), it is clear that social distancing slightly shifts the curves for the various vaccinated transmission probabilities down, i.e., social distancing slightly decreases peak infections. (Figures 8 & 9) demonstrate that peak infections at κ = 0 are, for all ξ values (again, including ξ = 0), significantly larger than the peak infections at κ = 1. The color- bars on the right depict the changing peak infections in varying intensities of color as both κ and ξ are varied.
Figure 10.

Figure 10 is, like Figure 7, the overlaid product of two thresholding simulations, but for peak infected. The first (dark blue) shades all (κ, ξ) combinations for which the peak infections meet the thresholding condition (peak infections > 5%) in the ‘distancing’ simulation (estimated at 850,000 infected), and the second (light blue) shades the same combinations meeting the same thresholding condition in the ‘no distancing’ simulation. Like the thresholding simulations for total COVID deaths, this overlaid thresholding could be used to observe and compare target reductions. In this case, it seems that the difference between the two thresholds is minute, occurring only when a vaccine is around 95-97.5% effective and 52.5-55% of the population has been vaccinated.
In this study we created a new model to assess the impact of vaccination prevalence, vaccine efficacy, and social distancing on infection rate and mortality from COVID-19. In several countries, including those with developed economies, resources and decision making infrastructure of healthcare systems have proved inadequate during the COVID-19 pandemic, resulting in human suffering and death that could have been mitigated with more informed preparation [25,26]. Numerous respiratory pandemics have occurred over the last several decades and have offered opportunities for the scientific and healthcare community to develop effective methods for resource deployment [27,28]. Our model presents a tool to inform resource allocation and create anticipatory guidance for public health systems. The SEIRD+V model we present here advances knowledge in its contribution of new, relevant parameters as inputs: vaccination effectiveness, vaccination fraction, and social distancing stages. These modifications can make the model suitable for different phases of a viral outbreak when the risk-benefit tradeoff to calibrate social distancing and other containment policies is shifted. Such insight from a model can help avoid unnecessary social and economic costs. Indeed, during the extended timeline of an epidemic, authorities often need to adapt goals dynamically for public safety in ways that carry a cost to commercial business, education of the young, and general mobility. For example, in the early stages of a pandemic, a common goal for effective containment is to gauge the epidemiological metric R0, which depends primarily on infectious period, mode of transmission, and contact rate [29,30]. Policy makers may initially seek to limit the contact rate of individuals in a population to a low value, which in the absence of therapeutic options can take the form of policies that promote social distancing.
During later stages, authorities may set a goal for vaccine efficacy and vaccination uptake by the population such that no more than a pre-specified fraction of the population is infected. Once vaccines are available, modeling can provide authorities information on vaccine rollout for best results [31-33]. This study employs a thresholding method that takes a public health goal as an input and uses it as a threshold to project related conditions necessary to reach such a goal. Our results show that vaccination drastically reduces peak COVID infections and total deaths from COVID. In a population that has had 50% of its members vaccinated with a 50% effective vaccine, peak infection is reduced from 799 to 161, and maximum total COVID deaths from 30,471 to 8,080 (Figure 4). Our model demonstrates that vaccine fraction in a population decreases mortality, as does vaccine efficacy in every level of vaccination fraction (Figures 5 & 6). These findings corroborate large placebo-controlled trials that show reduced risk of severe disease with vaccination and have additional relevance in the potential to apply such computational analysis to planning and resource allocation for future pandemics [18,19]. To explore the impact of social distancing on population health, we analyzed its role in reducing mortality when vaccination fraction was varied (Figures 5 & 6) and found that mortality reduction by social distancing is notably less in the presence of high vaccine efficacy and fraction. Our thresholding results show that more effective vaccines and higher vaccination fractions are required to limit total COVID deaths to the same 5% threshold when there is no social distancing (Figure 7). Our final set of results deal with the impact of vaccine efficacy, vaccination fractions, and social distancing on peak infections.
Total mortality and peak infection rates are reduced by vaccination and social distancing, declining with increased vaccination fractions and with high vaccine efficacy helping to reduce peak infections more sharply (Figure 8). This holds true both when there is social distancing and when there is no social distancing. Social distancing slightly reduces peak infections when the population is vaccinated. Our thresholding results show that vaccine efficacy and vaccination fractions are required at about the same level to limit peak infections to a 5% threshold for both social distancing and no distancing conditions (Figure 10). Our study is subject to limitations. First, a small dataset from a specific locality was used for the simulation, and these data were generated in 2020. SARSCoV- 2 exhibited diverse patterns of spread across the world and even in different counties in the US, with prior studies having developed models, for example, that allow transmission dynamics without peak infection [34]. Parameters for transmission and for vaccine efficacy will need to be adjusted for viral subvariants and for evolving vaccination fraction and efficacy in future work. Of note, the model allows for flexible calibration of virus characteristics, which permits refinement of our model with more realistic or more accurate estimates of transition parameters between different compartments. Second, the dataset to which this model was applied assessed patients as positive based on a polymerase chain reaction (PCR) saliva-based swab of the mouth that was widely used at the time in Italy. Nasopharyngeal or nasal PCR swabs have become standard in the interval, and the accuracy of the different modalities continues to be studied [35,36].
While the dataset may therefore introduce a degree of systematic error, our model can still be useful for assessing relationships between public health goals such as population vaccination rate and effectiveness. Given the internal validity of its results, the model likely also has utility for application to other data cohorts. Third, we assumed individuals in each compartment are identical. Numerous studies have shown that individuals differ in outcomes by their age, sex, comorbid burden, and other risk factors [37-39]. In the future, this model can be expanded to incorporate time-dependent vaccination, as the current form of this model assumes vaccination as a fixed initial condition. Future versions of the model can also include variables such as percentage vaccination among age groups. Finally, we apply assumptions regarding social distancing to allow tractability for modeling. In particular we assume that each individual in the model engages in social distancing to the same extent, and social distancing in our model causes model parameters to change in a uniform way without regard to underlying factors that could change the effectiveness of social distancing. There are various forms of isolation and quarantine that have been developed in professional, educational, and social environments in different countries, and these continue to evolve. Such higher order modeling parameters are beyond the scope of the current work. We sought to offer one form of social distancing in this compartment model to compare its importance to vaccination, which has increasingly become widespread, and found that the impact of distancing likely is attenuated with increased vaccination fraction and efficacy.
In summary, we examined the impact and interactions of social distancing and vaccinations on peak infections and total deaths from COVID-19 using a compartment model and found that vaccination flattens peak infection and reduces mortality, even at low levels of vaccine efficacy and prevalence. Social distancing also decreases peak infection and total mortality when both vaccine efficacy and vaccination prevalence are low, but its benefit is notably attenuated when vaccine efficacy and prevalence are high. Our model’s unique contribution of thresholding to assess vaccine efficacy and vaccination prevalence for preset goals of total mortality and peak infections showed that social distancing noticeably decreases required vaccine efficacy and vaccination prevalence. Tradeoffs between isolation and quarantine on the one hand and vaccine uptake on the other hand will continue to present challenges to decision makers and healthcare professionals. Our model has relevance in its ability to inform social policy decisions and public policy goals in a pandemic that is evolving and continues to pressure us to change our protocols for establishing safe workplace arrangements and sustainable educational environments. It allows for modification of parameters to reflect greater diversity of geography, cultural mores, and viral variants, which is an aim of future work.
The authors declare that the research was conducted in the absence of any commercial or financial relationships that could be construed as a potential conflict of interest.
AJ originated the conception and design of the study, created methodology and models, conducted data analysis and interpretation, and drafted the manuscript. HS contributed to conception and design of the study, data analysis and interpretation, and drafting of the manuscript.
The authors would like to thank Dr. K. J. Lee and Dr. Jason Leonard for their advice during the study.


