info@biomedres.us
+1 (502) 904-2126
One Westbrook Corporate Center, Suite 300, Westchester, IL 60154, USA
Site Map

Received: October 17, 2022; Published: November 02, 2022
*Corresponding author: Awadhesh Kumar Verma, Special Centre for Nanoscience, Jawaharlal Nehru University, New Delhi - 110067, India
DOI: 10.26717/BJSTR.2022.47.007432
To understand the mechanism of interaction between an enzyme and respective substrate or with other molecules such as inhibitors, activators or drug molecules have been very much crucial for bio-chemical research, so it is extremely important to understand the interaction between nano-systems and biomolecules to better utilization of nano-biotechnology for health sector. FRET is highly sensitive, accurate and reliable method to study such type of interactions. It is useful to study the dynamics and interactions of biological systems, in vivo cellular event and quantitative analysis in assays. The results obtained for biological research are analyzed by various established methods, but FRET is one of the very important and widely used photo-physiochemical technique that works in distance dependent manner. Understanding of the enzyme kinetic reactions at low enzyme concentration is due important for better understanding of the mechanism which can be possible by using fluorescent QDs as probe in FRET technique. Besides the limitations, FRET is yet a very much sensitive & accurate tool to monitor such processes/mechanisms.
Keywords: FRET; Jablonski diagram; Fluorophore; Fluorescent QDs; Foster Radius
FRET is a widely used photo-physiochemical distance dependent quantum mechanical and non-radiative energy transfer from a photo excited donor molecule to a suitable electron acceptor molecule in ground state when both the molecules lying in the close proximity of < 10 nm. FRET is also known as Förster energy transfer named after the German scientist who discovered the phenomena [1-4]. For the novel applications of nanomaterials like fluorescence quantum dots, biocompatibility and interactive functionality are major requirement. Fluorescent nanomaterial has emerged as an excellent class due to its high degree of biocompatibility, size dependent optical emission in the visible range, and having high excitonic band gap. Fluorescent QDs can be used as probe to monitor various interactions and process in the various bio-systems even at genetics level using FRET (fluorescence resonance energy transfer) [5-7]. For Nanobio system FRET is highly sensitive, accurate and reliable method to study nanobio interaction such type of interactions. It is useful to study the dynamics and interactions of biological systems, in-vivo cellular event and quantitative analysis in assays. The results obtained for biological research are analysed by various established methods. It is extremely important to understand the interaction between nano-systems and biomolecules to better utilization of nanotechnology. On the other hand, understanding of the enzyme kinetic reactions at low enzyme concentra tion is due important for better understanding of the mechanism which can be possible by using fluorescent QDs as probe in FRET technique, besides the limitations, FRET is yet a very much sensitive & accurate tool to monitor such processes/mechanism [8].
Basic principle of FRET and its Importance
FRET is a distance dependent quantum mechanical and non-radiative energy transfer from a photo excited donor molecule to a suitable electron acceptor molecule in ground state when both the molecules lying in the close proximity of < 10 nm. FRET is also known as Förster energy transfer named after the German scientist who discovered the phenomena. FRET is used as powerful tool to monitor inter and intramolecular interactions and biochemical reaction pathways (Figure 1). FRET reveals valuable information regarding molecular assembly or disassembly due to the change in donor-acceptor distance. The principle of FRET is based on energy transfer through dipole–dipole interaction between coupled donor-acceptor fluorophore molecules lying in the closed vicinity via time-space. Initially, the donor fluorophore is excited by absorbing a photon of suitable frequency (E=hʋ) which de-excites by radiation less transfer of energy to an acceptor fluorophore. FRET is highly sensitive and relatively easy analytical technique for conformational changes, modulation in the molecular shape and size. (Figure 2) depicts the Jablonski diagram for FRET between donor and acceptor. In FRET weak intensity emission of fluorophore reduces the FRET efficiency. Sometimes, photo-bleaching is one of the basic problems with FRET which limits the practical application. Moreover, FRET is sensitive to short range (approx 10 nm) interactions between molecules, that needs painstaking chemical labeling approach to acuurete positioning of donor & acceptor in the molecules of our interest [9-14].
Figure 1 Representation of energy transfer taking place between two fluorophores.

Figure 2 Jablonski diagram representing the energy transfer from donor to acceptor during FRET.

Necessary Conditions for FRET
The process of FRET occurs successfully only when the two fluorophore molecules must follow certain conditions like distance, spectral overlap, the dipole orientation and lifetime which are discussed below [15, 16]:
(i) Distance: Donor fluorophore and acceptor fluorophore molecules necessarily be in close proximity i.e., within 1-10 nm from each other.
(ii) Spectra: Emission spectrum of donor should overlap with the absorption spectrum of acceptor i.e., difference of energies of ground and excited states of donor and acceptor fluorophore must be comparable.
(iii) Dipole Orientation: The dipole orientations of FRET pairs should be approximately parallel for maximum energy transfer.
(iv) Lifetime of Donor chromophore: Lifetime of donor fluorophore must be marginally higher than that of acceptor for FRET.
Spectral Overlap
FRET is a radiation-less, quantum mechanical energy transfer between donor fluorophore to the acceptor fluorophore requires overlapping of fluorescence spectrum of donor molecule (D) with absorption spectrum of an acceptor molecule (A), graphically shown in (Figures 3 & 4). Integral overlap J (λ) of the energy transfer is described by equation 1.
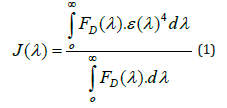
Figure 3 Orientation of donor and acceptor fluorophore; both should be parallel for maximum energy transfer between them followed by spectral overlapping of donor fluorophore emission spectra and acceptor fluorophore absorption spectra.

Figure 4 Overlap integral in FRET concept.

Where J(λ) (M-1cm-1nm4) is the spectral overlap between donor emission & acceptor absorption spectra, ε is extinction coefficient of acceptor (M-1cm-1), FD refers to the fluorescence intensity of donor fluorophore in wavelength range of λ to λ+dλ.
Measurement of FRET
FRET can be effectively measured in one of the two ways:
(i) By measuring the decrement of intensity of donor fluorophore.
(ii) By measuring the increase in the fluorescence intensity of acceptor fluorophore.
In general, normalized intensity is taken to avoid the error and dependency in the measurements.
Förster Radius
In FRET, Förster radius is the separation at which maximum quantum mechanical energy transfer takes place between donor to an acceptor fluorophore molecule. Theoretical equation for the calculation of Förster radius (Ro) is given by equation 2 [17].
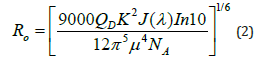
where Ro is Förster radius, QD is quantum yield, κ2 coupling/ orientation factor of the molecules which is 2/3 for random orientation, J(λ) is spectral overlap donor emission & acceptor absorption spectra, NA is Avogadro’s number & μ is the refractive index of the solvent which affects the interaction in the condensed medium.
FRET Efficiency
FRET efficiency in general inversely varies as function of 6th power of donor-acceptor distance and is given by an equation 3 [17].
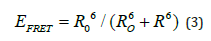
where Ro is the characteristic distance when 50 % of energy transfer i.e., the distance of maximum energy transfer and R is the distance between the donor and acceptor fluorophore as shown in (Figure 5). Energy transfer efficiency can be estimated using the fluorescence intensity of donor (ID) without acceptor, and the fluorescence intensity when both donor and acceptor (IDA) are present in the solution as represented in equation 4 [18].
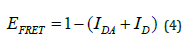
Figure 5 Maximum energy transfer efficiency at Förster radius Ro which is inverse of 6th power of donor-acceptor distance.

Applications of FRET in Nanobiotechnology
Detection of Conformational Changes: FRET can be used to study various conformational changes using fluorescence probe attached to the interested/targetted sites within 1-10 nm (Figure 6). FRET allowes to measure the conformational changes within the range of 1-10 nm. As the conformation changes, the distance between the fluorescene probe changes and hence the amount of energy transfer varies. Therefore, conformational change of the molecule can be detected [19, 20]. FRET is a highly sensitive and flexible method for studying various protein-protein interactions, enzyme kinetics, dynamic reaction changes, bonding configuration and conformational changes. Rate of reaction can be detected by fluorescence energy transfer as the transfer efficicency is dependent on distance, charge transfer characteristics and dipole orientation of the molecules. This makes FRET a fundamental tool to probe inter/intramolecular interactions and conformational changes which helps to understand the reaction mechanism (Figure 7). FRET is helpful in monitoring cellular events at time resolutions of millisecond with the help of digital fluorescence imaging microscopy, which can reveal the insight into biological molecules if the optimum conditions are achieved [21, 22].
Figure 6 The FRET during conformational change of protein.

Figure 7 (a) Intramolecular FRET (b) Intermolecular FRET processes.

Enzyme Kinetic Studies: The enzyme kinetics and the modification induced by the reaction can be followed using FRET. This basically is possible since the spectral overlap J(λ) between the donor emission and acceptor absorption varies suggesting the interaction dependent energy transfer at each level of the kinetic reaction. Therefore, the enzymatic reaction can be detected. For example, to study enzyme mechanism using FRET, one can monitor interaction of a probed substrate and enzyme. In addition to that FRET can monitor product formation rate in nucleases and proteases by the use of suitable substrates as donor and acceptor fluorophores [23].
FRET Based Biosensors: FRET enables to have the quantitative analysis of the bio-species, enzyme-kinetic reactions, molecular and cellular dynamics, various inter and intramolecular interactions. FRET based biosensors are studied to detect wide range of bioanalytes such as biomolecules, bacteria, viruses, genetic sequences, protein kinases, proteins, peptides, nucleic acids, single small molecules and mutation at sub-molecular and genetic level. (Figure 8) depicts the mechanism of the FRET biosensor using fluorescence protein as probe. The emission of Alexa is quickly differentiable from GFP molecule alone, which shows their interaction. FRET based on probing of two fluorophores at different position of single chain in which conformational change is seen just after interacting to particular substrate; alters the efficiency of FRET. Monitoring of Rac and Cdc42 activation may be performed using this approach [24].
Figure 8 FRET based on 2 chain probes, used to explain local activities of Rac & GTPase, that maintains the adhesions & protrusion formed migratory cells.

Classical Methods to Measure FRET
Use of Organic Dye as Fluorescent Probe in FRET: Traditionally, various organic molecules like rhodamines, fluoresceins, cyanines etc. are used as dyes i.e., probe in FRET due to narrow absorption spectrum and symmetric sharp emission peak, larger Stokes shift, high molar absorption coefficient and medium to high quantum yields. The optoelectronic properties of organic dyes mainly depend on the electronic transition. The fluorescence emission of organic dyes mainly generated either from whole chromophore due to delocalized optical transition or due to transition via intramolecular charge transfer. Fluorescence proteins are also used as probe in FRET [25].
Use of Fluorescent Protein as Probe in FRET: Fluorescence proteins are used as probes to measure the energy transfer between two coupled molecules and FRET imaging [26]. There are various standard protein pairs act as donor-acceptor pair such as cyan-yellow, blue-green fluorescence proteins etc. used in range of FRET based experiments. There are also mutant varieties to modify colors as a fundamental tool which facilitates study of some complicated processes in living cells. For last 10 years, FRET based approaches have become much popular due to GFP (Green fluorescent protein) [27]. The advantage having fluorescent protein than that of organic dye simultaneous response to a large category of signals & many biologically related events attributed to broad absorption and emission spectrum [28]. In recent days, continuous efforts have been made to fabricate novel fluorescent proteins (FP) variants with unique features like excellent excitation and emission wavelengths, increased brightness. FRET occurring between two different fluorescent proteins (FP-FRET) has been extensively used for biosensors. Such biosensor has been used for assays of intracellular Ca2+, protease activity and cAMP activity. Intermolecular FRET measures protein-protein interactions like interaction between transcription factors (TF), oligomerization of receptors [29]. However, proteins have broad absorption and emission spectra, hence, exist the significant amount of crosstalk which sometimes might mislead the analysis.
Limitations of Organic and Fluorescent Protein Fluorophore in FRET: Organic fluorophores have narrow absorption spectra with low value of absorption coefficients and broad and nonsymmetric emission spectrum. Except a few dyes like acridone organic dyes have short lived fluorescence in the visible range and ~1 ns in the near IR region, which are insufficient to have effective temporal differentiation of fluorescence interference from scattered excitation light having shorter life. The application of FP has limitations due to mixfixation process with tissue/molecules, broad absorption and emission spectrum leading the crosstalk, low emission intensity due to vrious reasons etc. To overcome the limitations, there is a need of new fluorescent material of compatible size to replace as probe for various FRET process to enble the yield, efficiency and sensitivity of the measurement. With the advancement of applied nanotechnology, fluorescent QDs are one of the promising candidates which can replace the FP or organic dyes [30].
Fluorescent QDs Based FRET: Fluorescent QDs have various advantages like enhanced brightness, chemical and photo-stability, resistant to photo-bleaching, high fluorescence intensity, longer fluorescence lifetime, broad absorption spectra, symmetric narrow emission peak & about 10-100 times higher molar extinction coefficient [31]. QDs have high quantum yields and efficiency. Semiconductor QDs have the advantage of tailoring the bandgap as per requirement giving various colour spectrum of the emission from UV to near IR range. QDs exhibit longer lifetime in comparison to organic dyes. The wide range of excitation wavelength of QDs provides different options of excitation wavelength which differs from acceptor fluorophore molecule. Fluorescent QDs based FRET has been used to make nano-biosensors which are used for detection of enzymatic activity, compounds having low molecular weight domains of nucleic acid, identification of polypeptides, environmental pollutants, microorganism and toxins produced. QDs based FRET are used for immunoassays & pH sensors, protein and single molecule detection. Imaging with the help of fluorescent QDs overcomes the limitations of FP. Higher fluorescence intensity of QDs entitles molecular imaging one by one making them suitable for in vitro as well as in vivo imaging [32-36].
Various Fluorescent QDs used as Probes in FRET: There is a wide range of fluorescent QDs used for FRET applications such as metal, semiconductor, core-shell, capped, polymer and biomolecule conjugated QDs designed and fabricated for different applications of FRET. CdSe-ZnS core-shell QDs show the higher quantum yields and are generally used as fluorescent bio-probes for ultrasensitive detection e.g. single molecule [37]. CdTe QDs modified by mercaptopropyl acid may be used to analyze immunocomplex involving FRET. CdSe QDs based FRET [38] explains protease activity as seen from (Figure 9).
Figure 9 FRET based detection of protease activity (a) conventional and (b) fluorescent QDs based FRET.

Merits and Demerits of Fluorescent QDs as Probe in FRET
Merits of Fluorescent QDs as Probe in FRET
(i) QDs are biocompatible, stable non-toxic within a range of concentration.
(ii) QDs can detect the abnormal behaviour of the cells. This helps in special cases like, to understand the properties of cancerous cells.
(iii) QDs can work as a probe, drug carriers as well as drug to cure the problem.
(iv) QDs as fluorophore have longer life and strong emission which resolve the problems of noise and neglect the environmental effects.
Demerits of Fluorescent QDs as Probe in FRET: QDs are generally insoluble in water or alcohol that limits the application in the field of life science. Capping of QDs with a layer of polymer enables to disperse in water. It is necessary to reduce non-specific binding of QDs that may cause misinterpretation while doing analysis of results obtained from experiment. The most important issue to be addressed in detail prior to the use of QDs is the nanotoxicity. Optimization of the shape, size and density of surface ROS is helpful to make the QDs biocompatible for various applications [39].
Limitations of Fluorophore in FRET: QDs used as fluorophore should have the size within 1-10 nm to achieve better efficiency of FRET. Also size of test molecules after binding with donor and acceptor should be less than 10 nm [40].
Summary Conclusion and Future Prospects: Since long ago FRET is helping us to monitor the interaction at inter or intra molecular level but in current scenario we can say that the FRET has been used extensively in various field of nanotechnology and nano- biotechnology with the help of fluorescent nanomaterials like fluorescent quantum dots probing and now it is possible to monitor the interaction in vivo or in vitro even at genetic level and at pico and nano molar concentration. This technology is changing the way to design the biosensor like optical biosensor which can be useful for our health industry. Despite of having so many challenges in FRET it is widely acceptable technology especially in nano-bio field, so we can say that FRET has been emerged as the spectroscopic nano ruler in NANOBIOTECHNOLOGY.
Writing-original draft preparation, review and editing -A.K.V.
Not applicable.
Not applicable.
The authors declare no commercial or financial conflict of interest during the research.


