info@biomedres.us
+1 (502) 904-2126
One Westbrook Corporate Center, Suite 300, Westchester, IL 60154, USA
Site Map

Received: March 15, 2023; Published: April 10, 2023
*Corresponding author: Philip Nathaniel Immanuel and Song Jeng Huang, Department of Mechanical Engineering, National Taiwan University of Science and Technology, Taipei, 106, Taiwan
DOI: 10.26717/BJSTR.2023.49.007834
In this study, polymethyl methacrylate (PMMA) microfluidic chips were successfully bonded for the detection of biological information in whole blood samples by Raman spectrometer measurement. The PMMA surface was modified by the application of a room-temperature H2O plasma treatment employed for a non-destructive fast bonding process of the molecular materials. The influence of the free radical reaction on the bonding quality was studied. The PMMA surface treatment was performed at a constant radio frequency (RF) power and H2O vapor flow rate. The H2O plasma treatment time was varied. Emission spectroscopy confirmed that the relative intensity of the hydroxyl radicals and oxygen emission peaks affected the PMMA bond strength. The surface free energy increased with the PMMA plasma treatment time. At the same time, the tensile test results showed that the bonding strength of OH-OH bonds on the PMMA surface increased with the plasma treatment time. The study demonstrates a method for the fabrication of a microfluidic device on a PMMA substrate that avoids the problem of deformation because bonding is carried out by plasma treatment at room temperature. This method damage-free bonding method was used to fabricate microfluidic devices on PMMA substrates. The microfluidic device, combined with Raman spectroscopy detection, requires only a small amount of blood for quick and accurate interpretation of the biological information in the sample. As the blood is driven to flow inside the upper and lower microchannels it reacts in the two mixing areas to completely mix the sample. Biological information from the mixed blood sample can then be detected through the Raman spectrometer system. At the same time, the novel device has the advantages of easy, accurate and fast analysis of information.
Keywords: H2O Plasma; Microfluidic Device; Bonding Process; Blood Sample
Abbreviations: PMMA: Polymethylmethacrylate; RF: Radio Frequency; MEMS: Micro-Electromechanical Systems; OCT: Optical-Coherent Tomography; μTAS: Micro Total Analysis Systems; SOP: Standard Operation Procedure; DRIE: Deep Reactive Ion Etching; He-Ne: Helium-Neon; PT: Prothrombin Time; DMK: Dimethylketene; H: Hydrogen; OH: Hydroxyl; SEM: Scanning Electron Microscopic; WBC: White Blood Cells; SDBS: Spectral Database for Organic Compounds
The 3D microfluidic device (3D micro-channel device) also known as a "blood detection chip" [1], provides a rapid process flow and requires only a small blood sample for the detection of biological information. This detection technique can accurately generate the essential data for biomedical interpretation. Testing can be performed within a single microfluidic device, and the results obtained investigated based on the physical and chemical properties of the materials. The recent manufacturing technology for such devices is based on the semiconductor photolithography process. In this approach micro-electromechanical systems (MEMS) [2], laser processes, and imprinting are employed to produce micron-scale micro-channels, detectors, sensors, and other components. In recent years, low-cost, modular manufacturing and fast processing technologies have been developed to simplify complex production processes and produce better devices to replace existing high-cost and low-yield microfluidic detection devices, which can reduce costs and increase the number of batches that can be processed. These disposable chips with their mixing system construction [3] have additional benefits such as high yield, avoidance of cross-infection during blood testing, and rapid testing times. Blood coagulation detection data obtained from Raman spectroscopy [4] and optical-coherent tomography (OCT) images [5] can provide much biomedical information at the same time. These single-functional microfluidic devices [6] have gradually replaced the traditional techniques.
In the mid-1990s, it was the integrated Lab-on-a-chip circuit [7] that attracted the most attention, also making possible the integration of one or more preprocessing steps that had previously had to be done in the laboratory, extending their capability from simple detection functions to complete laboratory analysis. Additionally, the Lab-on-a-card and Micro total analysis systems (μTAS) [8] have been developed which, due to cost reduction, simplicity of operation, and shortening of analysis time, combine to provide a novel and feasible technology for blood testing in the 21st century. There are several different kinds of commercial blood-testing microfluidic devices on the market, but the manufacturing procedures and types of materials are often diverse. In addition, the structural design of the microfluidic components and the binding process used in fabrication also differ. They can be divided into 2D and 3D types [9]. Since it is not possible to quickly integrate all the layers in the same production batch, it can cause difficulties in the transfer and manufacturing processes. As a result, technical developments in this field have not resulted in a standardization, which increases the difficulty of the manufacturing process and the cost of research. The advantage of these microfluidic devices is the standardization of a single process, a single standard operation procedure (SOP). For the fabrication of microfluidic devices, homogeneous or heterogeneous materials are bonded for front-end and back-end integration, which allows for reduced costs, rapid production, high quality, and so on. In this approach, the surface dangling atomic bonds are close enough to each other to form active sites for bonding.
The physical properties of the surface can be changed by plasma bombardment with the individual components bonded to form a 3D microstructure. Since there are few processing steps, the cost of fabrication is lower. In addition, compared with the photolithography and laser etching processes, the low-temperature bonding technology used to produce biomedical [10] 3D microfluidic devices require less energy, so meets the goal of energy saving, carbon reduction, as well as the characteristics of standardization and rapid production. In medicine, the data provided by blood testing can provide initial information about the presence of disease markers indicating illnesses which affect the human body such as cancer biomarkers in the blood. The rapidity of the screening application for disease detection has shown its importance all over the world. Biomedical micro-detection devices can also obtain blood information through Raman spectroscopy. This approach can quickly and accurately provide results to interpret and diagnose conditions such as liver disease, diabetes, cancer, symptoms of allergic reactions, genetic defects, anemia, leukemia, etc. This type of approach can be implemented for early detection to prevent the spread of disease comprising a rapid integrated solution for diagnostics. In this study, we developed a simple manufacturing process for a special micro-patterned liquid mixing device, a disposable microfluidic device.
This device can quickly detect and screen blood information, providing a fast and feasible tool for medical testing [11]. Here, the volume of the final microfluidic components and the size of the microchannels are reduced. Due to the reduction in the number of functional components, systematic changes in the process can be made, tailored to the requirements. Whole blood samples contain more biological information about hormones, enzymes, antibodies, and other rich protein components [12]. Information on all these characteristics in the blood is analyzed by Raman spectrometry. Traditional blood testing relies primarily upon microscopic observation which makes it difficult to observe all the information at the same time and the length of the analysis time can cause contamination or damage to the blood sample. Recently, with the development of more laser detection methods, the nonlinear scattering technology of Raman spectroscopy has been improved and is being applied more often for blood detection and analysis. Verification of the blood detection results obtained with the microfluidic devices shows that this approach is an easy way to analyze data. Our results show the advantages of this device, such as the requirement of only a small blood sample, rapidity of analysis, and accurate interpretation.
Microchannel Formation Process
A flow chart of the manufacturing process of the microfluidic device is shown in (Figure 1a). First, a 34 × 34 mm2 silicon wafer was cut. Then microchannel patterns were transferred from the silicon substrate to the PMMA substrate surface by deep reactive ion etching (DRIE) (RIE-400iPB, SAMCO, Japan) then coated with photoresist (AZ4999, Micro Chemicals GmbH, Germany). The surface of the silicon substrate was patterned with micro-channels, as shown in (Figure 1b). This etched silicon substrate was used as the first microfluidic model. The second PMMA model (SHINKOLITE™ DX, Mitsubishi Chemical, Japan) was fabricated by the thermal embossing method. The reference shape of the microfluidic channel on the silicon surface was transferred to the surface of the PMMA substrate by the hot embossing method (Tg is 105°C, 221°F). The PMMA was embossed using a positive pressure of 1.5 MPa applied through the fixture for 15 minutes. After the holding time, the PMMA was cooled to room temperature and separated from the silicon mold. This hot-pressing process produced the desired pattern on the PMMA substrate. Finally, a PMMA microfluidic substrate with shaped microchannels was obtained. It was then dried in N2 and placed in a vacuum desiccator for storage.
Figure 1 (a) Schematic diagram of the PMMA microfluidic channel manufacturing process. (b) Photograph of the finished microfluidic device after PMMA/PMMA bonding (34 mm × 34 mm × 2 mm).

Bonding of Two PMMA Microfluidic Components at Room Temperature by H2O Plasma Modification
The PMMA substrate was cleaned with ultra-sonication in deionized water and (75%) ethanol (5:1 volume ratio) for 5 minutes and dried with N2 gas. It was then placed on a cathode electrode power source and subjected to 99.5% water vapor plasma treatment. The H2O plasma treatment was carried out in a planar H2O plasma cleaning chamber (Aqua Plasma, AQ-2000, Japan). The plasma reactor was operated at a radio frequency of 13.56 MHz. The chamber temperature was monitored by a resistive sensor attached to the surface of the PMMA substrate and connected to a temperature controller (temperature uniformity was less than ± 0.5 °C). The H2O plasma pressure was kept at 2 kg/cm2. Under constant pressure, the water vapor flow rate was fixed at 10 sccm, and the plasma bombardment time was varied (10 s, 20 s, 30 s, 40 s, 50 s, 60 s, 90 s, and 120 s). The plasma power was 60 W, and the water vapor flow rate was 30 sccm. The plasma-bonded PMMA substrate is shown in Figure 2.
Figure 2 (a) Schematic diagram of PMMA/PMMA plasma bonding process. (b) Plasma inside the cavity. (c) Microchannel device after completion of bonding.

Figure 3 (a) The piece for tensile testing fixed the tensile testing machine. (b) Schematic of PMMA bonding in the plasmonic bonding region for tensile testing. (c) 3D model of PMMA tensile test (ASTM D638, type V).

Tensile Test of Bonding Strength of PMMA Microfluidic Components
In this study, lap tensile testing was used. Before the tensile strength test, the PMMA specimens were cleaned with acetone (95%): deionized water (1:20) for 15 s using an ultrasonic cleaner (Prema, DC80-900/H, Taiwan) to remove any oiliness or greasiness. Then the PMMA subtract was immersed in ethanol (95%) for 20 s, dried with N2 gas, and stored in a Petri dish. The two PMMA substrates were bonded according to the model for lap joint tensile testing (ASTM D638, V type, as shown in Figure 3b. The dimensions of the test model before PMMA bonding were: width (9.53 mm), length (36.52 mm), overlapping area (19.94 mm × 3.2 mm), and clamping area (12.4 mm × 3.2 mm). The dimensions after PMMA bonding were: width (9.53 mm) and length (63.5 mm), as shown in Figure 3c. The main objective was to increase the surface energy of the PMMA by carrying out an H2O plasma treatment process (MTS Co., Ltd., Model C43, USA), as shown in Figure 3b. The tensile test data were: weight sensor: Maximum 10 kN; Pneumatic grip controller: 20 psi. The speed of the load cell was set to 1.0 μm/min. During the loading cycle process, the tensile strength increases with the deformation of the sample until it breaks. The above procedure was adopted in the experiments to test the PMMA bond quality and the optimal bonding strength.
Whole Blood Sample Coagulation Detection by 632.8 nm Raman Spectrometry
In this study, the microfluidic device was used in combination with Raman spectrometry for blood coagulation detection. Here a helium-neon (He-Ne) laser-equipped Raman spectrometer, with a laser power of Max: 200 mW,632.8 nm excitation wavelength, Peltier cooled CCD detector, was used. The measurement was done using a microfluidic channel device with a range of 200-3000 cm-1. The blood content reveals information about the Prothrombin Time (PT) and calcium ions. The characteristics of mixed whole blood samples were measured to prevent fluorescence signal interference. The integration time was set to 3 s. Reduced laser light reduces destruction of the blood sample. The signal was scanned 3 to 5 times, and the measured Raman spectrum signal corrected three times through a filter. The afore-mentioned experimental method was carried out to provide measurements showing the spectral peaks of various amino acid components in the blood sample. The research results have been confirmed by comparison with traditional detection methods to show that Raman spectrometry combined with the use of a microfluidic device is more effective. The Raman spectral signals of components in blood contain a lot of biological information about hormones, enzymes, antibodies, and other rich protein components in the blood, which can be determined by Raman spectroscopy analysis.
PMMA is a high-quality type of thermoplastic that softens or melts when heated. Decarboxylation is the primary reaction mechanism for the process of dissociation of carboxylic acids and esters [13]. In this reaction, carboxylic acids remove a carbon atom from a carbon chain. The C=O bond decomposition reaction is the mechanism for the plasmonic formation of formaldehyde and dimethylketene (DMK). It removes carboxyl groups and releases CO2, CO, and the propyl radicals that react to form DMK and formaldehyde [14]. In this work, we used an RF power source (13.56 MHz) with a fixed power of 60 W; the bonding times for H2O plasma bonding were 10, 20, 30, 40, 50, 60, 90, and 120 s. If the plasma bonding time is too long, it will cause deformation of the microchannels or fracturing of the bonding interface. Under air cooling during the bonding process, the connection strength between the OH bond and the substrate surface is insufficient, producing residual stress and cracks in the bonding area [15]. These residual stresses will reduce the bonding strength. One of the factors affecting the bonding of PMMA is the strength of the O bonds on the PMMA surface but O-H2 has a strong bonding force with the substance. This group has a high surface energy due to hydrogen bonding. Hydrogen and the organic molecules H2+ O+ e- and H2O atoms that are bonded to the surface of PMMA along with the hydroxyl group (OH) are all bonded by plasma ionization.
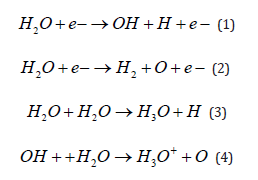
The dissociation of water vapor and the following reactions are known to generate free radicals due to the release of the OH+ e bonds [16]. The surface of the PMMA is hydrophilized by the decomposition of the organic molecules through plasmonic modification to expose the hydrogen bonds. This process leads to strong connections due to the OH-OH bonds. When the PMMA surface comes into contact with OH+H2O, it is replaced by H3O++O through the reaction, as shown in equations (1–4) below [17]. The high energy of the plasma treatment modifies the surface by destroying the irregular network structure of H and O bonds existing on the PMMA. Thus, O + e- exists with a modified surface energy which can move freely on the surface as O bonds and connects charges bridging to the H2. The positively charged H3O+ bonds are transformed by the water vapor plasma treatment [18].
The plasma treatment time determines the bonding strength (ranging from 30-120 s). The results of bonding with processing times of 30, 40, 50, 60, 90, and 120 s are presented in (Figure 4). The obtained standard deviation values exhibit accurate bond strength trends. The bonding strengths of the plasma-treated PMMA samples were 0.198, 0.3, 0.408, 0.432, 0.594, and 0.66 N/mm2, respectively. It was found that short plasma treatment times caused ionization and dissociation of the hydrogen (H) atoms and hydroxyl (OH) bonds in the water vapor, leading to the formation of free radicals on the surface of the PMMA. As a result, the discharge energy of the OH-e-bonds was insufficient, and few free radicals were generated, thereby reducing the bond strength and even leading to bonding failure in a low-power process environment.
Figure 4 Bonding strength of PMMA substrates after H2O plasma treatment for 0, 10, 20, 30, 40, 50, 60, 90, and 120 s with the standard deviation. The PMMA substrates subjected to plasma treatment for 10 and 20 s failed to bond.

Figure 5 Shows a scanning electron microscopic (SEM) image of the PMMA/PMMA bonded interface. As can be seen in the image, the interface is very smooth without any damage. Generally, high temperatures will lead to the deformation of PMMA during bonding. However, the room temperature process environment used in this study means that the pressure is evenly distributed over the surface of the PMMA substrate. At this temperature, the uneven stress at the bonding interface will be released slowly. This achieves the ultimate non-destructive bonding interface. The PMMA components were cut with a diamond knife, and the interface of two PMMA layer components observed by SEM. The cross-section of the chip was flat and free of any gaps. No air bubbles or deformation due to thermal expansion caused by thermal stress were observed, as shown in Figure 5. The H2O plasma bonding technique introduced in this study allows the bonding of high aspect ratio materials without any signs of deformation or damage. In this work, the nonlinear scattering technique of Raman spectroscopy was used in combination with microfluidic devices to detect characteristic information in blood samples. This method has the advantages of requiring only a small blood sample, rapidity of analysis, accuracy of interpretation, etc., as shown in (Figures 6a & 6b).
Figure 5 Non-destructive bonding interface of the microfluidic device (PMMA/PMMA).

Figure 6 (a) Raman spectrometer. (b) Microfluidic device (whole blood sample and coagulation factor are mixed to detect the test area).

The Raman spectra of the blood in the microfluidics chip show several peaks indicative of blood components: The Raman peaks of iso protein amino acids of Allo-D-isoleucine are at 991.3 cm-1, 1290 cm-1 [19]; the peaks at 1446 cm-1 [20] are for protein and lipids in the platelets; the peaks at 804 cm-1, 820~920 cm-1, 1726 cm-1, and 494 cm-1 indicate D-Mannose, white blood cells (WBC), and platelets (Platelets), respectively. The Oxygen concentration of the blood sample is relatively low, and after coagulation the state of the blood changes so the intensity of the main peak is also very low, and it is not easy to interpret. However, there are many second characteristic peaks in the spectrum from 600 cm-1 to 1000 cm-1, indicative of hormones, antibodies, enzymes, and other substances. There is platelet information conveyed by the peak at 1452 cm-1 and there is a second peak to the left. Due to the low-temperature preservation of the blood, there is a change in the shape of the platelets from a disc shape to a spherical shape, and some platelet lipids are lost, resulting in a weak peak signal that is difficult to interpret. The Raman spectra show that the characteristic peaks at 964 cm-1 and 1444 cm-1 disappear. The peak at 1290 cm-1 indicates the peak band value of hemoglobin. It is more obvious than the other peaks, which means that most of the components in the blood are due to hemoglobin, as shown in (Figure 7). The blood sample was placed inside the PMMA microfluidic device for 10 s for measurement (the internal position is within the blood mixing hole). After completion of blood coagulation, examination of that part of the whole blood spectrum confirms that there are almost no peak bands in the two spectra, and that a part of the whole blood sample is comprised of platelet components instead of hemoglobin [21].
Figure 7 Results showing the characteristic peak in the Raman spectrum at 632.8 nm after coagulation of the whole blood sample.

The PT can be detected as a function of the coagulation factor, which is the time required for the conversion of prothrombin into thrombin after the addition of an excessive tissue factor to platelet-deficient plasma, resulting in plasma coagulation (the average PT is 10-15s). After uniform mixing, the test could be completed within 15s. In the experiments, calcium ions (IV) were added to the microfluidic device. Blood was injected into the microfluidic device and allowed to flow into the mixing area for about 2-3 seconds after being measured by the automatic circulation system to strengthen the coagulation process. The Raman detection system can measure small changes in the characteristic peaks after increasing the integration time, so the characteristic peaks will be stronger at this time than before mixing. In addition, the mechanism of platelet thrombosis during coagulation causes them to interact (Cross talk) and strengthen each other, as is also known from the change of characteristic peaks for the platelets. At this time, it is most important to observe the difference between the characteristic peaks in the Raman spectra, before and after mixing. First the average filtering method was used to smooth the spectrum, then the background signal was removed, and the obtained spectrum processed.
To obtain the Raman spectra of the blood, one band was integrated for an average of 3 s. The blood spectrum needs to be integrated for 12 s, so a total of four bands were scanned. It is important to avoid the effect of hemolysis from the laser light source during measurement, and to measure the damage or destruction of red blood cells caused by irradiation with laser light energy Continuous use of laser light to irradiate the blood will cause hemolysis of the red blood cells [22]. We thus controlled the measurement time to be within 15 s and monitored the signal for the state of hemolysis, to avoid interpretation errors caused by hemolysis during blood analysis. The Raman spectra indicate the mechanism for the oxygenation of red blood cells in the blood, after analysis of the influence of the environment on the red blood cells themselves. The spectra record the different effects under the same conditions. Five spectra were averaged. In total, 5 intermittent scans were performed with an exposure time of 3 s for each accumulation. In this study, the detection of the oxygen-carrying capacity of red blood cells was investigated. The peaks between the 1500-1650 cm-1 are related to the oxygen-carrying capacity of red blood cells [23], which can be used in the evaluation. Our results confirmed that the characteristic peak at 1619 cm-1 was also affected by the ambient oxygen content producing a change in the intensity.
Figure 8 Changes in blood concentration and red blood cell peak oxygenation after coagulation.

The Raman spectrum scattering blood characteristic peaks were clearly identifiable when the normal saline dilutions ratios were 1:1 and 1:5. The high intensity peak with a maximum value can be detected at least 1.41 times. Therefore, a higher dilution produces weaker peaks, and some are not easy to distinguish. Information can still be obtained when the dilution ratio is higher than 1:10 by using a higher laser power or longer integration time, but this may damage the blood sample or change the dilution ratio. The extent of this effect is the limit value observed in the experiments and can be tested with a smaller amount of blood. Studies have confirmed that a blood dilution ratio of at least 1:5 can be measured in this case. Raman measurement was made with a 632.8 nm laser system. The Raman features and vibrational modes could be clearly observed with peaks at 755 cm-1, 1212 cm-1, 1270 cm-1, 1365 cm-1, 1446 cm-1, 1575 cm-1, and 1608 cm-1 easily affected by the hemolysis signal [24,25]. The measured changes in concentration and peak oxygenation of the red blood cells are shown in (Figure 8).
In this study, an H2O plasma process was used to realize the low-temperature bonding of a microfluidic device (PMMA/PMMA) with the upper and lower layers combined with the blood mixing zone of the microfluidic device. The fabricated device was then utilized to measure blood coagulation information. Raman spectral signals were successfully obtained. The bonding strength could reach 0.66 N/mm2. The plasma was used to modify the surface of the PMMA. The process was carried out at room temperature thereby eliminating the internal stress that can occur when the materials are bonded, which can prevent the final product from cracking or blood leakage. The bonding interface of the microfluidic device was observed through SEM. The observations proved that the interface was very flat and the bonding process non-destructive to the surface of the PMMA material. Since PMMA has larger molecular branches and higher viscosity, using plasma modification at room temperature to replace the traditional bonding method brings the advantages of less pollution and low energy consumption. In experiments with the fabricated device, Raman spectrometry was used to detect the blood components and the state of the blood after coagulation, as well as biological information in whole blood samples.
The advantage of the device is that the information of the components in the blood can be analyzed more accurately. The analysis shows that the ester composition has a large influence, and the lipid substances have undergone serious changes. The peak intensity, which can be used to evaluate the oxygen carrying capacity of the blood, decreases after coagulation. By querying and comparing the results obtained in the experiments with the Spectral Database for Organic Compounds (SDBS) [26], it is found that there are many signals indicative of amino acids. The regional band from 1200-1300 cm-1 is mainly due to the changes in C-H bonding, that from 1300-1400 cm-1 is due to the deformation characteristics of the pyrrole rings; and that from 1500-1650 cm-1 is due to the changes of the spin state and the oxygen carrying capacity of red blood cells. After comparison, it is found that the high-precision confocal Raman microscope system is an effective method for measuring whole blood information, which has been confirmed in this work.
The authors would like to thank the Ministry of Science and Technology, Republic of China (Taiwan), for their support of this research under contract number: MOST 109-2224-E-011-002.


