info@biomedres.us
+1 (502) 904-2126
One Westbrook Corporate Center, Suite 300, Westchester, IL 60154, USA
Site Map

Received: February 24, 2024; Published: March 22, 2024
*Corresponding author: Nadia Sharif, Department of Biotechnology, Women University Mardan, Pakistan
DOI: 10.26717/BJSTR.2024.55.008744
Phytochemicals become more popular as they act as an antioxidant, stimulate the immune system and thought to be largely responsible for the protective health benefits. This chapter dealt with photochemistry techniques generally tinted on the analytical procedures, including the extraction approaches of bioactive compounds present in the plant extracts. Techniques in Photochemistry involve the quantitative and qualitative methods of phytochemicals isolation and detection. Phytochemical techniques included chromatographic and spectroscopic techniques of Thin Layer Chromatography, High Performance Liquid Chromatography, High Performance Thin Layer Chromatography, Gas Chromatography Mass Spectrometry, Nuclear Magnetic Resonance, Fourier Transform Infra-Red spectroscopy and Optimum Performance Laminar Chromatography.
Keywords: High Performance Liquid Chromatography; Fourier Transform Infra-Red Spectroscopy (FTIR); Nuclear Magnetic Resonance (NMR); Mass Spectrometry (MS)
The phytochemicals have been categorized as primary or secondary metabolites include amino acids, proteins, sugars, alkaloids, steroids, chlorophylls, purines and pyrimidines of nucleic acids, terpenes, flavonoids, lignans, glucosides, curcumines, saponins, and phenolics. Methods generally used in the field of phytochemistry are extraction, isolation, and structural elucidation of natural products, besides several chromatography and spectrometric techniques (MPLC, HPLC, and LC-MS, GC- MS). There are different techniques which are being used for the Qualitative and Quantitative Analysis of plant metabolites [1,2]. Certain methods of phytochemicals analysis are Alkaloids determination by Mayer’ s and Wagner’s test; Ninhydrin test for Amino acids detection, Carbohydrates detection by Molish’s and Benedict’ s test; Spot and Saponification test for Fixed oils and Fats detection. Borntrager’s test and Legal’s test is used to determine the Glycosides, Phenolic compounds and Tannins are tested by Ferric Chloride test, Gelatin, Lead acetate, Alkaline reagent test, Magnesium and Hydrochloric acid reduction. Phytosterols are tested by Libermann- Burchard’s test and Proteins presence is Millon’s test and Biuret test [3,4].
Other standard strategies for medicinal plant extraction include immersion, infusion, penetration, digestion, decoction, high temperature continuous extraction (Soxhlet), fermented aqueous alcohol extraction, Countercurrent extraction, microwave-assisted extraction, ultrasonic extraction (sonication), supercritical fluid extraction, and phyton extraction (using fluorocarbon solvent) [5]. Chromatography is the an efficient, simple, rapid and reliable method of separation and identification of phytochemicals. Separation of phytochemicals is achieved in Chromatography through differential partitioning amid the mobile and stationary phases. There are different types of chromatographic techniques. In phytochemical research, these techniques are selected based on the type of analysis, the target compound, and the nature of plant product involved. Chromatographic separations can be conceded out using a variable supports, comprising silica on glass plates (thin-layer chromatography, TLC), paper (Paper chromatography PC), volatile gases (gas chromatography, GC), and liquids, which may incorporate hydrophilic, insoluble molecules [6].
Gas Chromatography (GC)
If a sample dispenses itself in both phases, it will migrate at an intermediate rate. Gas chromatography is appropriate for volatile mixtures. In this technique, species apportion between a gas and a liquid phase. The liquid phase is fixed and the gas stage is flowing. At the point when the sample particles are in liquid phase they are fixed. The rate of migration relies on the amount of chemical species that is dispersed in liquid phase. High the level of material in the vaporous state fast will be the migration. The species which administers itself 100 percent in the fixed state won’t migrate. In the event that a sample apportions itself in both liquid and gaseous phase, it will migrate at an intermediate rate. This gas chromatography gives the total vapors. Consequently, it is generally utilized for quantitative analysis [7].
Gas Chromatography Mass Spectroscopy (GCMS)
GCMS is the utmost reliable instrument for studying natural samples, separating compounds, and distinguishing parts at the elementary particle level. The GC deals with the rule that when a mixture is heated, it separates into individual substances. The heated gas passes through a section containing latent gas such as helium. As the separated material rises from the segment opening, it flows into the MS. Mass spectrometry makes a larger distinction based on the mass of the analyte particles. A library of known mass spectra containing thousands of mixtures is stored on your PC. Mass spectrometry is considered to be the only definitive insightful detector [8].
High Performance Liquid Chromatography (HPLC)
HPLC, also known as high pressure liquid chromatography, offers together qualitative quantitative and examination in a single operation. This is a high-speed isolation and analysis technique established on conventional column chromatography. Its isolation principle is analogous to regular column chromatography including adsorption chromatography, gel chromatography, partition chromatography and ion exchange chromatography. HPLC is valuable for compounds that cannot be vaporized or that decompose at elevated temperatures. HPLC separate compounds based on their interaction with solid particles and mobile phase solvents in high density packed columns. High pressures of 400 bar is requisite to elute the analyte from the column afore it permits through the detector [9]. HPLC started around 45 years ago and various HPLC stationary phases and columns have been presented by more than 50 manufacturers in the United States and around the world. GCMS is applied to solid, liquid and gas samples. First, the sample is converted to a gaseous state, and then the analysis is performed based on the mass-to-charge ratio. HPLC can be applied to compounds that are soluble in solvents. HPTLC is suitable for separation, detection, qualitative and quantitative analysis of phytochemicals. HPLC columns are manufactured using particulate fillers 5-20 μm in diameter and high pressure homogenate column loading innovation.
The eluent is pumped into the column by a high pressure infusion pump and is outfitted with a sensitive detector and automatic recording and collection device. This is far superior to traditional column chromatography in terms of separation rate and efficacy. It features high competence, high rate, and automation [6]. The detectors generally utilized in HPLC are UV detectors and differential refractometer detectors, both of which have constraints. Differential refractometers are sensitive to temperature changes, detection of small amounts of material is a lot of times not ideal, and gradient elution can’t be utilized. The UV detector cannot detect a sample without UV absorbance. As of late, a type of mass detector called the Evaporative Light Scattering Detector (ELSD) has been used in HPLC. Not only can samples without UV absorption be detected, but also gradient elution can be used. Suitable for utmost non-volatile components [6,10]. Preparative HPLC can be utilized to produce large quantities of high-purity samples. HPLC has part an undeniably significant part in isolation, identification, and qualitative and quantitative analysis of phytochemical components.
When separating many phytochemical components, it is important to isolate the trace components from large amounts of crude extract. High-purity samples are usually prepared by high-pressure or medium-pressure liquid chromatography during the final stages of separation. The constant concentration eluent is mainly utilized in preparative HPLC. However, gradient elution may be used for samples that are challenging to be isolated. In addition, HPLC holds the following advantages of liquid chromatography, for example, a wide range of applications and adaptability while changing mobile phases. It can be applied to chemical components that are difficult to gasify, have high molecular weight, and have thermal instability [6].
Figure 1

High Performance Thin Layer Chromatography: (HPTLC)
HPTLC is a modified version of TLC. HPTLC is planner chromatography, which uses an advanced workstation to perform detection and acquisition and perform sample component separation on the high-performance layer. These high performance layers are precoated with an adsorbent with a particle size of 5-7 microns and a layer thickness of 150-200 microns. The reduction in layer thickness and particle size, along with the type of separation, leads to improved panel efficiency. HPTLC is apt for qualitative, quantitative, and micro preparative chromatography [11].
Optimum Performance Laminar Chromatography (OPLC)
OPLC cartels the recompenses of HPLC and TLC. The system can separate approximately 10-15 mg of samples, depending on the model, and process up to 4 or 8 samples simultaneously. OPLC uses a pump to force a liquid mobile phase through a stationary phase like silica gel or a bound phase medium. The OPLC column housing construction allows the use of flat planar columns, similar to cylindrical glass or stainless steel columns. The flat column is pressurized to a maximum of 50 bar and the mobile phase is extruded at a constant linear velocity via a solvent feed pump. The workstation effectively separates the desired compound sample, together with two sample holders for 96-well plates and an automated sampling system that takes samples from each well and spaces them in the solvent flat OPLC adsorbent bed. Contains all the modules needed for. Delivery system with mobile phase degasser and pump, OPLC cleaning unit, 4-channel diode array detector to monitor eluent, and 6 96-well plate fraction collectors to collect isolated compounds. Multilayer OPLC (ML-OPLC) Principle OPLC is apposite for developing multiple chromatographic plates at the same time if the plates are expressly manufactured. By this multi-layer technique, numerous samples can be isolated in a single chromatographic analysis. By connecting the chromatographic plates in parallel, multiple HPTLC plates can be settled at the same time. Circular OPLC can separate 360 phytochemical samples in 150 seconds.
The speed and / or efficiency of OPLC separation for complex samples can be improved by using ML-OPLC. In this case, more chromatographic plates can be developed using the identical or different types of stationary phases. Principle of long-distance OPLC (LDOPLC) Long-distance OPLC is a multi-layer development technology using specifically prepared plates. Similar to the production of layers for linear OPLC development, all four edges of the chromatographic plate should be impregnated with the polymer suspension. Eluent transfer with a linear solvent front can be make certain by placing a narrow sheet of plastic over the layer or by scratching the narrow channel of adsorbent at the solvent inlet. Several plates overlap each other to confirm a long mileage. The benefit of circular development, in which the mobile phase moves radially from the center of the plate to the periphery, is known to separate the compounds in the low RF range, which provides 4 or 5 times the resolution of circular development. The separation force of the circular deployment is more effectively utilized when the sample is punctured near the center. As the distance among mobile phase inlet and the sample application rises, the separability approaches a linear expansion. Of Sine Circular OPLC does not require plate preparation [12].
Spectrometry
Spectroscopy is utilized to detect secondary plant material. The following are commonly used when studying phytochemicals. UV-Vis to see if the system is conjugated (colored compounds like β-carotene are in the strongly conjugated pi-electron system). FT-IR for identifying functional groups present in a compound. Determines the molecular weight of MS-compounds and identifies the presence of Cl and Br isotopic patterns. 13CNMR-determines the type of carbon atom present in a compound. 1H NMR-Investigate the types of hydrogen atoms present in a compound and find out how the hydrogen atoms are connected.
UV-Vis Spectrophotometry
Ultraviolet-visible spectroscopy is a measurement of attenuation
after a light beam has passed through a sample. Most organic molecules
and functional groups absorb in the region of the electromagnetic
spectrum in the range of 190 nm to 800 nm. This denotes to
absorption spectroscopy in the UV-visible spectrum range. Visible absorption
directly affects the perceived color of the chemicals convoluted.
UV light has enough energy to push external electrons to higher
energy levels, and UV spectroscopy is typically valuable to molecules
or inorganic complexes in solution. This leads to transitions between
electron energy levels. Also called electron spectroscopy. Applying
Lambert-Beer’s law to measure the absorbance at a particular wavelength
can determine the concentration of the solution to be analyzed.
The information provided by this spectroscopy, combined with the information
delivered by NMR and IR spectral data, leads to valuable
structural proposals. It helps to characterize the absorption, transmission
and reflection of various important substances such as pigments
and other compounds from plants. This qualitative application entails
recording at least a portion of the UV-Vis spectrum to characterize
the optical or electronic properties of the material. Chromophores of
organic molecules absorb this radiation in the ultraviolet or visible
range. The absorbed photons excite the electrons in the chromophore
into high-energy molecular orbitals, resulting in an excited state. The
organic chromophore envisions four possible transitions: π–π*, n–π*,
σ–σ*, and n–σ*. These transitions require a certain amount of energy
(quantization) and produce one or more distinct peaks. The greater
the number of chromophores, the greater the degree of absorption
and the higher the intensity of the absorption peak. If only a few chromophores
absorb the radiation, the total energy absorption will be
low, resulting in the observation of lower intensity peaks. This forms
the basis of Beer-Lambert’s law, which shows that the percentage of
absorbed radiation is proportional to the number of absorbed molecules
in its pathway.
Mathematically:
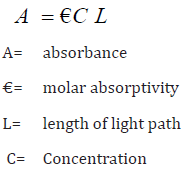
The wavelength of the absorption peak is dependent on the type of bond in the molecule. Woodward-Fieser rules, such as a series of empirical observations, are utilized to determine λmax. However, the spectrum alone is not a definite test for a specific sample. There are several factors that affect the absorption spectrum of an unknown sample, the type of solvent, the pH of the solution, the temperature, the high electrolyte concentration, presence of interfering substances etc.
Fourier Transform Infrared Spectroscopy (FT-IR)
FT-IR spectroscopy is an effective analytical technique that finds greatest utility in qualitative analysis of organic and organic metal compounds. For example, FT-IR spectroscopy is used to characterize phytochemicals in plant extracts. Infrared spectroscopy is a measurement of near-infrared light wavenumber and absorption intensity by a sample. Mid-infrared light has enough energy to excite molecular vibrations to higher energy levels. The FT-IR spectrum is recorded in the wavenumber range of 4000-400 cm-1 to determine the functional groups present in the phytochemicals. The various absorption bands of the FT-IR spectrum correspond to the characteristic stretching and bending vibrations of the various functional groups present. The FTIR bands appearing in the range of 4000-1500 cm-1 are associated with stretching and bending vibrations of functional groups, and the presence of absorption bands in the 1500-1400 cm-1 wavenumber range corresponds to the fingerprint area. The OH and C-H stretch frequencies were in the range of 3700-2500cm-1, and the C-H stretch oscillations were in the range of 2900-2800cm-1. FT-IR spectroscopy is used to identify the identity of a particular compound and determine newly synthesized molecules. This technique works on the principle that a beam of light contains light of many frequencies at the same time and how much of that beam is absorbed by the sample. The beam is then modified to contain different combinations of frequencies, producing a second data point.
This process repeats rapidly over and over in a short period of time. The FT IR software then takes all this data and works in the opposite direction to derive the absorbance in the IR region. The above beam is generated by starting with a broadband light source that contains the full spectrum of the measured wavelength. In the FT-IR Michelson interferometer, light is directed at a Michelson interferometer with a specific configuration of mirrors, one driven by a motor and the other fixed. As the movable mirror moves, the light of each wavelength in the beam is periodically blocked by wave interference and passes through the interferometer. Because different wavelengths are modulated at different velocities, the beam coming out of the interferometer has different spectra at any time or at the mirror position. Processing the data requires computer processing to convert the raw data (absorbance at each mirror position) to the desired result (absorbance at each wavelength). It turns out that the required processing is a common algorithm called the Fourier transform. The Fourier transform transforms the domain (displacement of this mirror (cm) into its inverse domain (wavenumber (cm-1). The raw data obtained is called an “interferogram”. This resulting interferogram is transformed into an FT-IR spectrum by Fourier transform. Raw data should be stored in digital format as a series of values at equal path length intervals, depending on the required resolution.
Mass Spectrometry
Mass spectrometry is a powerful material identification tool based on determining the atomic or molecular weight of individual species present in a sample. In mass spectrometry, a small sample of a compound in either solid, liquid, or gas form is introduced into a device called a mass spectrometer, where it is vaporized and then ionized. The most common are electron ionization, but other sources include fast atom bombardment, chemical ionization, atmospheric chemical ionization, and electrospray ionization. In the electron ionization method, when an electron hits a molecule, it knocks out the electron to generate a radical. These radical cations dissociate into smaller fragments due to the high energy gain from the electrons. This ionization and fragmentation produces a mixture of particles. Some of the particles are neutral and some are positively charged. These positively charged fragments pass through two negatively charged plates, accelerating the fragment into an analyzer tube surrounded by magnets, deflecting the ions from their original orbits and allowing them to adopt a circular path. Their radii depend on their mass-to-charge ratio. Ions deflected by a magnetic field hit the detector and generate an electric current. The detector used is a photomultiplier tube, but other detectors such as Faraday cups and ion-to-photon detectors are also used.
The resulting compound spectrum consists of the relative intensities plotted against m / z. Mass spectrometry has become one of the most important tools in biochemical science, with potential from small molecule analysis to protein characterization. Mass spectrometry is a powerful analytical technique used to identify unknown compounds, quantify known compounds, and elucidate the structure and chemistry of molecules. The molecular weight of the sample can be determined from the MS spectrum. Structural information can also be generated by certain types of mass spectrometers. This method is a previously characterized compound in a complex mixture with high specificity by simultaneously determining the structural elucidation of organic compounds, the sequencing of peptides or oligonucleotides, and the molecular weight and diagnostic fragments of the molecule. Helps monitor the presence of.
Nuclear Magnetic Resonance Spectroscopy (NMR)
Nuclear magnetic resonance spectroscopy provides the physical, chemical, and biological properties of a substance. Chemists routinely use NMR spectroscopy to study chemical structures in a simple one-dimensional technique. Two-dimensional techniques are used to determine the structure of more complex molecules. These techniques replace X-ray crystallography to determine the structure of proteins. Time domain NMR spectroscopy is used to study molecular dynamics in solution. Solid-state NMR spectroscopy is used to determine the molecular structure of a solid. 13C NMR is used to identify the carbon species present in a compound. 1H NMR is used to find out what kind of hydrogen is present in a compound and how the hydrogen atoms are connected. NMR spectroscopy is an advanced characterization method for measuring organic molecules by placing them in a string magnetic field. The nuclei of some atoms with a spin quantum number I = ½ begin to behave like small magnets. When a wide range of radio frequency waves from a radio source are applied to the sample, the nuclear spin state no longer has the same energy. Therefore, one creates a low-energy (+ 1/2) and the other high-energy (-1 / 2) nuclear spin state. Protons in a magnetic field aligned with the applied magnetic field have lower energies than protons aligned with the magnetic field. Nuclei aligned with the applied magnetic field can absorb energy and change the spin state (high energy state). This phenomenon is called flipping. The amount of energy absorbed depends on the energy gap between the two states.

After absorbing high frequency radiation, it begins to oscillate at its own specific frequency (Figures 1 & 2). The nuclear resonance frequency is then measured by the detector of a nuclear magnetic resonance spectrometer and converted into an NMR spectrum. It shows all the correct frequencies as peaks in the figure. The height of each peak represents the number of nuclei that resonate at each particular frequency. This is called signal strength. The more resonance cores there are, the stronger the will. Nuclear magnetic resonance spectroscopy provides information about atoms such as protons, their adjacent atoms, and their relative positions. The environment around the protons determines the amount of radio frequency absorbed. If the atoms are in close proximity to each other, they may even resonate with each other. By examining the cross-chip, scientists can determine the 3D structure of the molecule [13].
X-Ray Diffractometry (XRD)
X-ray diffraction is a non-destructive analysis technique utilized
to analyze the atomic or molecular structure of a materials. The furtive
of protein crystal structure (many times larger than cholesterol)
was unraveled in myoglobin by Sir John Kendrew in the 1950s. X-ray
crystallography is a useful tool for this determination of how a drug
interacts with its protein and what changes are improved. X-rays are
the appropriate wavelength (~ 1Aº) scattered by an electron cloud
of atoms of comparable size. These monochromatic X-rays generated
by the X-ray cathode fluorescent lamp or the rotating target pass
through the collimator and are scattered by the sample (in the form
of fine powder), causing interference. This leads to lower intensity
and higher intensity patterns because of constructive and destructive
interference.
According to Bragg’s law.
nλ = 2dsinθ
Path difference = 2dsinθ
Path difference for constructive interference = nλ
The diffracted beam that can be captured on photographic film
forms a series of spots called the Laue pattern. The crystal structure
is derived by evaluating the position and strength of various points.
Bragg’s law helps determine the D spacing, which is the distance
among the atomic planes that causes diffraction spikes. The structure
of the sample can be recognized through comparison with the
standard reference pattern at D intervals. D-spacing references are
accessable from sources such as the International Center for Diffraction
Data (ICDD). The electron density can be reconstructed from the
diffraction pattern of the periodic arrangement of molecules or atoms
in the crystal obtained by X-ray scattering. Additional phase information
can be extracted from either diffraction data or supplemental
diffraction experiments to complete the reconstruction. The model
is then gradually incorporated into the experimental electron density
and refined from the data, resulting in a fairly accurate molecular
structure [14].
Figure 2

The world’s flora is a rich treasure of phytochemicals which can be used in many industries. These photosynthetic machines can be said to be a gift from God because of their usefulness in the treatment and management of diseases. Utilization of pharmacological properties of phytochemicals includes advance research of active components by enactment methods of identification after extraction, purification, separation and crystallization. It is likewise found that non standardized methodology of extraction might prompt the degradation of the phytochemicals present in the plants and may prompt the variations hence prompting the lack of reproducibility. Plant material consists of several bioactive compounds of multi-component mixtures so the separation and grit can be acritical task. Practically the vast majority of them must be purified by the combination of a few chromatographic strategies and different other purification techniques to separate bioactive compound. Chromatography and Spectrometry is the science that concentrates on separation of molecules based on differences in their structures.


