 Review Article
Abstract
This study consists of modeling and simulating the behavior of a prosthetic leg adapted to running using the finite element method, therefore the work is divided into three phases. In the first stage, the study is focused on the modeling of prostheses and their contact with the ground, followed by a phase of simulation of its behavior. The final phase of this work is oriented to the study of the influencing factors on the overall behavior of the prosthesis: number of folds, mechanical properties and an estimate of the service life. The evaluation is determined on the uncertainty of the stresses due to modeling errors, and the dispersion of the data obtained from the fatigue tests [1]. The results indicate that the accuracy of the prosthesis fatigue assessment is strongly related to the accuracy of the stress estimation. Additionally, a relationship between the probability of fatigue failure and the number of stroke cycles has been suggested, in order to provide a benchmark for prosthetics to determine the time interval for prosthesis inspection.
Introduction
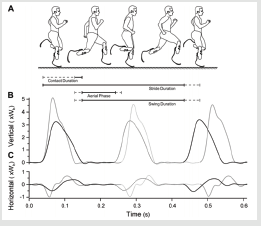
Figure 1: Representation of the sprint cycle with Flex Foot Cheetah:
a) Sprint phase
b) Vertical reaction force
c) Horizontal reaction force. According to [4].
The tibia of a sports amputee, the phases of running (the support phase, the stride or the aerial phase “flight stage”) are identical to those of a normal person (Figure 1). The prosthesis replaces the foot and the tibia [2]. Thus, it must ensure the function of locomotion of these anatomical elements removed by amputation. In the support phase, the prosthesis behaves as follows:
a) Damping phase: the prosthesis is contracted with a value
determined by the elastic characteristics of the material, and
depending on the body weight,
b) Following the initial support phase, a process of
displacement of the energy stored at the peaks of the elastic
blade is triggered.
c) Energy is initially stored at the tip of the blade. At
this stage, this energy produced by the amputee runner is
equivalent to that generated by the gluteal muscles at the hip of an able-bodied runner. The scene is finalized by the forward
propulsion of the rider’s body. The prosthesis is used as an
identical passive adaptive dynamic system which can increase
performance, if used correctly, and is capable of making simple
harmonic movement, is a trampoline [3].
However, a trampoline has non-linear stiffness, which allows it to be used easily by athletes of varying mass. The inertia of the athlete falling from a height stores a large amount of deformation energy in the sheet and the springs under the effect of their great movement. This deformation energy is then recovered by the mass, which tries to return to the initial state. However, under the effect of damping and loss of energy, this mass will never regain its original height without assistance or without additional energy input. If such a mass was able to generate a cyclic rebound action, and if the frequency of this action matches the frequency of the perceived mass/spring system, then the athlete will continuously bounce without leaving the sheet at the natural frequency of the system [4]. In the case of a trampoline, if the input energy per cycle is greater than the system energy loss per cycle, the athlete will be able to gain height otherwise impossible to reach without assistance and simply by using their ankles [5]. This result in a higher takeoff speed, which means higher kinetic energy, resulting in higher potential energy stored in the system. In this work, we consider the hypothesis that walking or running at a frequency that corresponds to the natural frequency of the ESR system of the foot and the body mass which has a mechanical advantage if used in synchronization, as in a trampoline. . This allows for improved performance if the foot is used at its optimal dynamic characteristics.
Digital Study
Assignment of Interactions
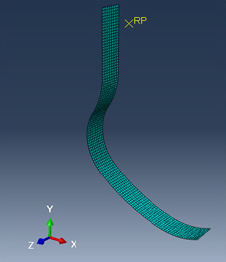
Figure 2A: Geometric representation of prosthesis.
A contact was defined by surfaces which had to be in interaction, and the way of its treatment depends on conditions and parameters of contact. In our study, one chose a contact with dry friction (coefficient of friction equal to 0.2, Hard contact), thus ensuring a fast convergence without effect on the rigidity. The ground is defined as a regulated surface (Analytical rigid body), therefore does not require a finite element discretization, hence the computation time is reduced. An RP reference point was created in order to apply the load in a manner similar to the real thing, in which there was rigidly coupled a group of nodes in the upper part of the prosthesis. This way allows the linked nodes to reproduce the movement of the associated reference point (Figure 2A). The actual Cheetah Flex foot type prosthesis with these accessories is shown in Figure 2B.
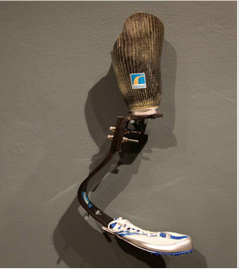
Figure 2B: Geometric representation of prosthesis.
Boundary Condition
The boundary conditions applied in this modelization are defined in the following way:
Mechanical Properties
a) The plate, which models the ground, is fixed
b) The reference point (RP) which controls the movement of
the prosthesis has two degrees of freedom, a movement along
the vertical Y-axis and a rotation around the Z-axis.
c) A force concentrated in the Y direction.
Mechanical Properties
The Flex Foot Cheetah sports prosthesis is made from the composite material pre-impregnated with flat stress carbon fibers [6]. It is possible to simply define the mechanical characteristics as “lamina” for which six properties are required. These properties are obtained from the literature of composite materials such as HexaTOOLS® composites, and they are illustrated in the table below (Table 1). Since there is no precise information on the rolling sequence, we will first assume that the prosthesis is composed by the sequence of the following layers: two layers of tissue with a privileged orientation [0/90], and has a cover layer on each of the outer faces of a thickness of the order of 0.275 mm. A variable number of unidirectional layers 0.2 mm thick inside depending on the size of each section. The latter is composed of several films of carbon fiber base prepreg. In our study, we adopted this fiber arrangement methodology
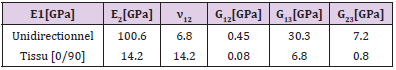
Table 1: Values of mechanical characteristics of materials used.
Six-Section Model
In this model we increased the number of layers in the third and fourth sections in order to identify their influence on the stiffness or deformation of the prosthesis. The number of strata and the arrangement of the fibers of this model are well mentioned and configured successively in Table 2, and in Figure 3. The configurations below show the orientation of the fibers and the layer thickness of each section.
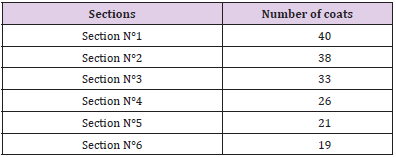
Table 2: The number of layers of each section.
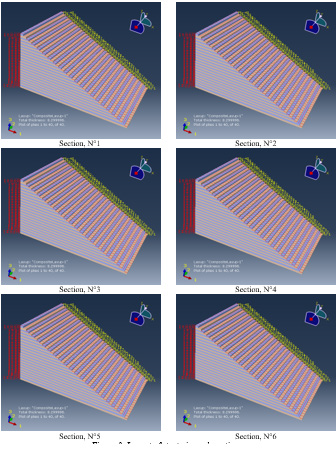
Figure 3: Layout of strata in each section.
Results Analysis
The evolution of the stresses during the time of the contact is presented in Figure 4, this curve shows that the maximum stress value is about 324 MPa at 60% of the time of the contact. Note from the previous figure that the stresses are concentrated at the third and fourth section where the curvature of the prosthesis is located (Figure 5).
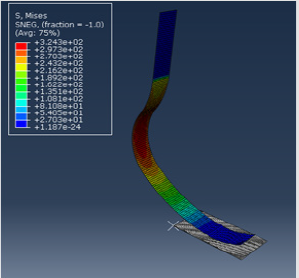
Figure 4: Stress distribution in the prosthesis.
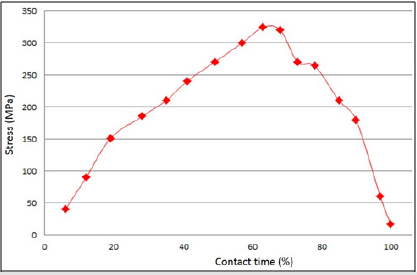
Figure 5: Evolution of stresses during the time of contact.
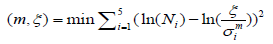
Cumulative Damage : Miner’s Law
Laboratory tests generally consist of repeating the same request a large number of times. In this case, it is easy to define a damage: it is the number of repetitions of the damaging event since the start of the test. In the general case, there are several damaging events, which differ from each other by the magnitude of the stresses undergone and also by other operating parameters of the loading [7]. Miner proposed two principles that allow the damage to be accumulated [8]
a) The damage caused by an occurrence of an event is measured by the inverse 1/N, of the number N of times of the repetition of this event to bring the part from new condition to failure.
b) The damage caused by a succession of events is the sum of
the damage caused by each of them.
Miner’s law is written:
Where n is the number of the cycle specified at the i-th stress acting on the structure, N is the life of the material subjected to a stress σ, and D is the coefficient of damage, which is equal to 1 at the time when the part is break, and it is often considered to be a random variable that follows the lognormal distribution, thus reflecting the uncertainties of Miner’s rule. During the race, the prosthesis is subjected to a cyclic load, therefore, to evaluate their fatigue resistance we used Miner’s law. Based on the finite element analysis it was found that the maximum stresses are at the level of the curvature, this suggests that this is the region where fatigue damage is most likely to occur [Kumar A]. Usually, stress uncertainty exists, it is unavoidable in the finite element analysis of the prosthesis, due to modeling errors. Thus, the actual stress of the prosthesis is defined as:
σr = K.σe (2)
σr : the actual constraint.
K : the uncertainty on the constraint which is assumed to be a
variable follows the log-normal law.
σe : the constraint obtained by simulation by finite.
From the finite element simulation, it was found that the maximum stresses are at the third and fourth section, so we tried to measure them during the contact phase. The results obtained are 324 MPa for the third section, and 280.2 MPa for the fourth section. So, Miner’s law is written in the form:
 (3)
(3)Where n represents the cycle number of the phase of contact of the prosthesis with the ground and N1 and N2 are the service life of the material of the prosthesis subjected to the actual stress
σ1r and σ2r.
In order to calculate N1 and N2, Wöhler’s S-N curve model, which is suitable for most materials, is adopted here:
Nσm =ξ (4)
Where m is the exponent of the fatigue resistance, and ξ is the coefficient of the fatigue resistance. N is the life of the material subjected to stress (σ). To account for the dispersion in the fatigue test data, ξ is treated as a random variable which follows the lognormal distribution. The results of the fatigue curve of composites [0/90] based on carbon fibers / epoxy are obtained from the book “Engineer’s technique”, and they are mentioned in the Table 3.
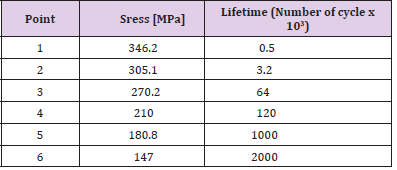
Table 3: stresses as a function of the service life of composites based on carbon fibers epoxy.
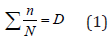
In order to identify the values of m and of ξ, the computation of the data regression of the fatigue test of the material is done. This calculation consists in finding:
 (5)
(5)After any calculation, we get m = 17 and ξ = 9.4.1041, and the function of the fatigue curve of this material is then written as follows
Nσ17 = 9.4×1041 (6)
The graph of the S-N curve is shown in Figure 6. It can be seen from the curve that the Wöhler model roughly matches the test data, and that the endurance limit is approximately 150 MPa. Thus, N1 and N2 are easily obtained from the previous equation according to the values of σ1r et σ2r.
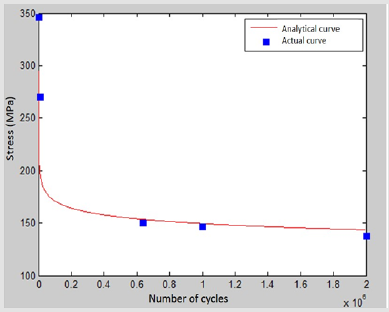
Figure 6: Wohler’s model fatigue curve.
Fatigue Reliability Analysis
With the substitution of equations (2) and (4) in equation (3). Equation (3) is reformulated as:
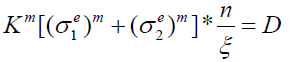 (7)
(7)Generally, reliability analysis considers the limit state (ultimate limit) to define fatigue. For an ultimate limit state, the resistance or fatigue strength is represented by a certain degree of structural resistance, which represents a maximum value of the structural resistance. Damage occurs when the predicted load is greater than the breaking limit. In our case, the limit state equation characterizing the rupture of the prosthesis is defined by:
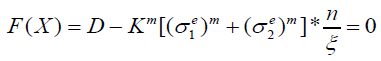 (8)
(8)Where X represents a vector of the variables in the limit state equation. After a transformation of this equation we obtain the following function:
G(X ) = In(ξ ) _ In(D) −m* IN(K) − In[(σ1e)m + (σ2e)m ]− In(n) = 0 (9)
According to the theory of fatigue probabilities:
Pf= P[g (X) ≤0 ]
Where Pf is the conversation of fatigue. Because ξ, D and K are random variables which apply the lognormal distribution, therefore G (X) is subjected to a normal distribution. Thus, Pf is written:
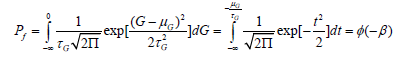 (11)
(11)Where μ: expectation of G, τ: standard deviation of G, t: (G − μG) /τG , φ : the probability density of the normal distribution, β: the safety index in the reliability analysis, the higher it is, the more robust the structure will be.
Results Analysis
In evaluating the fatigue strength of the prosthesis, the standard deviation and expectation of G were calculated as follows:
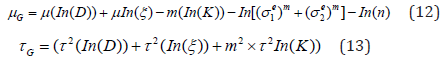
Where D, ξ and K are random variables.
The values of σ1r et σ2r are already calculated previously, so we find the expression of μG as a function of n:
β 2.478 − 0.153×ln(n) (14)
Figure 7, shows that the safety index of the prosthesis decreases with the number of running cycles. It can be noted that its variation follows the evolution of the endurance curve. Moreover, Figure 8 shows that the probability of failure by fatigue increases with the number of cycles of the stroke, while the slope of the curve decreases. The results indicate that the probability of occurrence of fatigue failure increases with the number of cycles of the stroke, whereas the rate of progression of the probability of fatigue failure decreases. Figure 8 also shows that the probability of fatigue failure tends to 0.9 when the number of cycles is greater than 9 × 10⁴. This indicates that the amputee should return to the prosthetist to inspect the structural integrity of the prosthesis and make any necessary replacement. This curve can also be used as a reference for prosthetists to determine the inspection interval for structural integrity. Moreover, the probability of fatigue failure is somewhat sensitive to the variation of the VOC of K, which indicates that the accuracy of the assessment of prosthesis fatigue depends a lot on the estimate of the stress level. Therefore, improving the precision of the finite element model is of paramount importance in assessing prosthesis life. It is important to note the limitation of the approach to assessing prosthesis fatigue resistance. Fatigue failure is a very complex phenomenon for composite materials, which can be formed by different failure modes [9]. Our study assumes that the rupture of the prosthesis occurs at the level of the third section. In addition, experimental validation is strongly requested to justify the various hypotheses used during this study.
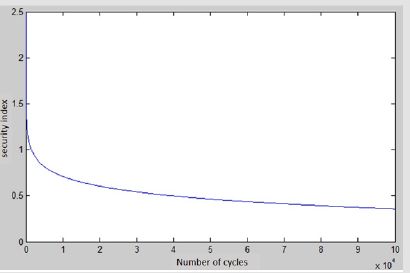
Figure 7: Safety index as a function of cycles.
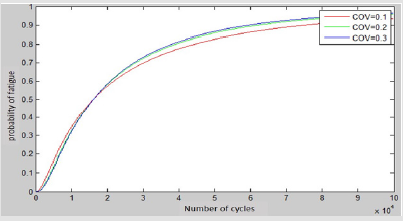
Figure 8: probability of prosthesis fatigue.
Conclusion
The aim of this study is to build an optimization model of a prosthesis designed for sports activities. The results obtained allowed a first estimate of the effects of the variation of certain parameters on the performance of the response of the component [10]. Regarding the verification and optimization carried out with the finite element software, it is possible to affirm that:
a) The study of the influence of the properties of the material
has shown that the most important characteristic of the stiffness
of the element is the modulus of elasticity in the direction of the
fibers, E1.
b) The lamination sequence exerts its influence mainly by the
number of unidirectional plies of the fibers used in the different
sections (for example, the total thickness of the laminate). The
sections that are most affected by the variation in thickness are
those located at the bottom of the curvature.
c) The simulation of the stroke by finite element modeling
generated a maximum displacement with respect to the ground
of about 46 mm. The peak-absorbed energy is slightly above 70
J and occurs at about 40% of the stance phase.
d) Miner’s law and reliability analysis were applied for the
assessment of fatigue for a prosthesis designed for transtibial
amputees. This study considers the modeling error of the finite
element analysis and the dispersion of the data from the fatigue
tests. Preliminary results give the relationship between the
probability of fatigue failure and the number of cycles, thus
giving prosthetics a benchmark to determine the inspection
interval. In addition, the results of the study further show
that the accuracy of the fatigue assessment of the prosthesis
depends very much on the accuracy of the stress estimation.
References
- Ali Cherif Messellek,Mohand Ould Ouali,Abdelwaheb Amrouche (2020) Adaptive finite element simulation of fretting wear and fatigue in a taper junction of modular hip prosthesis. Journal of the Mechanical Behavior of Biomedical Materials 111: 103993.
- Farley CT, González O (1996) Leg stiffness and stride frequency in human running. J Biomech 29: 181–186.
- Grabowski AM, McGowan CP, McDermott WJ, Beale MT, Kram R (2009) Running-specific prosthesis limit ground-force during sprinting. Biol Lett; 04 Nov 6(2): 201-204.
- Idris Saad, Solehuddin Shuib, Noriah Yusoff, Abdul Halim Abdullah, Mohd Hafiz Mohd Noh (2020) Influence of Dental Implant Design on Stress Distribution and Micromotion of Mandibular Bone. Applied Mechanics and Materials 899: 81-93.
- Katsunori Shimada, Jim Komotori, Masao Shimizu (1987)The Applicability of the Manson-Coffin Law and Miner's Law to Extremely Low Cycle Fatigue. Transactions of the Japan Society of Mechanical Engineers Series 53: 1178-1185.
- Kumar A, Karsan DI (1990) Fatigue reliability of parallel systems. J Strut Engng 116: 719-729.
- Lee WCC, Zhang M, Jia XH, Boone DA, Bill C (2004) Finite element analysis to determine the effect of monolimb flexibility on structural strength and interaction between residual limb and prosthetic socket. J Rehab Res Dev 4(6A): 775-786.
- Peter G Weyand, Matthew W Bundle, Craig P McGowan, Alena Grabowski (2009) The fastest runner on artificial legs: different limbs, similar function. 107(3) : 903-911.
- Yong Gon Koh, Jin Ah Lee, Paul Shinil Kim, Hyo Jeong Kim, Kiwon Kang (2020) Effects of the material properties of a focal knee articular prosthetic on the human knee joint using computational simulation. Journal of The Knee 27(5): 1484-1491.
- Wirsching PH (1984) Fatigue reliability for offshore structures. J Strut Engng 100(10): 2340-2356.
