 Research Article
Abstract
This studies aims to determine and compare the quality and purity of amoxicillin capsules available in local market as well as identifying the suitable analytical method for its analysis. Amoxicillin is the most commonly prescribed antibiotic in Malaysia. In this study, UV spectrophotometry and FTIR spectroscopy are the technique used for determination of amoxicillin tri-hydrate capsules. Ethanol and 0.1 N NaOH were used as solvent in UV spectrophotometric method. The absorbance was measured at λmax 272 nm for ethanol or 247 nm for 0.1 N NaOH. For FTIR technique, the analysis was conducted in absorbance and the spectra were obtained by Agilent MicroLab FTIR software. No sample preparation was required for the FTIR spectrometer. Using UV method, five out of six samples which are brand A, B, D, E and F complied with U.S.P. official limits (not less than 90.0 % and not more than 120.0 % of the labelled amount of amoxicillin) with percentage purity of 112.07 %, 111.97 %, 114.35 %, 118.02 %, and 119.20 % respectively. All FTIR spectra obtained for different samples of amoxicillin have the similar absorption bands with the FTIR spectrum of standard amoxicillin. The similarity between the spectra is a strong indicative of the identity of amoxicillin in all of the samples analysed using FTIR technique. The prominent characteristic peaks in the region 1800-1650 cm-1 was used to compare the amoxicillin standard and samples. For FTIR technique, brand A, B and E resemble the most to the standard. By comparing both methods, FTIR spectroscopy is a more accurate method as it allowed analysis of drug without being affected by the solvent. Nevertheless, UV spectroscopy is also a simple, low cost, reproducible and accurate method of analysis which is suitable for analysis of amoxicillin tri-hydrate in pharmaceutical formulations. In conclusion, UV spectrophotometry and FTIR techniques are comparable and suitable for routine analysis of amoxicillin tri-hydrate in capsules.
Keywords: Spectrophotometer; FTIR; Amoxicillin; Sodium Hydroxide; Agilent Microlab
Abbreviations:BRL: Beecham Research Laboratories, GSK: GlaxoSmithKline, PBP: Penicillin-Binding Protein, IR: Infrared Spectroscopy, UV: Ultraviolet, BP: British Pharmacopoeia
Introduction
Amoxicillin is currently one of the most widely used betalactam antibiotics worldwide. In the 1950s, the whole beta-lactam family of antibiotics only comprised of two antibiotics, penicillin G (parenterally administered) and penicillin V (orally administered) which have limited spectrum of activity [1]. The establishment and successful therapeutic use of these two antibiotics had built up the interest to develop improved versions of penicillin derivatives or beta-lactam derivatives by modifying the side chain of the molecule. In 1961, Beecham Research Laboratories (BRL) launched ampicillin which later successfully used to treat many bacterial infections. However, its use had been greatly substituted followed by the introduction of amoxicillin in 1970. Amoxicillin, which is a congener of ampicillin, provides similar broad-spectrum antibacterial activity of ampicillin but with the advantages of better oral absorption and achieving blood concentrations approximately twice as high as those obtained with ampicillin [2].
Amoxicillin has antibacterial activity against a wide range of
gram-positive and a limited range of gram-negative bacteria. It has
shown to be more effective against gram-positive bacteria than
gram-negative bacteria. In 1972, Amoxil, the generic amoxicillin
marketed by Beecham happen to become one of the most widely
prescribed antibiotics in the world. Amoxil was the original brand
name used by Beecham until Beecham merged with GlaxoSmithKline
(GSK) [3]. When the patency of amoxicillin has expired, various
brand names have come into the market around the world. In spite
of this, generic amoxicillin is still widely used in all over the world.
In fact, amoxicillin and amoxicillin/clavulanic acid are listed in the
access category in the 21st Model List of Essential Medicines 2019
by WHO. The access group of antibiotics are considered as first-line
or second-line treatment for common infections. They are essential
antibiotics that must be widely available, affordable and quality
assured [4].
Amoxicillin, belongs to beta-lactam antibiotic class, is
bactericidal antibiotic effective against gram-positive and some
gram-negative bacteria. It has similar mechanism of action as the
antibiotic class of beta-lactam. Bacterial cell wall is important to
maintain cell shape and integrity as well as to prevent cell lysis
due to extreme osmotic pressure. The bacterial cell wall is made
up of complex and cross-linked polymer of polysaccharides
and polypeptides, peptidoglycan. The peptidoglycan contains
two alternating amino sugars, N-acetyl-glucosamine and
N-acetylmuramic acid which are cross-linked by peptide chains [5].
Trans-peptidase is an enzyme responsible to form cross-linkage
between the adjacent peptide chains of the neighbouring strands to
provide stability and rigidity to the cell wall.
Amoxicillin acts against susceptible bacteria by inhibition of the
important trans-peptidation process of bacterial cell wall synthesis
during the bacterial multiplication. Amoxicillin, which has a similar
structural analogue of penicillin, binds covalently to the active
target site of Penicillin-Binding Protein (PBP) inside the cell wall,
inhibiting the trans-peptidase so that cross-linking process is
blocked. Besides, it also acylates the penicillin-sensitive transpeptidase
C-terminal domain by opening the beta-lactam ring and
thus inactivate the enzyme. This prevents the cross-linking reaction
between the two linear peptidoglycan strands and subsequently
inhibiting the third and last stage of bacterial cell wall synthesis,
which is essential for cell division and cell shape and other basic
processes. The cell lysis is then facilitated by a bacterial cell wall
autolytic enzyme such as autolysins [2-13]. The disrupted cell wall
synthesis causes the cell to swell and burst due to hyperosmotic
interior via osmosis.
In the presence of beta-lactam antibiotics, bacterial cells
continue to divide and grow in a cell wall deficient form. There are
various analytical methods reported in published studies for assay
of amoxicillin which includes Ultra Violet (UV) spectrophotometry,
high-performance liquid chromatography (HPLC) [14-16], thin
layer chromatography (TLC) [17-20], Capillary Electrophoresis
(CE) [17-21], colorimetry [22], titration [23] and Infrared
Spectroscopy (IR) [24,25]. In both British Pharmacopoeia (B.P.)
and United States Pharmacopoeia (U.S.P.), liquid chromatography
is recommended for the analysis of amoxicillin in pure forms and
pharmaceutical preparations. However, this method possesses
some disadvantages such as expensive equipment and analytical
columns, high maintenance cost and requires high expertise skills
to operate [26-40].
Methodology
In present studies, UV spectrophotometry and Fourier Transform Infrared spectrometry (FTIR) is used for analysis of amoxicillin tri-hydrate in capsule. UV spectroscopy is usually adopted by HPLC as a detector, giving rise to HPLC-UV method. Nevertheless, it is also sufficient to be used alone to determine a compound quantitatively by measuring the absorbance of the compound in its specific maximum absorbance wavelength. UV spectrophotometric method is used because of it is simple, specific, sensitive, convenience, economic, reproducible and time- saving. By comparing to HPLC, this method is simple without any sophisticated instruments, expertise operation skills, and also without the need of prior separation procedure. FTIR is another analytical method used for analysis of amoxicillin in this study. It is considered as a green analytical method which allows analysis of substances without using organic solvents. Highly potential toxic solvents for the operators and environment is eliminated. Moreover, this method excludes any prior extraction procedure of the sample and thus is suitable for substances with solubility problems [41-64].
Results
Weight Uniformity of Different Brands of Amoxicillin
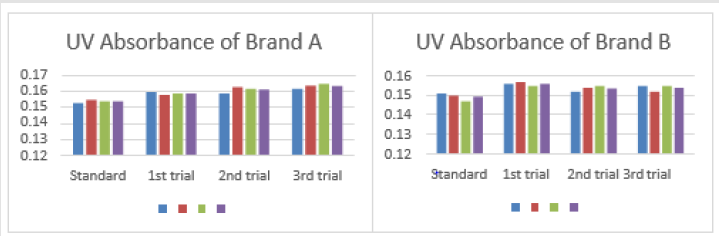
The average net weight of different brands of amoxicillin capsules are shown in Table 1. This table shows that brand D had the highest net weight (587.575mg) per capsule while brand C had the lowest net weight (310.34mg) per capsule. The average net weight for brand A, B, E and F were 586.85mg, 581.135mg 582.16 mg and 587.55 mg per capsule respectively. The uniformity of weight of amoxicillin capsules was shown in Tables 1-3. The first, second and third readings of standard amoxicillin were 0.153, 0.155 and 0.154. The average for standard was 0.154. There were total 3 trials conducted for assay of brand A and each trial had 3 readings. In first trial, the first, second and third readings were 0.160, 0.158 and 0.159. The average for first trial of brand A was 0.159. In second trial, the first, second and third readings were 0.159, 0.163 and 0.162. The average for second trial of brand A was 0.161. In third trial, the first, second and third readings were 0.162, 0.164 and 0.165.
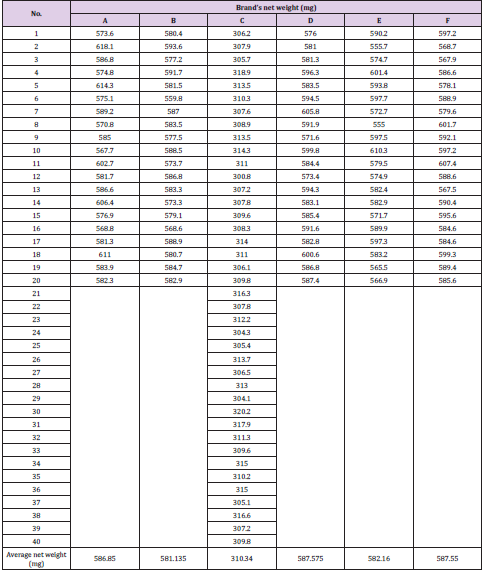
Table 1: Average net weight of different brands of Amoxicillin.
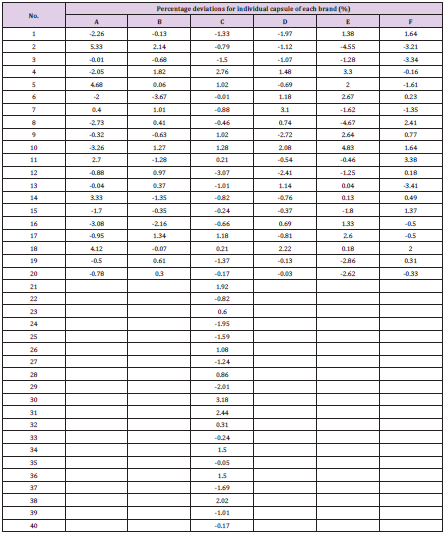
Table 2: Weight uniformity of different brands of Amoxicillin Capsules.
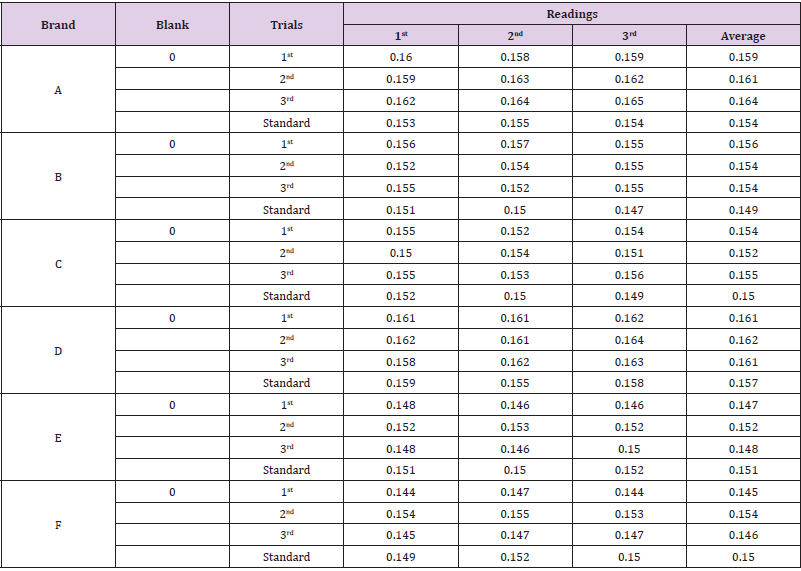
Table 3: Absorbance of different brands of Amoxicillin by using Ethanol as solvent.
The average for third trial of brand A was 0.164 as mentioned in Graph 1. The first, second and third readings of standard amoxicillin were 0.151, 0.150 and 0.147. The average for standard was 0.149. There were total 3 trials conducted for assay of brand B and each trial had 3 readings. In first trial, the first, second and third readings were 0.156, 0.157 and 0.155. The average for first trial of brand B was 0.156. In second trial, the first, second and third readings were 0.152, 0.154 and 0.155. The average for second trial of brand B was 0.154. In third trial, the first, second and third readings were 0.155, 0.152 and 0.155. The average for third trial of brand B was 0.154 as mentioned in Graph 2. The first, second and third readings of standard amoxicillin were 0.152, 0.150 and 0.149. The average for standard was 0.150. There were total 3 trials conducted for assay of brand C and each trial had 3 readings. In first trial, the first, second and third readings were 0.155, 0.152 and 0.154.
Graph 1: UV absorbance of Brand A.
Graph 2: UV absorbance of Brand B.
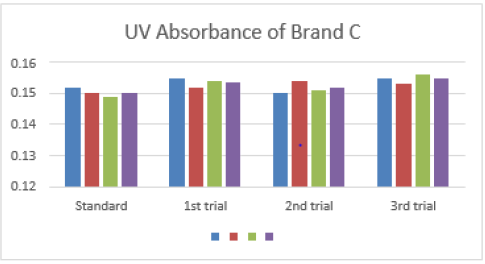
The average for first trial of brand C was 0.154. In second trial, the first, second and third readings were 0.150, 0.154 and 0.151. The average for second trial of brand C was 0.152. In third trial, the first, second and third readings were 0.155, 0.153 and 0.156. The average for third trial of brand C was 0.155 as mentioned in Graph 3. The first, second and third readings of standard amoxicillin were 0.159, 0.155 and 0.158. The average for standard was 0.157. There were total 3 trials conducted for assay of brand D and each trial had 3 readings. In first trial, the first, second and third readings were 0.161, 0.161 and 0.162. The average for first trial of brand D was 0.161. In second trial, the first, second and third readings were 0.162, 0.161 and 0.164. The average for second trial of brand D was 0.162. In third trial, the first, second and third readings were 0.158, 0.162 and 0.163. The average for third trial of brand D was 0.161 as mentioned in Graph 4.
Graph 3: UV absorbance of Brand A.
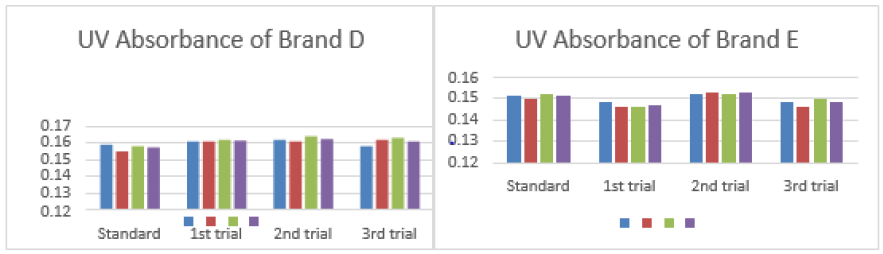
Graph 4: UV absorbance of Brand D.
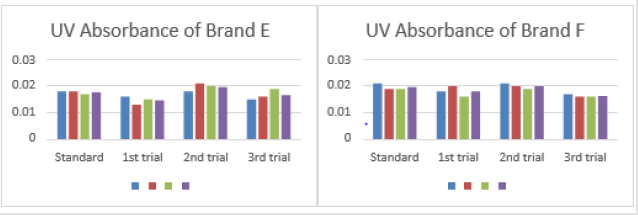
Graph 5: UV absorbance of Brand E.
The first, second and third readings of standard amoxicillin
were 0.151, 0.150 and 0.152. The average for standard was 0.151.
There were total 3 trials conducted for assay of brand E and each
trial had 3 readings. In first trial, the first, second and third readings
were 0.148, 0.146 and 0.146. The average for first trial of brand E
was 0.147. In second trial, the first, second and third readings were
0.152, 0.153 and 0.152. The average for second trial of brand E was
0.152. In third trial, the first, second and third readings were 0.148,
0.146 and 0.150. The average for third trial of brand E was 0.148
as mentioned in Graph 5. The first, second and third readings of
standard amoxicillin were 0.149, 0.152 and 0.150. The average for
standard was 0.150. There were total 3 trials conducted for assay of
brand F and each trial had 3 readings. In first trial, the first, second
and third readings were 0.144, 0.147 and 0.144.
The average for first trial of brand F was 0.145. In second trial,
the first, second and third readings were 0.154, 0.155 and 0.153.
The average for second trial of brand F was 0.154. In third trial,
the first, second and third readings were 0.145, 0.147 and 0.147.
The average for third trial of brand F was 0.146 as mentioned in
Graph 6. The Percentage Purity of different brands of Amoxicillin by
using Ethanol as solvent is shown in Tables 4-6. Percentage purity
determination of different brands of amoxicillin capsules using
ethanol as solvent by UV spectrophotometric method was tabulated
in Table 4. The percentage purity of standard amoxicillin was 98 %.
There were total 3 trials conducted for each assay of sample. The
percentage purity of first, second and third trials of brand A were
113.69 %, 112.28 % and 110.23 %. The average percentage purity
of brand A was 112.07 %. The percentage purity of first, second and
third trials of brand B were 111.01 %, 112.45 % and 112.45 %. The
average percentage purity of brand B was 111.97 %.
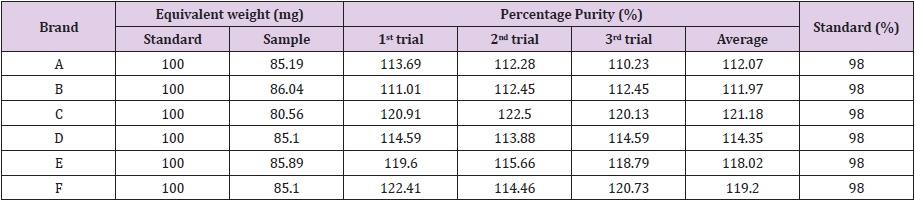
Table 4: Percentage purity determination of different brands of Amoxicillin capsules using ethanol as solvent by UV spectrophotometric method.
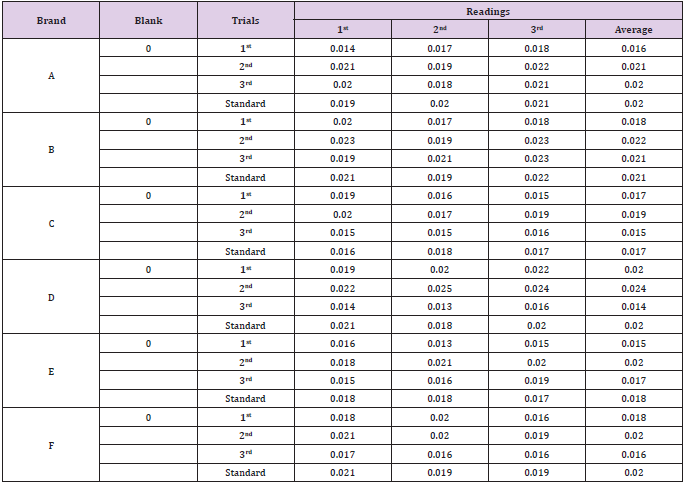
Table 5: Absorbance of different brands of Amoxicillin by using NaOH as solvent.
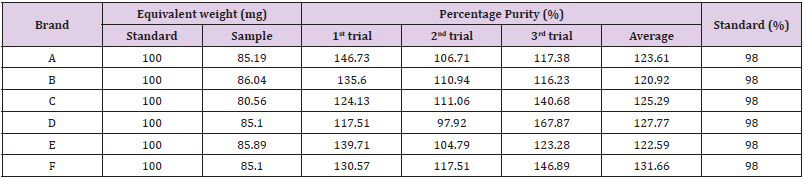
Table 6: Percentage purity determination of different brands of Amoxicillin capsules using NaOH as solvent by UV spectrophotometric method.
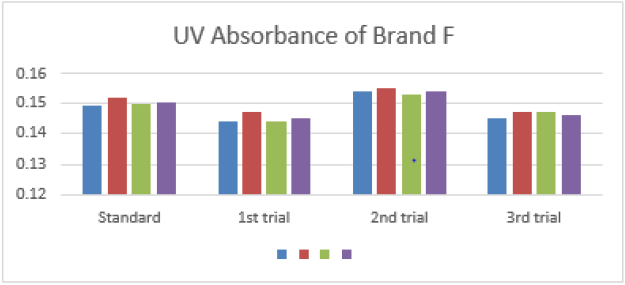
Figure 6: UV absorbance of Brand F.
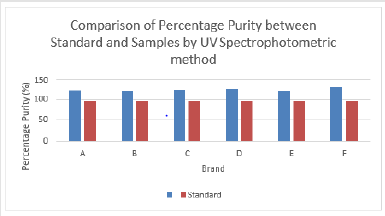
The percentage purity of first, second and third trials of brand C were 120.91 %, 122.50 % and 120.13 %. The average percentage purity of brand C was 121.18 %. The percentage purity of first, second and third trials of brand D were 114.59 %, 113.88 % and 114.59 %. The average percentage purity of brand D was 114.35 %. The percentage purity of first, second and third trials of brand E were 119.60 %, 115.66 % and 118.79 %. The average percentage purity of brand E was 118.02 %. The percentage purity of first, second and third trials of brand F were 122.41 %, 114.46 % and 120.73 %. The average percentage purity of brand F was 119.20 %. Comparison of percentage purity between standard and sample by using UV Spectrophotometric method was recorded in Graph 7. The percentage purity of standard amoxicillin was 98 %. Besides, the average percent purity of brand A, B, C, D, E, and F were 112.07 %, 111.97 %, 121.18 %, 114.35 %, 118.02 %, and 119.20 %. According to Graph 4.7, brand B had the most similar percentage purity with standard amoxicillin while brand C had the most different percentage purity with standard amoxicillin.
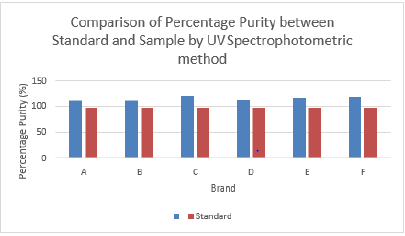
Figure 7: Comparison of percentage purity of Amoxicillin between Standard and Sample by using UV Spectrophotometric method.
According to British Pharmacopoeia (BP), the percent purity of
amoxicillin in capsules should be in the range of 92.5 % to 110.0 %.
Thus, none of the brand passed the test. While according to United
States Pharmacopeia (USP), amoxicillin capsules should contain
not less than 90.0 % and not more than 120.0 % of the labelled
amount of amoxicillin. Thus, brand A, B, D, E and F passed the test.
Only brand C failed the test. The first, second and third readings of
standard amoxicillin were 0.019, 0.020 and 0.021. The average for
standard was 0.020. There were total 3 trials conducted for assay of
brand A and each trial had 3 readings. In first trial, the first, second
and third readings were 0.014, 0.017 and 0.018. The average for
first trial of brand A was 0.016. In second trial, the first, second and
third readings were 0.021, 0.019 and 0.022. The average for second
trial of brand A was 0.021. In third trial, the first, second and third
readings were 0.020, 0.018 and 0.021. The average for third trial of
brand A was 0.020 as mentioned in Graph 4.8. The first, second and
third readings of standard amoxicillin were 0.021, 0.019 and 0.022.
The average for standard was 0.021. There were total 3 trials
conducted for assay of brand B and each trial had 3 readings. In
first trial, the first, second and third readings were 0.020, 0.017 and
0.018. The average for first trial of brand B was 0.018. In second trial,
the first, second and third readings were 0.023, 0.019 and 0.023. The average for second trial of brand B was 0.022. In third trial, the
first, second and third readings were 0.019, 0.021 and 0.023. The
average for third trial of brand B was 0.021 as mentioned in Graphs
8 & 9. The first, second and third readings of standard amoxicillin
were 0.016, 0.018 and 0.017. The average for standard was 0.017.
There were total 3 trials conducted for assay of brand C and each
trial had 3 readings. In first trial, the first, second and third readings
were 0.019, 0.016 and 0.015. The average for first trial of brand C
was 0.017. In second trial, the first, second and third readings were
0.020, 0.017 and 0.019.

Graph 8: UV absorbance of Brand A.
Graph 9: UV absorbance of Brand B.
The average for second trial of brand C was 0.019. In third trial, the first, second and third readings were 0.015, 0.015 and 0.016. The average for third trial of brand C was 0.015 as mentioned in Graph 10. The first, second and third readings of standard amoxicillin were 0.021, 0.018 and 0.020. The average for standard was 0.020. There were total 3 trials conducted for assay of brand D and each trial had 3 readings. In first trial, the first, second and third readings were 0.019, 0.020 and 0.022. The average for first trial of brand D was 0.020. In second trial, the first, second and third readings were 0.022, 0.025 and 0.024. The average for second trial of brand D was 0.024. In third trial, the first, second and third readings were 0.014, 0.013 and 0.016. The average for third trial of brand D was 0.014 as mentioned in Graph 11. The first, second and third readings of standard amoxicillin were 0.018, 0.018 and 0.017. The average for standard was 0.018. There were total 3 trials conducted for assay of brand E and each trial had 3 readings. In first trial, the first, second and third readings were 0.016, 0.013 and 0.015.
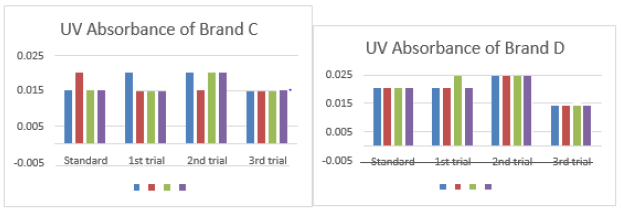
Graph 10: UV absorbance of Brand C.
Graph 11: UV absorbance of Brand D.
The average for first trial of brand E was 0.018. In second trial, the first, second and third readings were 0.018, 0.021 and 0.020. The average for second trial of brand E was 0.020. In third trial, the first, second and third readings were 0.015, 0.016 and 0.019. The average for third trial of brand E was 0.017 as mentioned in Graph 12. The first, second and third readings of standard amoxicillin were 0.021, 0.019 and 0.019. The average for standard was 0.020. There were total 3 trials conducted for assay of brand F and each trial had 3 readings. In first trial, the first, second and third readings were 0.018, 0.020 and 0.016. The average for first trial of brand F was 0.018. In second trial, the first, second and third readings were 0.021, 0.020 and 0.019.
Graph 12: UV absorbance of Brand E.
Graph 13: UV absorbance of Brand F.
The average for second trial of brand F was 0.020. In third trial, the first, second and third readings were 0.017, 0.016 and 0.016. The average for third trial of brand F was 0.016 as mentioned in Graph 13. The percentage purity of standard amoxicillin was 98 %. There were total 3 trials conducted for each assay of sample. The percentage purity of first, second and third trials of brand A were 146.73 %, 106.71 % and 117.38%. The average percentage purity of brand A was 123.61 %. The percentage purity of first, second and third trials of brand B were 135.60 %, 110.94 % and 116.23 %. The average percentage purity of brand B was 120.92 %. The percentage purity of first, second and third trials of brand C were 124.13 %, 111.06 % and 140.68%. The average percentage purity of brand C was 125.29 %. The percentage purity of first, second and third trials of brand D were 117.51 %, 97.92 % and 167.87 %. The average percentage purity of brand D was 127.77 %. The percentage purity of first, second and third trials of brand E were 139.71 %, 104.79 % and 123.28 %. The average percentage purity of brand E was 122.59 %. The percentage purity of first, second and third trials of brand F were 130.57 %, 117.51 % and 146.89 %. The average percentage purity of brand F was 131.66 % Comparison of percentage purity between standard and sample using NaOH as solvent by UV Spectrophotometric method was recorded in Graph 14. The percentage purity of standard amoxicillin was 98 %. Besides, the average percentage purity of brand A, B, C, D, E, and F were 123.61 %, 120.92 %, 125.29 %, 127.77 %, 122.59 %, and 131.66 %. According to Graph 4.14, brand B had the most similar percentage purity with standard amoxicillin while brand F had the most different percentage purity with standard amoxicillin.
Graph 14: Comparison of percentage purity between standard and sample using NaOH as solvent by UV Spectrophotometric method.
According to British Pharmacopoeia (BP), the percent purity of amoxicillin in capsules should be in the range of 92.5 % to 110.0 %. Thus, no brand passed the test. While according to United States Pharmacopeia (USP), amoxicillin capsules should contain not less than 90.0 % and not more than 120.0 % of the labelled amount of amoxicillin. Thus, no brand passed the test. Comparison of percentage purity of amoxicillin between ethanol and NaOH as solvent by UV spectrophotometric method was shown in Graph 4.15. The percentage purity of standard amoxicillin was 98 %. The average percent purity of brand A, B, C, D, E, and F by using ethanol as solvent were found to be 112.07 %, 111.97 %, 121.18 %, 114.35 %, 118.02 %, and 119.20 %. Besides, the average percentage purity of brand A, B, C, D, E, and F by using NaOH as solvent were found to be 123.61 %, 120.92 %, 125.29 %, 127.77 %, 122.59 %, and 131.66 %.
According to Graph 15, brand C had the most similar percentage purity between ethanol and NaOH as solvent by UV spectrophotometric method while brand F had the most different percentage purity calculated between ethanol and sodium hydroxide as solvent by UV spectrophotometric method. Graph 16 shows percentage purity of amoxicillin with standard using ethanol and NaOH as solvent by UV spectrophotometric method. The percentage purity of standard amoxicillin was 98 %. The average percentage purity of brand A, B, C, D, E and F using ethanol as solvent by UV spectrophotometry, were 112.07 %, 111.97 %, 121.18 %, 114.35 %, 118.02 %, and 119.20 %. Besides, the average percentage purity of brand A, B, C, D, E and F using NaOH as solvent by UV spectrophotometry were 123.61 %, 120.92 %, 125.29 %, 127.77 %, 122.59 %, and 131.66 %.
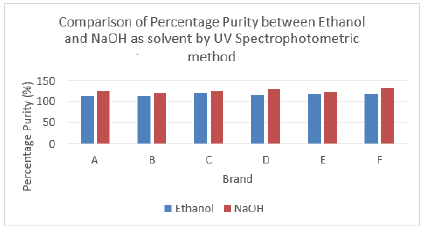
Graph 15: Comparison of percentage purity between Ethanol and NaOH as solvent by UV Spectrophotometric method.
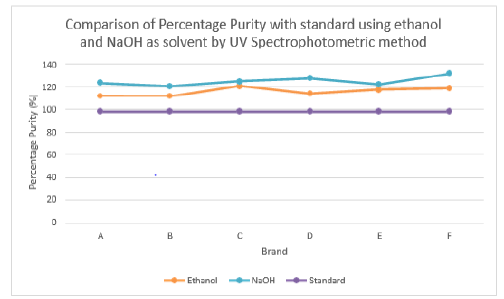
Graph 16:Percentage purity of amoxicillin capsules with standard using ethanol and NaOH as solvent by UV spectrophotometric method.
According to Graph 4.16, brand B had the most similar results
with standard, while brand F had the most different results from
standard. Graph 4.16 has shown that most of the percentage purity
of amoxicillin using ethanol as solvent were within the official
limits while most of the percentage purity of amoxicillin using
NaOH as solvent failed to meet the official limit. Figures 1-7 show
the FTIR spectra of amoxicillin standard and brand A, B, C, D, E and
F respectively. In the region 3600-3400cm-1, the two small bands
were assigned to water of crystallisation OH stretch and amide
-NH stretching. The bands in the region between 3200-3000 cm-1
represented phenol -OH stretching and aromatic -CH stretching.
The peak below 3000cm-1 was assigned to methyl -CH stretching.
The prominent characteristic bands in between 1800-1650cm-1
indicates the carbonyl (-C=O) in beta-lactam ring and amide.
The sets of bands in the region around 1600cm-1 and the other
around 1500cm-1 were consistent with aromatic ring, which was
assigned to C=C stretching. Multiple bands in the region 1150-
950 cm-1 represented the typical in-plane CH bending vibrations
of aromatic compounds. Between 3200cm-1 and 2800cm-1 and
between 1800cm-1 and 1000cm-1 wave numbers, variations at transmission spectroscopy data were noted. Alkenyl (-C=C-),
amide (-NH), carbonyl (-C=O), phenolic (-OH) stretches are mainly
responsible for those regions. This suggests that there may be
physical interactions related to the formation of weak to medium
intensity bonding since no major shifting of peaks was noted.
Comparison of FTIR Spectrum Between Amoxicillin Standard and Samples
FTIR spectrum of pure amoxicillin tri-hydrate shows that all the characteristic peaks of Amoxicillin tri-hydrate are present. The spectra of amoxicillin standard and amoxicillin samples were compared based on Figures 1-7. It was observed that all FTIR spectra obtained for different samples of amoxicillin have the similar absorption bands with the FTIR spectrum of standard amoxicillin. The similarity between the spectra is a strong indicative of the identity of amoxicillin in all of the samples analysed using FTIR technique. Besides, the intensity (absorbance) of the peaks in the spectra was observed and compared between the standard and samples. The characteristic strong peaks observed between 1800- 1650cm-1 in the FTIR spectrum of standard amoxicillin and samples amoxicillin indicates the carbonyl (-C=O) in beta- lactam ring and amide group. The prominent characteristic peaks in the region 1800-1650cm-1 was used to compare the amoxicillin standard and samples. By comparing the intensity of characteristic peaks in this region, it was observed that the characteristic peaks of brand A, B and E resemble the most to the standard while brand D was the most different from standard.
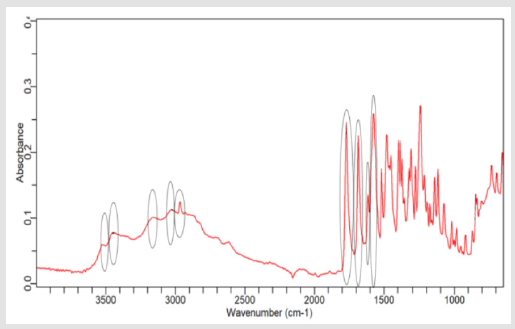
Figure 1: FTIR spectrum of amoxicillin standard.
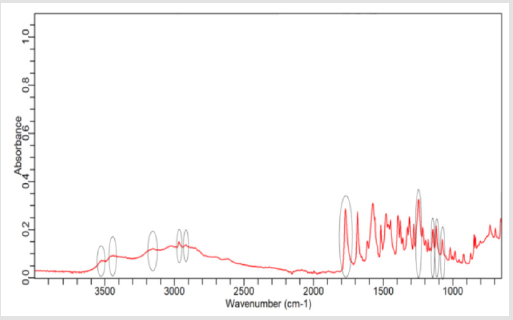
Figure 2:FTIR spectrum of amoxicillin Brand A.
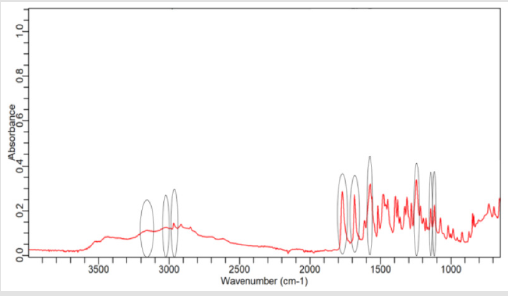
Figure 3: FTIR spectrum of amoxicillin Brand B.
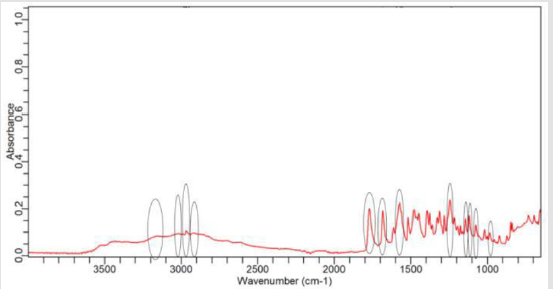
Figure 4: FTIR spectrum of amoxicillin Brand C.
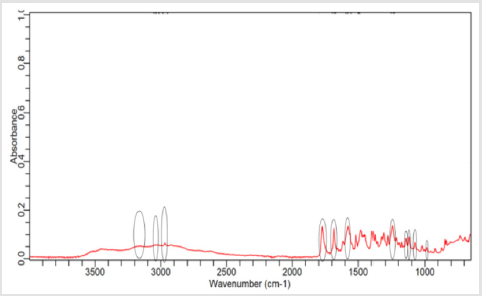
Figure 5: FTIR spectrum of amoxicillin Brand D.
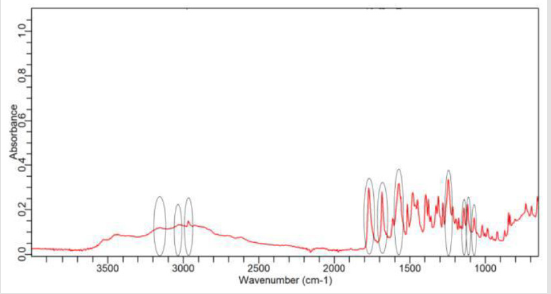
Figure 6: FTIR spectrum of amoxicillin Brand E.
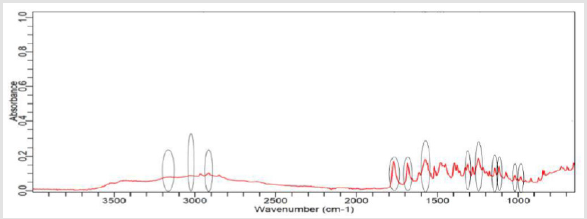
Figure 7:FTIR spectrum of amoxicillin Brand F.
Discussion
The objective of this study was to determine the quality and
purity of amoxicillin tri-hydrate capsules brands available in local
Malaysian market by using UV spectrophotometric and FTIR
techniques. For this purpose, six different commercially available
brands of amoxicillin tri- hydrate capsules were obtained from
various community pharmacies in Kedah, Malaysia and then were
subjected to UV assay and FTIR analysis. The UV spectrophotometric
method depends on the measurement of the absorbance of drug
at lmax 272nm and 247nm in ethanol and 0.1N NaOH, respectively.
For FTIR technique, the analysis was conducted in absorbance
and the spectra were obtained by Agilent MicroLab FTIR software.
No sample preparation was required for the FTIR spectrometer.
A comparison of the spectra obtained from standard amoxicillin
and six amoxicillin capsule brands was performed to verify the
similarity between them.
The prominent characteristic band of amoxicillin molecule
(carbonyl) was compared specifically to determine which
amoxicillin capsules brand was the most resemble to standard
amoxicillin. In this part, the results and findings of the present
study will be interpreted and discussed. From results in section,
it was noticed that the uniformity of weight determination for all
the brands showed compliance with the B.P. specification, as none
of the brands deviated by up to ± 7.5% from their mean values.
Thus, all amoxicillin capsules had uniform weights. According
to British Pharmacopoeia (B.P.), the percent purity of amoxicillin
in capsules should be in the range of 92.5 % to 110.0 %. None of
the brands passed when using both ethanol and NaOH as solvent.
While according to United States Pharmacopeia (U.S.P.), amoxicillin
capsules should contain not less than 90.0 % and not more than
120.0 % of the labelled amount of amoxicillin. As using ethanol,
brand A, B, C, D, E and F passed the test. Only brand C failed the test.
On the other hand, none of the brand passed the test while using
NaOH as solvent.
To conclude, five out of six samples which were brand A, B,
D, E and F complied with U.S.P. official limits with percentage
purity of 112.07 %, 111.97 %, 114.35 %, 118.02 %, and 119.20 %
respectively. The results show all of the samples failed to meet the official limits when using NaOH as solvent. This is most probably
due to hygroscopicity of NaOH. Solid NaOH is very hygroscopic.
It can absorb the atmospheric moisture so rapidly that the
concentration of the prepared solution is usually changes over time.
Besides, it also reacts with carbon dioxide from the air and forms
water-soluble salt sodium carbonate and thus reducing the amount
of sodium hydroxide. Therefore, the drug powder cannot dissolve
properly in the reduced amount of sodium hydroxide. This concern
is actually reflecting in the absorbance readings. The absorbances
using NaOH was observed to be lower than that of using ethanol. To
eliminate this problem, the solution of NaOH has to be standardized
to know the exact concentration and only prepared when needed
to keep it as fresh as possible. Capsule is considered as a protective
layer for the drug content.
Once the drug content is removed from the capsule, it has been exposed to the atmosphere and become extremely sensitive to temperature, light and humidity. Due to unforeseen and unpredictable pandemic COVID-19, it takes few months for our experiment to resume as normal. To mention, all amoxicillin samples used during the experiment using NaOH as solvent and FTIR have been removed from their capsules and store in a desiccator for a few months due to COVID-19. Although the samples had been stored well in a plastic zipper bag and placed in a desiccator, the results showed the stability of samples might be slightly affected in the consideration of the factor of solvent NaOH. Factors such as light, temperature and humidity may cause significant drug degradation and thereby affect its label content and purity.
The use of FTIR in this study has advantages of analysing substances without organic solvents. Therefore, solubility problems can be eliminated since drug can be analysed in solid form. Besides, consideration regarding the solvent can be ruled out. Infrared spectrophotometry is based on the fact that the chemical bonds of the molecules have natural vibrational frequencies. Each molecule only absorbs selected frequencies of radiation in the infrared region, which are equivalent to its natural vibrational frequencies. This absorption increases the amplitude of vibrational motion of chemical bonds. Therefore, the frequency of vibration may be associated with a particular type of the band. On top of absence of organic solvents, this is a rapid technique which does not require a pre-treatment of the sample. Based on the observation of the spectra obtained with amoxicillin standard and amoxicillin samples, it was found that the spectra have similar absorption bands which indicating the presence of specific functional group in amoxicillin. In the region 3600 -3400cm-1, the two small bands were assigned to water of crystallisation OH stretch and amide -NH stretching.
The bands in the region between 3200-3000cm-1 represented phenol -OH stretching and aromatic -CH stretching. The peak below 3000cm-1 was assigned to methyl -CH stretching. The prominent characteristic bands in between 1800-1650cm-1 indicates the carbonyl (-C=O) in beta-lactam ring and amide. The sets of bands in the region around 1600cm-1 and the other around 1500cm- 1 were consistent with aromatic ring, which was assigned to C=C stretching. Multiple bands in the region 1150-950cm-1 represented the typical in-plane CH bending vibrations of aromatic compounds. The similarity between the spectra is a strong indicative of the identity of amoxicillin in all of the samples analysed using FTIR technique. The key indicator of the similarity is the two absorption peaks in region 1800-1650cm-1 which implies carbonyl (-C=O) in beta-lactam ring and amide of amoxicillin. Thus, the active ingredient amoxicillin was identified as present in all of the samples with respect to the standard. Besides, the intensity (absorbance) of the peaks in the spectra was observed and compared between the standard and samples.
The prominent characteristic peaks in the region 1800-1650cm- 1was used to compare the amoxicillin standard and samples. By comparing the intensity of characteristic peaks in this region, it was observed that the characteristic peaks of brand A, B and E resemble the most to the standard while brand D was the most different from standard. Based on the spectrum, it was observed that brand D had weaker peaks compared to other samples. This indicates brand D has weaker vibrational frequencies of the chemical bonds in its functional groups. In addition, this may be due to degradation which causes reduced amount of active ingredient in the sample. Hence, the intensity of peaks was reduced due to lesser amount of amoxicillin compared to standard. Five out of six samples (brand A, B, D, E and F) complied with official limits by UV spectrophotometric method while only three samples (brand A, B and E) show similar spectra with standard amoxicillin by FTIR spectroscopy.
Based on the results of two methods, FTIR spectroscopy is a more sensitive and reliable method as it was not affected by the solvent. Nevertheless, without the effect of solvent, UV spectroscopy is also a simple, low cost, reproducible and accurate method which is suitable for analysis of amoxicillin trihydrate in pharmaceutical formulations. There are several possible limitations in this study which can be improved in future study. First, there is a lack of prior research for analysis of amoxicillin using FTIR. Thus, there is a need of further research to assess the quality of amoxicillin using FTIR. Unfortunately, on hold of research due to COVID-19 had limited our time to collect data. A more reliable and advance data collection method may require in future research in view of unforeseen circumstances. Moreover, the developed method in this study require validation in future study in order to verify the analytical method for routine quality control test on marketed pharmaceutical formulation.
Acknowledgement
Authors are highly thankful to the Faculty of Pharmacy, AIMST University for providing financial assistance and laboratory facilities to carry out this research work.
References
- Geddes A.M, Klugman KP, Rolinson GN (2007) Introduction: historical perspective and development of amoxicillin / clavulanate. Inte. Journal of antimicrobial agents 30: 109-112.
- Kaur SP, Rao R, Nanda S (2011) Amoxicillin: a broad-spectrum antibiotic. Int J Pharm Sci 3(3): 30-37.
- Roy J (2011) An introduction to pharmaceutical sciences: Production, chemistry, techniques and technology.
- (2019) World Health Organization. WHO model list of essential medicines?
- Katzung BG, Masters SB, Trevor AJ (2012) Basic and clinical pharmacology, 12th (edn) New York: McGraw-Hill Medical pp. 792-793.
- Brunton LL, Chabner BA, Knollmann BC (2011) editors. Goodman and Gilman’s pharmacological basis of therapeutics. 12th New York: McGraw-Hill Medical pp. 1478-1481.
- Chow AW, Benninger MS, Brook I, Brozek JL, Goldstein EJ, et al. (2012) IDSA clinical practice guideline for acute bacterial rhinosinusitis in children and adults. Clinical infectious diseases 54(8): e72-112.
- Hendricks KA, Wright ME, Shadomy SV, Bradley JS, Morrow MG, et al. (2104) Centers for disease control and prevention expert panel meetings on prevention and treatment of anthrax in adults. Emerging infectious diseases 20(2): e130687.
- White AR, Kaye C, Poupard J, Pypstra R, Woodnutt G, et al. (2004) Augmentin (amoxicillin/ clavulanate) in the treatment of community-acquired respiratory tract infection: a review of the continuing development of an innovative antimicrobial agent. Journal of Antimicrobial Chemotherapy 53: i3-i20.
- (2015) FDA. AMOXIL (amoxicillin) capsules, tablets, or powder for oral suspension.
- Williams, David A, Thomas L (2012) Lemke. Foye's principles of medicinal chemistry.
- Thambavita D, Galappatthy P, Mannapperuma U, Jayakody L, Cristofoletti R, et al. (2017) Biowaiver monograph for immediate-release solid oral dosage forms: amoxicillin trihydrate. Journal of Pharmaceutical Sciences 106(10): 2930-2945.
- (2017) Promoting the Quality of Medicines (PQM). Product Information Report: Amoxicillin.
- S. Pharmacopeial Convention. Rockville, Maryland.
- Ünal K, Palabıyık İM, Karacan E, Onur F (2008) Spectrophotometric determination of amoxicillin in pharmaceutical formulations. Turk J. Pharm. Sci 5(1): 1-6.
- Qader HA, Fakhre NA (2017) Spectrophotometric determination of amoxicillin trihydrate in pure and pharmaceutical dosage forms. Ibn AL-Haitham Journal of Pure and Applied Science 28(3): 142-153.
- Sani AA, Maidugu HG, Ilyas M (2014) comparative quantitative study of different brands of amoxicillin (500mg) tablet marketed in Maiduguri Metropolis, Nigeria.
- Indrayanto G, Sa TK, Widjaja S (2000) Simultaneous determination of amoxycillin trihydrate and clavulanate potassium in pharmaceutical preparations by thin-layer chromatography/densitometry. Journal of AOAC International 83(6): 1493-1496.
- Eissa MS, Darweish E, Elghobashy MR, Shehata MA (2018) Rapid Selective TLC-Densitometry Method for Simultaneous Determination of Amoxicillin and Flucloxacillin in their Pure Forms or in their Pharmaceutical Preparation. Anal Chem Lett 8(2): 188-194.
- Hancu G, Simon B, Kelemen H, Rusu A, Mircia E (2013) Thin layer chromatographic analysis of Beta-lactam antibiotics. Advanced pharmaceutical bulletin 3(2): 367-371.
- Petkova V, Tsvetkova DD, Obreshkova DP, Dimitrov M, Papanov S (2014) Validation of TLC – densitometric method for quality control of amoxicillin in dosage drug products. World J Pharm Pharm Sci 3(5): 15.
- Hancu G, Neacşu A, Papp LA, Ciurba A, Hancu G, et al. (2016) Simultaneous determination of amoxicillin and clavulanic acid in pharmaceutical preparations by capillary zone electrophoresis. Braz J Pharm Sci 52(2): 281-286.
- Al kadumi AS, Fadhel SR, Ahmed MA, Musa LA (2019) Colorimetric Determination of Amoxicillin in Pure and some Pharmaceutical Formulations via Reaction with Potassium Permanganate as Oxidant Reagent. Int. J. of Pharma. Quality Assurance 10(2): 222-228.
- Cruz JC, Nascimento MA, Teixeira AM, Oliveira AF, Lopes RP (2018) Development of a method for the determination of amoxicillin in capsules by potentiometric titration. The Journal of Engineering and Exact Sciences 4(2): 0234-0239.
- Khan AN, Khar RK, Ajayakumar PV (2016) Diffuse reflectance near infrared-chemometric methods development and validation of amoxicillin capsule formulations. J Pharma Bioallied sciences 8(2): 152.
- Alotaibi N, Overton S, Curtis S, Nickerson JW, Attaran A, et al. (2018) Toward Point-of-Care Drug Quality Assurance in Developing Countries: Comparison of Liquid Chromatography and Infrared Spectroscopy Quantitation of a Small-Scale Random Sample of Amoxicillin. Am J Trop Med Hyg 99(2): 477-481.
- Kelesidis T, Falagas ME (2015) Substandard/counterfeit antimicrobial drugs. Clinical microbiology reviews 28(2): 443-464.
- Ghanem N (2019) Substandard and falsified medicines: Global and local efforts to address a growing problem. Evaluation 14(47): 19.
- Ünal K, Palabiyik IM, Karacan E, Onur F (2008) Spectrophotometric determination of amoxicillin in pharmaceutical formulations. Turk J Pharm Sci 5(1): 1-6.
- Gujral RS, Haque SM (2010) Simultaneous determination of potassium clavulanate and amoxicillin trihydrate in bulk, pharmaceutical formulations and in human urine samples by UV spectrophotometry. International Journal of Biomedical Science: IJBS 6(4): 335.
- Vu DH, Do TG (2010) Comparative study of RP-HPLC and UV spectrophotometric techniques for the simultaneous determination of amoxicillin and cloxacillin in capsules. Journal of Young Pharmacists 2(2): 190-195.
- Mikre W, Mekonnen N (2011) Assessment on the quality and influence of tropical storage conditions on amoxicillin formulations marketed in Ethiopia. The East and Central African Journal of Pharmaceutical Sciences 14(1): 23-32.
- Müller AL, Flores ÉM, Müller EI, Silva FE, Ferrão MF (2011) Attenuated total reflectance with Fourier transform infrared spectroscopy (ATR/FTIR) and different PLS Algorithms for simultaneous determination of clavulanic acid and amoxicillin in powder pharmaceutical formulation. Journal of the Brazilian Chemical Society 22(10): 1903-1912.
- Al Uzri WA (2012) Spectrophotometric determination of amoxicillin in pharmaceutical preparations through diazotization and coupling reaction. Iraqi Journal of Science 53(4): 713-723.
- Tótoli EG, Salgado HR (2012) Development and validation of the quantitative analysis of ampicillin sodium in powder for injection by Fourier-transform infrared spectroscopy (FT-IR). Physical Chemistry 2(6): 103-108.
- Pandey S, Pandey P, Tiwari G, Tiwari R, Rai AK (2012) FTIR spectroscopy: A tool for quantitative analysis of ciprofloxacin in tablets. Indian Journal of Pharmaceutical Sciences 74(1): 86.
- Sani AA, Maidugu HG, Ilyas M (2014) Comparative Quantitative Study of Different Brands Of Amoxicillin (500mg) Tablet Marketed In Maiduguri Metropolis, Nigeria. Journal of Natural Sciences Research 4(24).
- Tripathi GK, Singh S, Gupta M (2014) UV Spectroscopy technique for analysis of amoxicillin trihydrate in pH stimuli sensitive formulation. Der Pharma Sin 5(1): 29-33.
- Choundikar MY, Nitave SA, Katageri AR (2015) Calibration curve of amoxicillin trihydrate in different solvents. World Journal of Pharmacy and Pharmaceutical Sciences 4(2): 286-293.
- Qader HA, Fakhre NA (2017) Spectrophotometric determination of amoxicillin trihydrate in pure and pharmaceutical dosage forms. Ibn AL-Haitham Journal of Pure and Applied Science 28(3):142-53.
- Haidar OI (2015) Simple indirect spectrophotometric determination of amoxicillin in pharmaceutical preparations. J of Nat Sci Res 5(16): 142-147.
- Fadeyi I, Lalani M, Mailk N, Van Wyk A, Kaur H (2015) Quality of the antibiotics amoxicillin and co-trimoxazole from Ghana, Nigeria, and the United Kingdom. The American journal of tropical medicine and hygiene 92: 87-94.
- Othman NS, AL Saffar RS (2015) Spectrophotometric determination of amoxicillin in pharmaceutical preparations. International Journal of Enhanced Research in Science Technology and Engineering 4(6): 167-173.
- Mallah MA, Sherazi ST, Bhanger MI, Mahesar SA, Bajeer MA (2015) A rapid Fourier-transform infrared (FTIR) spectroscopic method for direct quantification of paracetamol content in solid pharmaceutical formulations. Spectrochimica Acta Part A: Molecular and Biomolecular Spectroscopy 141: 64-70.
- Hancu G, Neacşu A, Papp LA, Ciurba A (2016) Simultaneous determination of amoxicillin and clavulanic acid in pharmaceutical preparations by capillary zone electrophoresis. Brazilian Journal of Pharmaceutical Sciences 52(2): 281-286.
- Eissa MS, Darweish E, Elghobashy MR, Shehata MA (2016) UV spectrophotometric methods for the simultaneous determination of Amoxicillin and Flucloxacillin. Al-Azhar Journal of Pharmaceutical Sciences 54(1): 174-187.
- Marco BA, Salgado HN (2016) Development and validation of an innovative method for the determination of cefadroxil monohydrate in capsules. Physical Chemistry 6(3): 67-74.
- Kogawa AC, de Mello N, Salgado HR (2016) Quantification of doxycycline in raw material by an eco- friendly method of infrared spectroscopy. Pharmaceutica Analytica Acta 7(2): 463-466.
- Shailesh W, Tukaram K, Shivraj S, Sima L, Supriya K (2017) Development and Validation of Stability Indicating UV Spectrophotometric Method for Simultaneous Estimation of Amoxicillin Trihydrate And Metronidazole in Bulk and In-House Tablet. World Journal of Pharmaceutical and Medical Research 3(8): 312-318.
- Rele RV (2017) Assay of amoxicillin trihydrate and bromohexine hydrochloride by UV- spectrophotometric third order derivative method in combined dosage form. Res J Pharmaceutical Sci June 6(4): 1-5.
- Eissa MS, Darweish E, Elghobashy MR, Shehata MA (2018) Rapid Selective TLC-Densitometry Method for Simultaneous Determination of Amoxicillin and Flucloxacillin in their Pure Forms or in their Pharmaceutical Preparation. Analytical Chemistry Letters 8(2): 188-194.
- Trindade M, Salgado HJ (2017) Development and validation of a modern and stability indicating method for the quantification of ceftriaxona sodium in powder for injection by infrared spectroscopy. Physical Chemistry 7(3): 55-62.
- Cruz JC, Nascimento MA, Teixeira AM, Oliveira AF, Lopes RP (2018) Development of a method for the determination of amoxicillin in capsules by potentiometric titration. The Journal of Engineering and Exact Sciences 4(2): 0234-0239.
- Fanelli S, Zimmermann A, Totóli EG, Salgado HR (2018) FTIR Spectrophotometry as a green tool for quantitative analysis of drugs: Practical application to amoxicillin.
- Antakli S, Nejem L, Ahmad WA (2019) Determination of Amoxicillin Trihydrate by Analytical Spectrophotometry. Research Journal of Pharmacy and Technology 12(6): 2716-2720.
- Alotaibi N, Overton S, Curtis S, Nickerson JW, Attaran A (2017) Toward Point- of-Care Drug Quality Assurance in Developing Countries: Comparison of Liquid Chromatography and Infrared Spectroscopy Quantitation of a Small-Scale Random Sample of Amoxicillin. The American journal of tropical medicine and hygiene 99(2): 477-481.
- Gandhi SV, Mahajan MR (2019) Method development, validation and comparative study of generic vs. branded generic formulations of amoxicillin trihydrate in capsule dosage form. Journal of Drug Delivery and Therapeutics 9(3): 186-192.
- Divya V, Pallela SL, Shaik M, Pedapudi UC, Srividya (2019) Method development and validation of amoxicillin in bulk and pharmaceutical dosage form by UV spectroscopy. International Journal of Pharmacy and Analytical Research.
- (2005) The United States pharmacopeia. Rockville, MD: United States Pharmacopeial Convention.
- (2007) British pharmacopoeia 2008. London: Stationery Office.
- (2020) Shimadzu UV-1800 UV/Visible Scanning Spectrophotometer; 115 VAC from Cole-Parmer.
- (2011) Agilent Technologies, Inc. Specifications of Agilent Cary 630 FTIR [Internet] USA: Agilent Technologies.
- (2019) Agilent Technologies, Inc. Agilent Cary 630 FTIR Spectrometer [Internet] USA: Agilent Technologies.
- (2017) Agilent Technologies, Inc. Operation manual of Agilent MicroLab Software [Internet] USA: Agilent Technologies.
